

In Vivo Modeling of CLL Transformation to Richter Syndrome Reveals Convergent Evolutionary Paths and Therapeutic Vulnerabilities
- PMID: 36468984
- PMCID: PMC9975769
- DOI: 10.1158/2643-3230.BCD-22-0082
In Vivo Modeling of CLL Transformation to Richter Syndrome Reveals Convergent Evolutionary Paths and Therapeutic Vulnerabilities
Abstract
Transformation to aggressive disease histologies generates formidable clinical challenges across cancers, but biological insights remain few. We modeled the genetic heterogeneity of chronic lymphocytic leukemia (CLL) through multiplexed in vivo CRISPR-Cas9 B-cell editing of recurrent CLL loss-of-function drivers in mice and recapitulated the process of transformation from indolent CLL into large cell lymphoma [i.e., Richter syndrome (RS)]. Evolutionary trajectories of 64 mice carrying diverse combinatorial gene assortments revealed coselection of mutations in Trp53, Mga, and Chd2 and the dual impact of clonal Mga/Chd2 mutations on E2F/MYC and interferon signaling dysregulation. Comparative human and murine RS analyses demonstrated tonic PI3K signaling as a key feature of transformed disease, with constitutive activation of the AKT and S6 kinases, downmodulation of the PTEN phosphatase, and convergent activation of MYC/PI3K transcriptional programs underlying enhanced sensitivity to MYC/mTOR/PI3K inhibition. This robust experimental system presents a unique framework to study lymphoid biology and therapy.
Significance: Mouse models reflective of the genetic complexity and heterogeneity of human tumors remain few, including those able to recapitulate transformation to aggressive disease histologies. Herein, we model CLL transformation into RS through multiplexed in vivo gene editing, providing key insight into the pathophysiology and therapeutic vulnerabilities of transformed disease. This article is highlighted in the In This Issue feature, p. 101.
© 2022 American Association for Cancer Research.
Figures
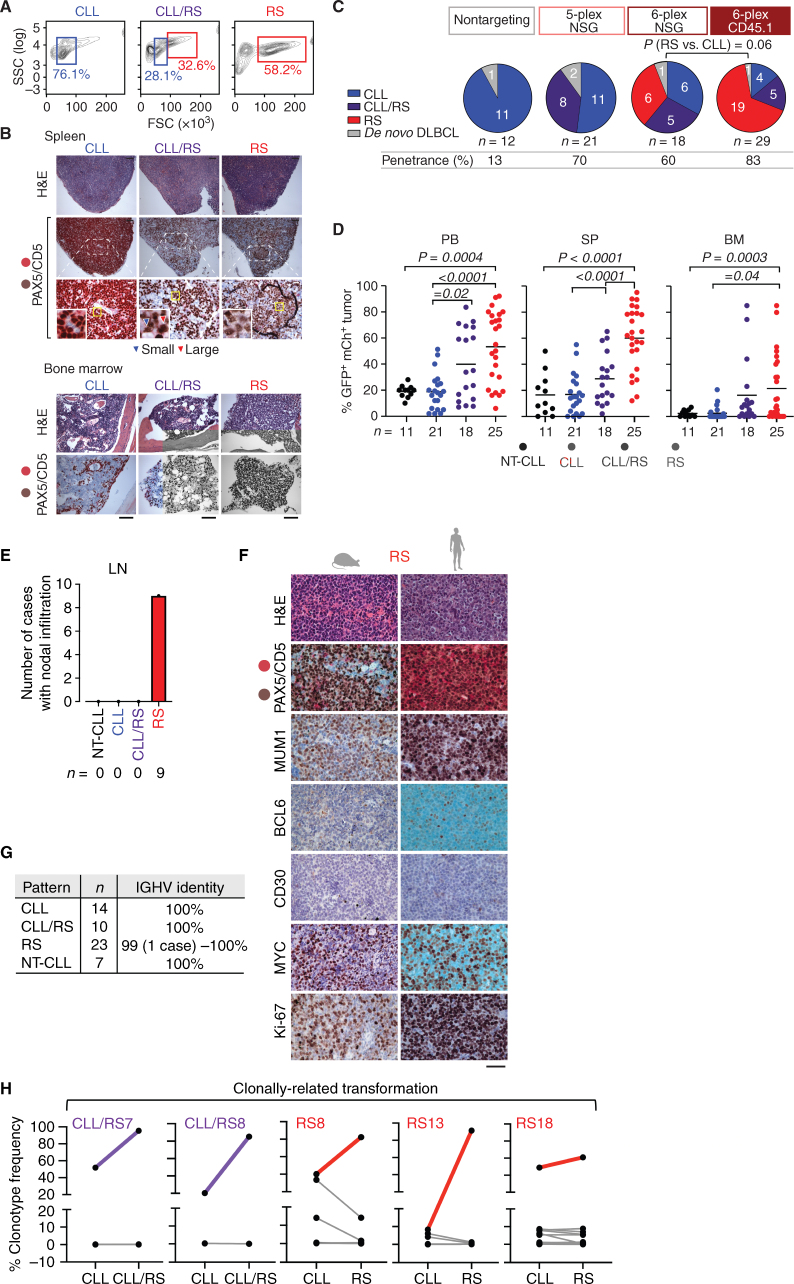
![Figure 1. Multiplexed CRISPR editing of CLL-LOF lesions generates chronic lymphocytic leukemia disease models. A, Schema for the generation of transplant lines. BM donor lines containing homozygous del(13q) and B-cell–restricted Cas9-GFP [i.e., del(13q)-Cd19Cas9-GFP] were obtained by intercrossing del(13q)-Cd19cre/cre and del(13q)-Cas9/Cas9 mice. LSKs isolated from 8- to 12-week-old del(13q)-Cd19Cas9 animals were transduced in vitro with a pool of lentivirus expressing sgRNAs against the 6 or 5 LOF mutations of interest (Atm, Mga, Samhd1, Chd2, Birc3, Trp53 in “6-plex”; Trp53 absent in “5-plex”) or corresponding nontargeting pools of scrambled sgRNAs and transplanted into 8- to 12-week-old immune-competent (CD45.1) or immune-deficient (NSG) recipients (n = 30–35/group). B, Single-cell qPCR-based analysis of sgRNA expression in LSK from the 3 targeting and the 3 nontargeting cohorts, as assessed at 72 hours after transduction and in vitro culture. The number of sgRNAs quantified in individual single cells is displayed. C, Percent (%) animals with circulating CLL in targeting and nontargeting cohorts. P, Fisher exact test. D, Longitudinal tumor burden assessments by flow-cytometric analysis of peripheral bleeds. A logistic mixed-effects model was used to estimate the average trajectories of peripheral longitudinal tumor burden (%GFP+mCh+B220+CD5+Igκ+ cells) in individual mice from the targeting (6-plex: dark brown; 5-plex: salmon) and nontargeting cohorts (gray). Disease onset and survival (median and range) for each cohort are indicated.](https://cdn.ncbi.nlm.nih.gov/pmc/blobs/b1d4/9975769/aeaaca96d749/150fig1.jpg)
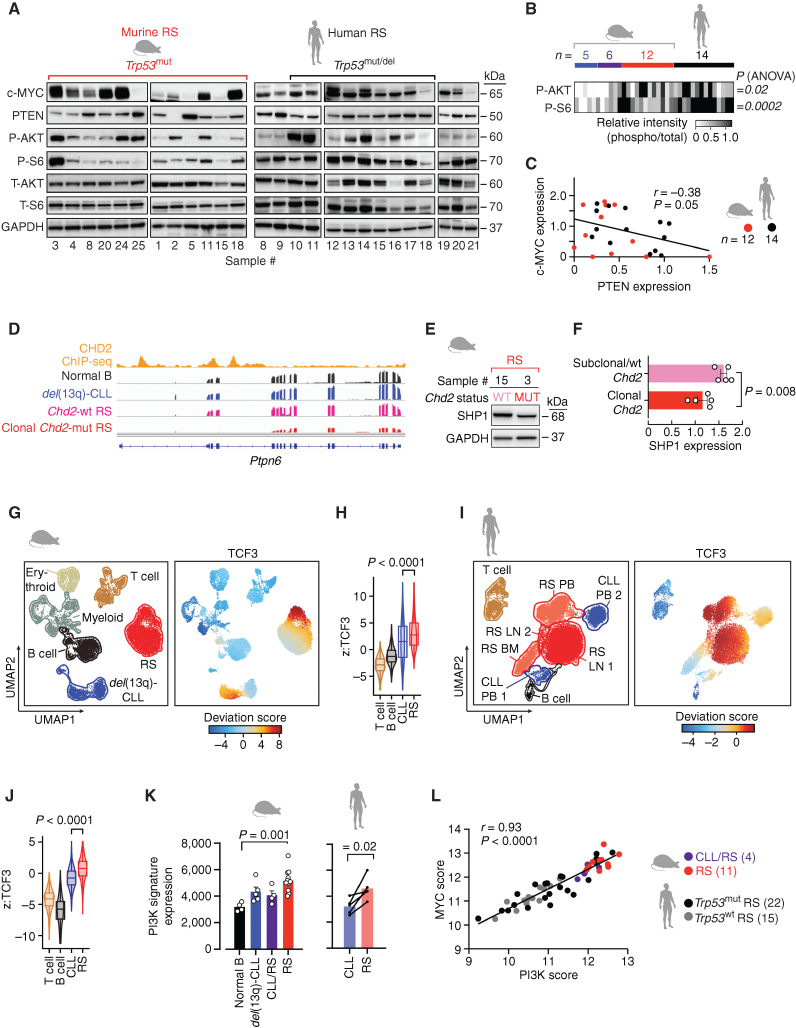
![Figure 6. MYC/mTOR/PI3K signaling are targetable vulnerabilities of RS. A, Summary heat map of drug treatment studies of murine primary splenocytes [7 del(13q)-CLL, 3 CLL/RS, and 12 RS] and 5 human RS cases. Percent (%) viability compared with the DMSO control is displayed. B, Bar plots showing percent (%) viability after JQ1, everolimus, duvelisib, palbociclib, and alisertib treatment. Mean with SEM is displayed. P, ANOVA. C, Correlation between response to duvelisib (% viability) and phospho-AKT levels, as detected by immunoblot in 5 del(13q)-CLL, 2 CLL/RS, 8 murine RS, and 14 human RS cases. P, Pearson correlation. D, Correlation between response to everolimus (% viability) and phospho-S6 levels on the same set of samples per C, as detected by immunoblot. P, Pearson correlation. E, Immunoblot assessment of c-MYC expression levels following a 12-hour treatment with single-agent duvelisib, everolimus, JQ1 or respective duvelisib-based combinations. One representative mouse and human samples are shown and GAPDH is used as loading control. F, Percent (%) viability normalized to DMSO control of 4 murine and 3 human RS primary specimens treated for 40 hours with single-agent duvelisib, everolimus, JQ1, or respective duvelisib-based combinations. Mean with SEM is displayed. P value, ANOVA with Tukey correction for multiple comparisons. G, Transplant schema for combination treatment studies and survival curve of NSG mice transplanted with RS splenocytes and then treated with 50 mg/kg duvelisib, 10 mg/kg everolimus, or combination (left), or 50 mg/kg duvelisib, 50 mg/kg JQ1, or combination (right) for 2 weeks followed by observation until survival endpoints. P values, log-rank test with Bonferroni correction for multiple comparisons. The pink shaded area indicates the treatment period.](https://cdn.ncbi.nlm.nih.gov/pmc/blobs/b1d4/9975769/27ef79f3802c/150fig6.jpg)
Comment in
- 2643-3230. doi: 10.1158/2643-3230.BCD-4-2-ITI
References
-
- Klein U, Lia M, Crespo M, Siegel R, Shen Q, Mo T, et al. The DLEU2/miR-15a/16-1 cluster controls B cell proliferation and its deletion leads to chronic lymphocytic leukemia. Cancer Cell 2010;17:28–40. - PubMed
Publication types
MeSH terms
Substances
Grants and funding
LinkOut - more resources
Full Text Sources
Molecular Biology Databases
Research Materials
Miscellaneous
