

The Adaptive Olfactory Measure of Threshold (ArOMa-T): a rapid test of olfactory function
- PMID: 36469087
- PMCID: PMC9798529
- DOI: 10.1093/chemse/bjac036
The Adaptive Olfactory Measure of Threshold (ArOMa-T): a rapid test of olfactory function
Abstract
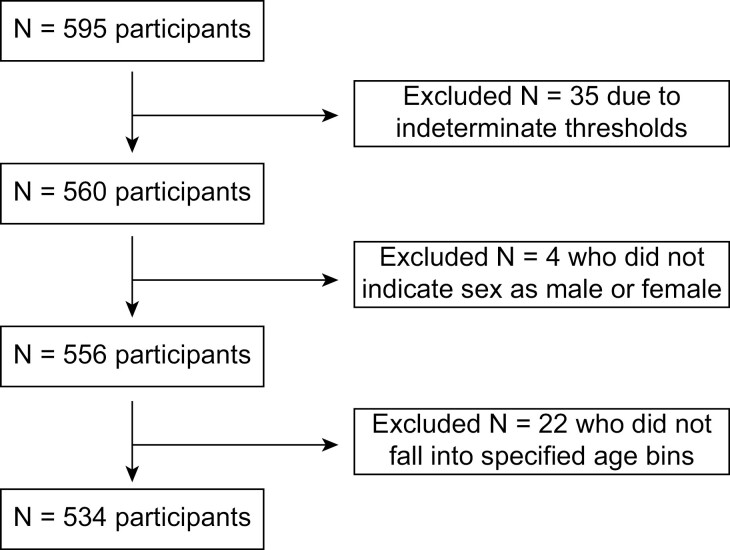
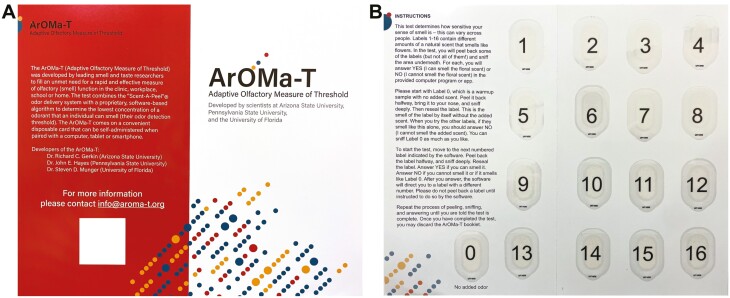
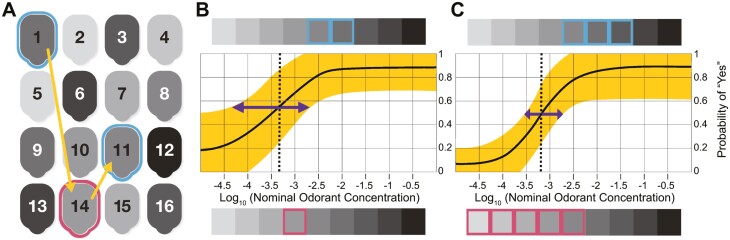
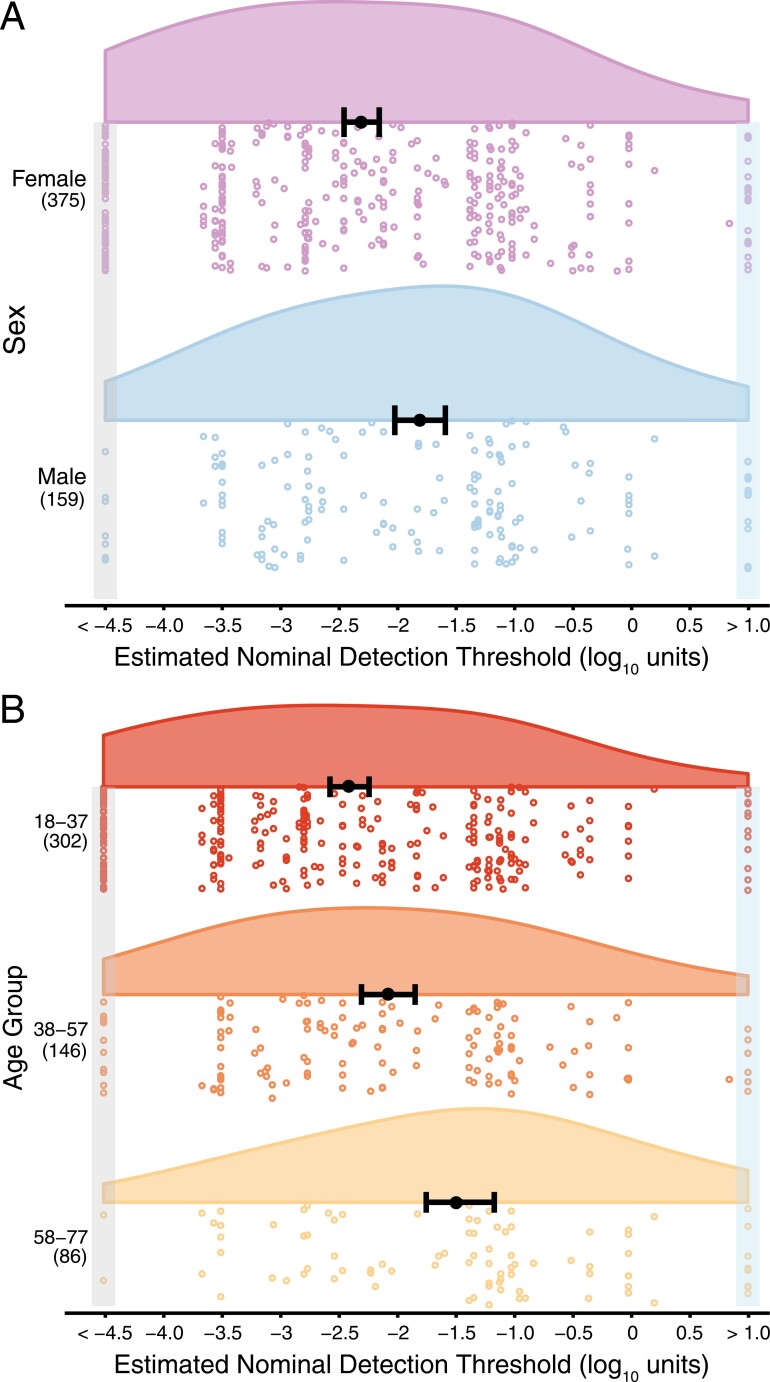
Many widely used psychophysical olfactory tests have limitations that can create barriers to adoption. For example, tests that measure the ability to identify odors may confound sensory performance with memory recall, verbal ability, and prior experience with the odor. Conversely, classic threshold-based tests avoid these issues, but are labor intensive. Additionally, many commercially available tests are slow and may require a trained administrator, making them impractical for use in situations where time is at a premium or self-administration is required. We tested the performance of the Adaptive Olfactory Measure of Threshold (ArOMa-T)-a novel odor detection threshold test that employs an adaptive Bayesian algorithm paired with a disposable odorant delivery card-in a non-clinical sample of individuals (n = 534) at the 2021 Twins Day Festival in Twinsburg, OH. Participants successfully completed the test in under 3 min with a false alarm rate of 7.5% and a test-retest reliability of 0.61. Odor detection thresholds differed by sex (~3.2-fold lower for females) and age (~8.7-fold lower for the youngest versus the oldest age group), consistent with prior studies. In an exploratory analysis, we failed to observe evidence of detection threshold differences between participants who reported a history of COVID-19 and matched controls who did not. We also found evidence for broad-sense heritability of odor detection thresholds. Together, this study suggests the ArOMa-T can determine odor detection thresholds. Additional validation studies are needed to confirm the value of ArOMa-T in clinical or field settings where rapid and portable assessment of olfactory function is needed.
Keywords: COVID-19; adaptive algorithm; anosmia; detection threshold; sex differences; smell.
© The Author(s) 2022. Published by Oxford University Press.
Figures
Update of
-
The Adaptive Olfactory Measure of Threshold (ArOMa-T): A rapid test of olfactory function.medRxiv [Preprint]. 2022 Apr 12:2022.03.08.22272086. doi: 10.1101/2022.03.08.22272086. medRxiv. 2022. Update in: Chem Senses. 2022 Jan 1;47:bjac036. doi: 10.1093/chemse/bjac036. PMID: 35313597 Free PMC article. Updated. Preprint.
Similar articles
-
The Adaptive Olfactory Measure of Threshold (ArOMa-T): A rapid test of olfactory function.medRxiv [Preprint]. 2022 Apr 12:2022.03.08.22272086. doi: 10.1101/2022.03.08.22272086. medRxiv. 2022. Update in: Chem Senses. 2022 Jan 1;47:bjac036. doi: 10.1093/chemse/bjac036. PMID: 35313597 Free PMC article. Updated. Preprint.
-
Affordable Rapid Olfaction Measurement Array: A Novel, Essential Oil-Based Test Strongly Correlated with UPSIT and Subjective Outcome Measures.Ann Otol Rhinol Laryngol. 2020 Jan;129(1):39-45. doi: 10.1177/0003489419870833. Epub 2019 Aug 16. Ann Otol Rhinol Laryngol. 2020. PMID: 31416326
-
Clinical validation of the olfactory detection threshold module of the Snap & Sniff® olfactory test system.Int Forum Allergy Rhinol. 2019 Sep;9(9):986-992. doi: 10.1002/alr.22377. Epub 2019 Jul 8. Int Forum Allergy Rhinol. 2019. PMID: 31283113
-
The perception of odor is not a surrogate marker for chemical exposure: a review of factors influencing human odor perception.Clin Toxicol (Phila). 2013 Feb;51(2):70-6. doi: 10.3109/15563650.2013.767908. Clin Toxicol (Phila). 2013. PMID: 23387344 Review.
-
Assessment of Olfactory Function in Children and Adolescents: An Overview.Chem Senses. 2021 Jan 1;46:bjab027. doi: 10.1093/chemse/bjab027. Chem Senses. 2021. PMID: 34237138 Review.
Cited by
-
Home screening of taste and oral trigeminal function: a feasibility study.Eur Arch Otorhinolaryngol. 2024 Sep;281(9):4835-4844. doi: 10.1007/s00405-024-08654-5. Epub 2024 Apr 17. Eur Arch Otorhinolaryngol. 2024. PMID: 38630275 Free PMC article.
-
Towards universal chemosensory testing: needs, barriers, and opportunities.Chem Senses. 2025 Jan 22;50:bjaf015. doi: 10.1093/chemse/bjaf015. Chem Senses. 2025. PMID: 40390292 Free PMC article.
-
Predicting Post-Mortem α-Synuclein Pathology by the Combined Presence of Probable REM sleep behavior disorder and Hyposmia.Mov Disord Clin Pract. 2025 Feb;12(2):157-165. doi: 10.1002/mdc3.14244. Epub 2024 Nov 5. Mov Disord Clin Pract. 2025. PMID: 39499184 Free PMC article.
-
Alpha-synuclein pathology and Parkinson's disease-related olfactory dysfunctions: an update on preclinical models and therapeutic approaches.Mamm Genome. 2025 Jun;36(2):444-464. doi: 10.1007/s00335-025-10128-w. Epub 2025 Apr 28. Mamm Genome. 2025. PMID: 40293510 Free PMC article. Review.
-
Functional connectivity patterns in parosmia.Behav Brain Funct. 2023 Dec 19;19(1):24. doi: 10.1186/s12993-023-00225-8. Behav Brain Funct. 2023. PMID: 38115149 Free PMC article.
References
-
- Brämerson A, Johansson L, Ek L, Nordin S, Bende M.. Prevalence of olfactory dysfunction: the Skövde population-based study. Laryngoscope. 2004;114(4):733–737. - PubMed
-
- Cain WS, Stevens JC.. Uniformity of olfactory loss in aging. Ann N Y Acad Sci. 1989;561(1):29–38. - PubMed
-
- Cometto-Muñiz JE, Cain WS.. Thresholds for odor and nasal pungency. Physiol Behav. 1990;48(5):719–725. - PubMed
Publication types
MeSH terms
Grants and funding
LinkOut - more resources
Full Text Sources
Medical
