. 2023 Feb 6;220(2):e20220618.
doi: 10.1084/jem.20220618. Epub 2022 Dec 5.

Arachnoid granulations are lymphatic conduits that communicate with bone marrow and dura-arachnoid stroma

Affiliations

Arachnoid granulations are lymphatic conduits that communicate with bone marrow and dura-arachnoid stroma

Trishna Shah et al. J Exp Med. .

Abstract

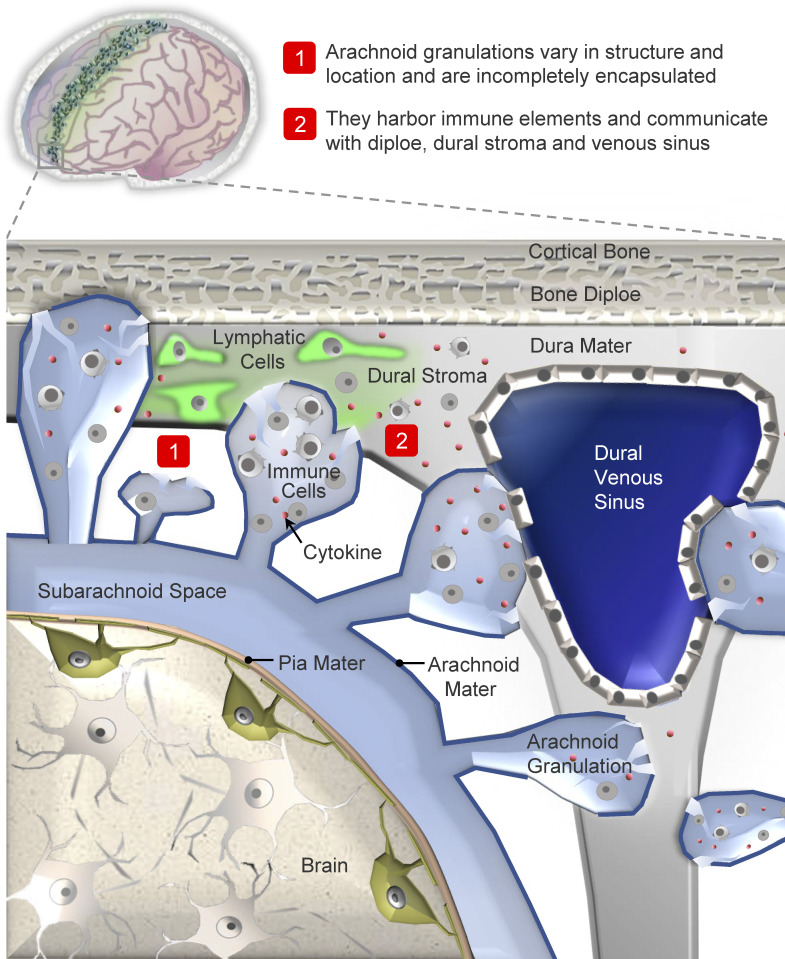
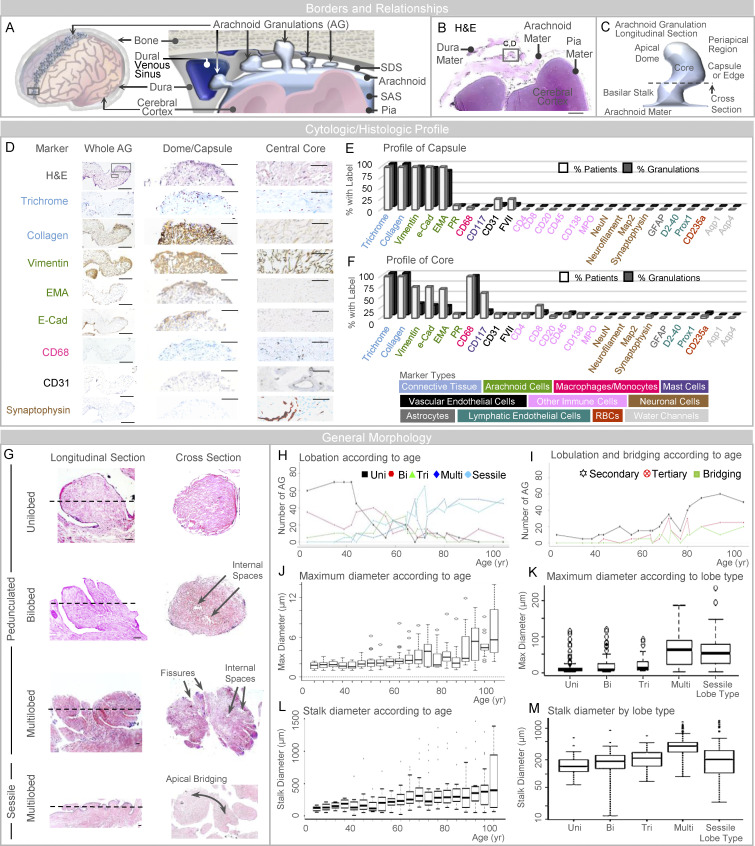
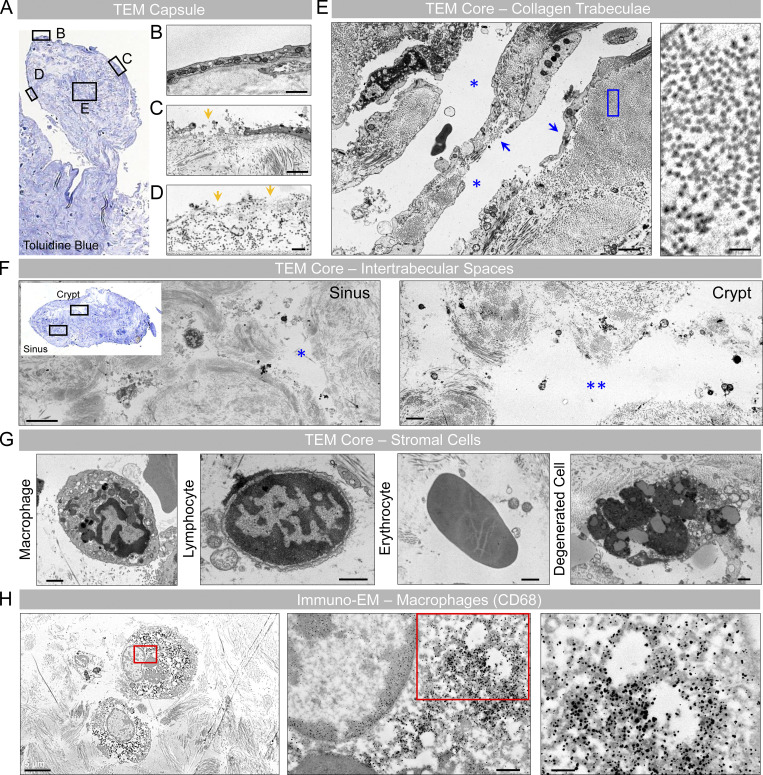
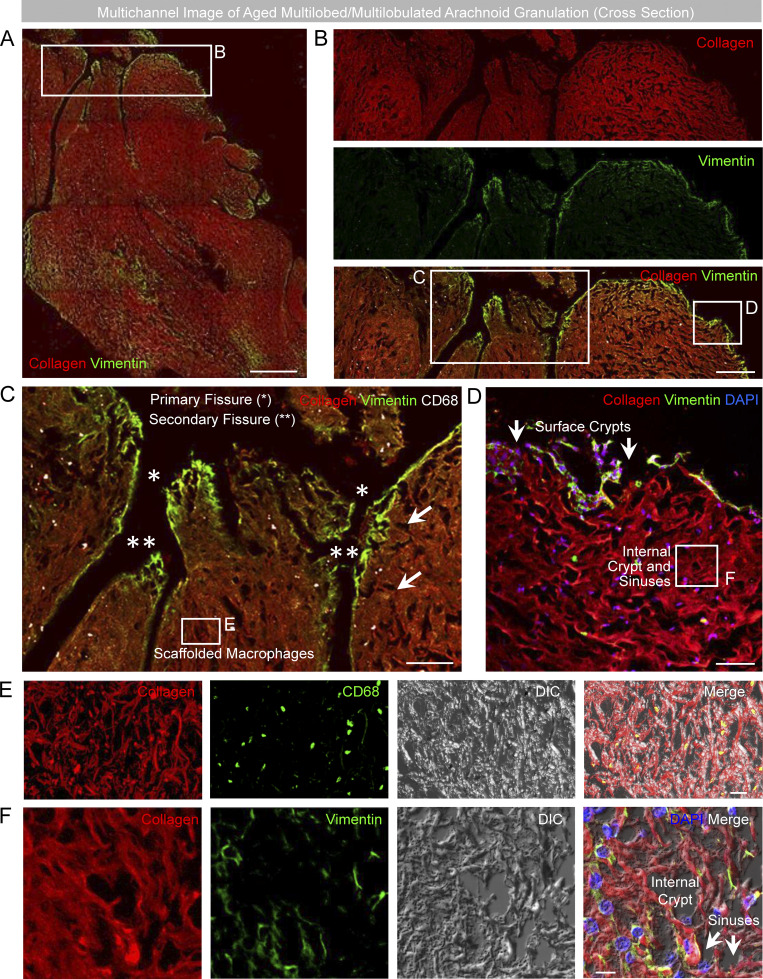
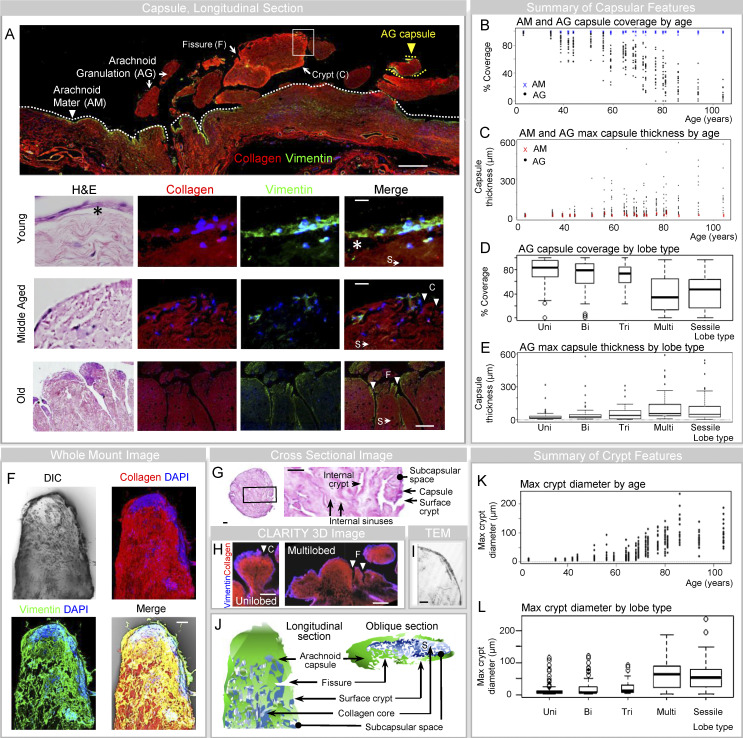
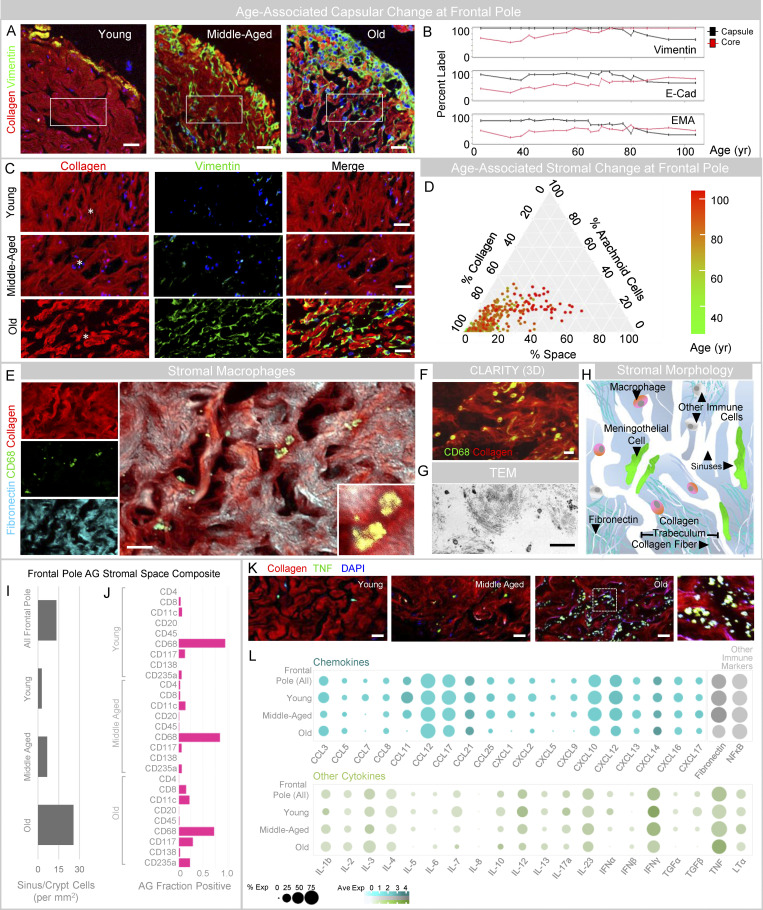
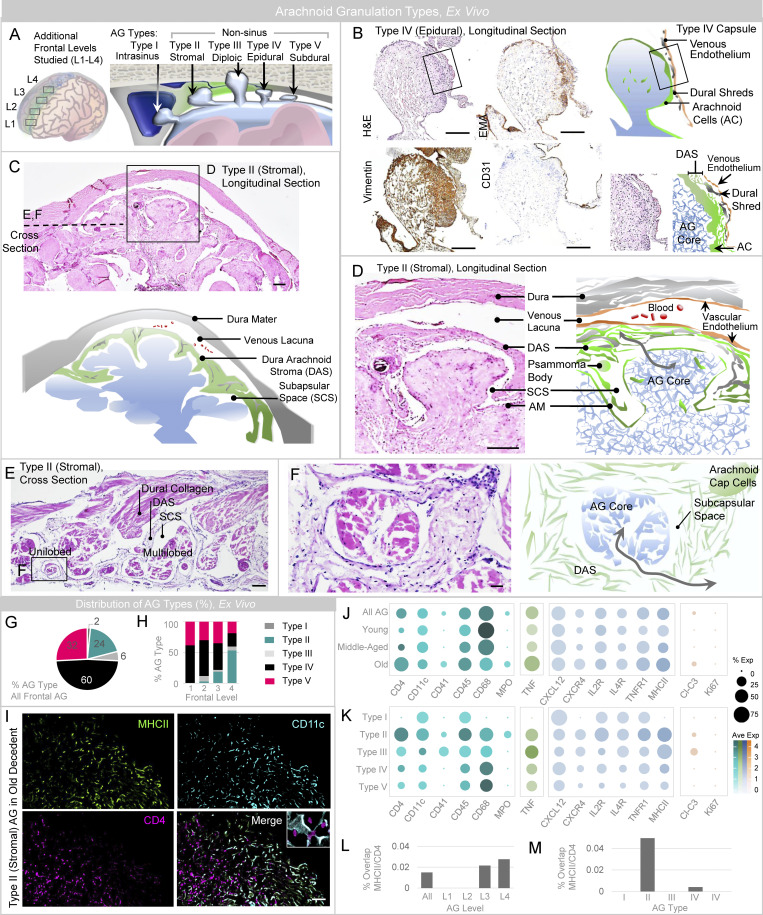
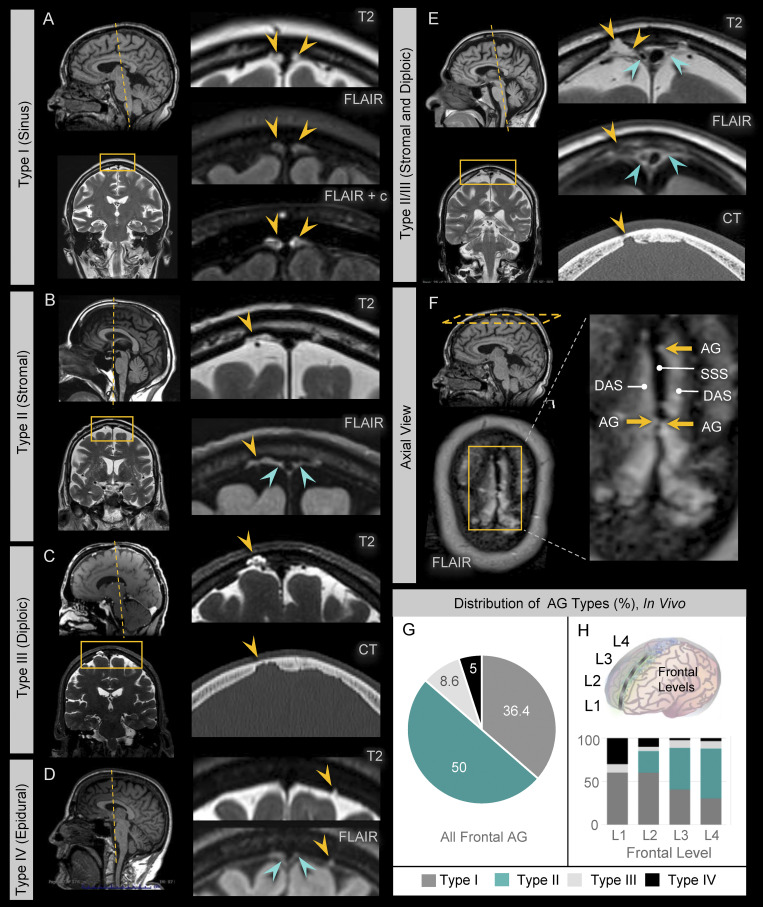
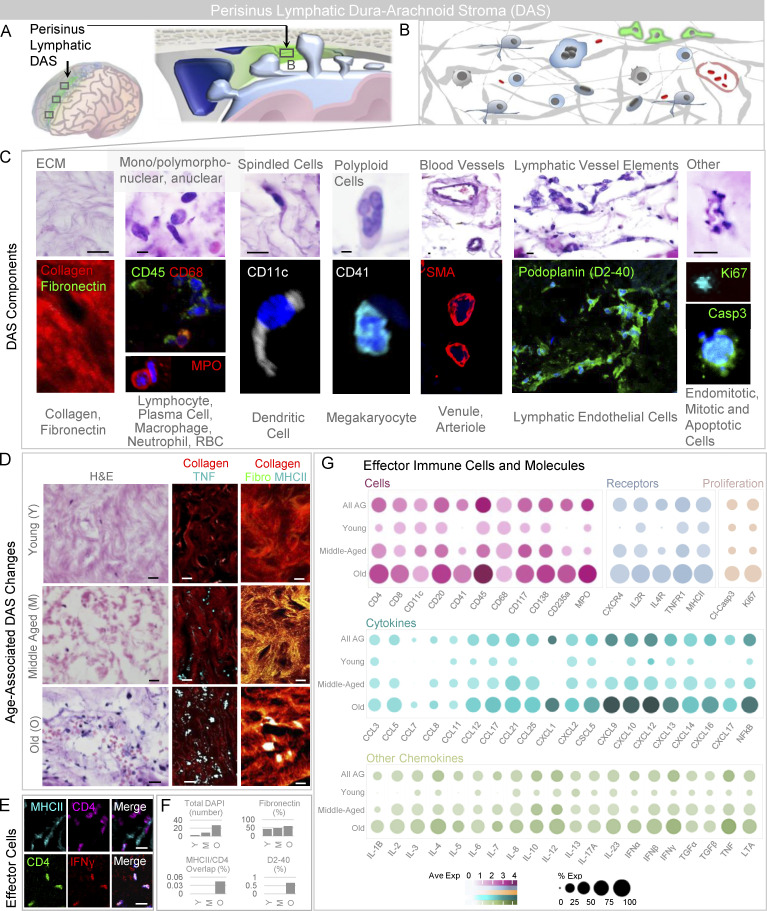
Arachnoid granulations (AG) are poorly investigated. Historical reports suggest that they regulate brain volume by passively transporting cerebrospinal fluid (CSF) into dural venous sinuses. Here, we studied the microstructure of cerebral AG in humans with the aim of understanding their roles in physiology. We discovered marked variations in AG size, lobation, location, content, and degree of surface encapsulation. High-resolution microscopy shows that AG consist of outer capsule and inner stromal core regions. The fine and porous framework suggests uncharacterized functions of AG in mechanical CSF filtration. Moreover, internal cytokine and immune cell enrichment imply unexplored neuroimmune properties of these structures that localize to the brain-meningeal lymphatic interface. Dramatic age-associated changes in AG structure are additionally identified. This study depicts for the first time microscopic networks of internal channels that communicate with perisinus spaces, suggesting that AG subserve important functions as transarachnoidal flow passageways. These data raise new theories regarding glymphatic-lymphatic coupling and mechanisms of CSF antigen clearance, homeostasis, and diseases.


Conflict of interest statement

Disclosures: The authors declare no competing interests exist.

Figures

None
Graphical abstract
Figure 1.
Figure 1.
AG abut dura mater and are heterogeneous in size, form, and composition. (A) A schematic depicts the general arrangement of AG in the superior parasagittal frontal brain region. (B) Similarly, low-power image of an H&E-stained frontal pole section illustrates basic meningeal relationships. (C) Schematic depiction of a single granulation, shown in longitudinal orientation, summarizes its general morphology which includes a capsule or edge, core, basilar stalk or neck, and apical dome region. (D) Intermediate-power images further illustrate labels of an isolated granulation, including dome capsule and central core regions. (E and F) Labeling profiles of each granulation are summarized from all patients at the granulation capsule (or edge) and inner core, respectively, in E and F; cell marker types used for initial screening are shown in the lower panel. (G) As illustrated, AG are pedunculated (or polypoid) and unilobed, bilobed, trilobed, or multilobed; or are sessile and plaque-like in morphology; some granulations exhibit secondary and tertiary lobulations with or without apical bridging. (H and I) The number of morphologies and the number of lobulated and bridged granulations are summarized by age in H and I, respectively. (J and K) Maximum diameter is shown according to age and lobe type in J and K, respectively. (L and M) Stalk diameter is shown according to age and lobe type in L and M, respectively. Scale bars: (B) 500 µm; (D [left]) 200 µm; (D [middle and right]) 50 µm; (G) 20 µm. Bi, bilobed; EMA, epithelial membrane antigen; Multi, multilobed; PR, progesterone receptor; Tri, trilobed; Uni, unilobed. Dotted lines in G represent the approximate orientation of cross-section shown on the right-hand side. Data represent findings in 400 frontal pole granulations from 20 decedents and are from more than two independent experiments.
Figure S1.
Figure S1.
Ultrastructural images of a unilobed AG depict its surface and internal morphology. (A) Toluidine blue–stained thin section of a unilobed AG displays the AG stalk and body in longitudinal orientation. (B–D) Ultrastructural images of different surface (boxed) regions demonstrate areas of intact (B), partial (C), or no (D) capsular coverage. Note areas of communication between the AG core and periapical region (yellow arrows in C and D). (E) The internal core stroma depicts trabeculae that are unlined (left arrow) or lined (right arrow) by fibroblast-like cells, consistent with meningothelium. High-power micrograph image of the blue boxed area is shown in the inset at right and demonstrates a trabeculum comprised of densely packed collagen fibrils. (F) A toluidine blue–stained thin section of a different granulation from the same decedent is shown in axial orientation, along with micrographs of the boxed areas. Note sinuses on the left and larger, gaping crypt spaces on the right-hand side. Both the sinus and crypt spaces contain cell debris and rounded mononuclear cells at their margins. (G) Enlarged images of sinus and crypt spaces show diverse cell types. (H) On an immuno-EM image prepared using a primary antibody directed toward CD68, many rounded stromal cells are confirmed as macrophages; see insets (i.e., enlargements of red boxed areas) at right-hand side that depict cytoplasmic and lysosomal electron-dense label. (A and F [inset]) Toluidine blue–stained thin sections; (B–G) TEM; (H) immuno-electron micrograph. Scale bars: (B, C, and E [left]) 2 µm; (D and H [middle]) 500 nm; (E [right] and H [right]) 200 nm; (F and H [left]) 5 µm; (G) 1 µm. Single blue asterisk (*) represents a sinus space. Double blue asterisks (**) represent a crypt space. Features shown are from a middle-aged adult. Data summarize findings in >30 granulations from frontal pole AG of three decedents and are from more than two independent experiments.
Figure S2.
Figure S2.
Fluorescent images of a multilobed AG depict relationships of fissures, sinuses, and crypts within the irregular stromal cavernous space network. (A) Multichannel images of a multilobed AG, shown in cross section, demonstrate its irregular morphology. (B) Cropped images of one edge show multiple indentations at the capsular surface. (C) The larger indentations with vimentin-positive lining delineate meningothelium-coated fissures, which impart distinct lobes. (D) Smaller surface apertures represent sinuses and crypt openings that are shown in communication with the periapical space. (E and F) Internal CD68+ macrophages (C and E) and sinuses and crypts (F) are depicted in multichannel images. (A–F) Green/FITC, vimentin or CD68; red/CY3, pan-collagen; white/CY5, CD68; blue, DAPI; DIC, differential interference contrast. Scale bars: (A) 100 µm; (B) 50 µm; (C) 25 µm; (D–F) 10 µm. Single asterisks (*) represent primary fissures. Double asterisks (**) represent secondary fissures that branch off of primary fissures. Arrows represent sinus and crypt spaces. Images are confocal z-stacks. Note that internal cavernous spaces are formed by smaller sinuses and larger, lake-like crypts that communicate directly with the periapical region at multiple foci of surface capsular deficiency. Data are representative of multilobed morphology from eight old decedents, studied on >75 independent experiments.
Figure 2.
Figure 2.
The meningothelial AG capsule is irregularly perforated by fissures, sinuses, and crypts. (A) Low-power montage image of human leptomeninges highlights vimentin+ meningothelium covering collagen of arachnoid mater (AM, white arrowhead) and AG cores (AG, yellow arrowhead). In the lower panels, AG capsules are shown in young, middle-aged, and old individuals. (B) The percentages of vimentin label (i.e., % AM and AG coverage) are shown for each person according to age. (C) The capsule thicknesses (i.e., maximum thickness of vimentin+ layer) for AM and AG are summarized for each person. (D) The percent coverage of AG is additionally summarized according to lobe type. (E) AG arachnoid thickness is summarized according to lobe type. (F) Multichannel image of an AG lobule is shown and depicts multifocal capsular interruption. (G) As shown on an H&E-stained cross-section of a unilobed AG, the capsular interruptions correspond to surface sinus and crypt openings. (H–J) Capsules, fissures, and/or crypts are further demonstrated on 3D CLARITY (H), TEM (I), and schematic (J) images. (K and L) Maximum crypt diameters are shown according to age (K) and lobe type (L). (A, F, and H) Red/CY3, pan-collagen; green/FITC, vimentin; blue, vimentin or DAPI; DIC, differential interference contrast. Scale bars: (A [upper and lower panels]) 500 µm; (A [second panel] and F) 10 µm; (A [third panel] and G) 20 µm; (H) 200 µm; (I) 2 µm. Bi, bilobed; C, crypt; F, fissure; Max, maximum; Multi, multilobed pedunculated; S, sinus; Tri, trilobed; Uni, unilobed. Multichannel images represent confocal Z-stack images. The asterisks (*) in A denote the subcapsular space. Vimentin+ areas also expressed e-cadherin and epithelial membrane antigen (EMA) in similar pattern and displayed nuclear pseudoinclusions, indicative of arachnoid cells. Additional images from the lower panel of A are shown in Fig. S2. Data represent mean or median values from 400 frontal pole granulations from 20 decedents and are from more than two independent experiments.
Figure 3.
Figure 3.
The framework and composition of AG stroma change with age. (A) Fluorescent images of AG, shown at intermediate power from young, middle-aged, and old individuals demonstrate collagen-enrichment within stromal cores. (B) Ingrowth of capsular elements is more pronounced in older individuals, as demonstrated in a plot depicting percent label of arachnoid markers in capsule and core regions according to age. (C) Enlarged cropped images of the core show collagen arrangement into fibrillar and trabecular patterns, which give rise to internal sinus and crypt spaces. (D) The AG core composite is summarized based on percent stromal label in an age-coded barycentric plot and illustrates the diminishment of collagen and enhancement of space content with age. (E–H) Cavernous space immune cells are shown in confocal (E), 3D CLARITY (F), TEM (G), and schematic (H) images. (I and J) Quantification of DAPI label in vimentin AG core regions is shown in all, young, middle-aged, and old persons (I), and presence of immune cells (i.e., the fraction of AG positive for marker) is shown in J. (K) TNF label within sinuses and crypts is further demonstrated in AG from young, middle-aged, and old decedents. (L) Semiquantitative cytokine and immune label results are summarized. (A, C, E, F, and K) Green/FITC, vimentin, CD68, or TNF; red/CY3, pan-collagen; cyan/CY5, fibronectin; blue, DAPI. Scale bars: (A) 50 μm; (C) 20 μm; (E, F, G, and K) 10 μm. The asterisks (*) in C denote sinus spaces. Data represent findings in 400 frontal pole granulations from 20 decedents and are from more than two independent experiments.
Figure 4.
Figure 4.
Sinus and nonsinus AG types are observed on postmortem examination. (A) A schematic depicts frontal levels studied on expanded frontal convexity sampling (left), and variable AG dome positions identified (right). (B) Intermediate-power image of the frontal perisinus region demonstrates epidural type (i.e., Type IV) AG, in this case with partial trilaminar ensheathment. H&E-stained section shows well-defined meningothelial AG capsule with partial ensheathment by dural connective tissue and DVS enthothelium, as confirmed by immunoperoxidase labels for vimentin, epithelial membrane antigen (EMA), and CD31. A cropped image of the granulation edge, shown on the lower right-hand side, depicts the trilaminar capsular investments. (C) Another image demonstrates stromal type (i.e., Type II) AG, with dome embedment within DAS. (D–F) Enlargements of cropped AG images in longitudinal (D) and cross section (E and F) orientation are shown. The enlarged images depict DAS envelopment of the apical AG dome region and communication of the AG core with the subcapsular space and DAS (gray arrows). (G) AG types present along frontal convexities are summarized. (H) AG types present at distinct frontal levels are summarized. (I) MHCII-expressing APC and CD4-expressing T cells are depicted in sinuses and crypts of a Type II AG, with multifocal label overlap suggesting the presence of immune synapses (inset). (J and K) Results of select immune cell, cytokine, chemokine and other labels are summarized according to age (J) and AG type (K). (L and M) The percent overlap of MHCII (APC) and CD4 (T cell) label, suggestive of immune synapses, is summarized at frontal levels (L) and in distinct AG types (M). (I) Green/FITC, MHCII; violet/CY3, CD4; cyan/CY5, CD11c. Scale bars: (B–D) 200 µm; (E) 100 µm; (F and I) 50 µm. Histological features depicted are from a middle-aged adult. Data summarize findings in 124 granulations from frontal convexities of 15 decedents and are from more than two independent experiments.
Figure 5.
Figure 5.
Sinus and nonsinus AG types are confirmed by in vivo MRI. MRI examination in young, middle-aged, and old persons confirm the presence of sinus and nonsinus granulations. (A) Type I AG have domes (yellow arrows) located at midline abutting the DVS. (B) Type II AG have domes (yellow arrows) located within dural stroma, which is visualized on FLAIR images as hyperintense perisinus soft tissue (green arrows). (C) Type III AG have domes (yellow arrows) located within skull diploe and are associated with cortical defects of the inner calvarium. (D) Type IV AG have domes (yellow arrows) that are neither intrasinus nor intrastromal in location and abut dura without eroding the calvarial cortex; Type V AG are not definitively observed in this series. (E) Multilobulated hybrid AG types were also occasionally observed, as shown in this example of a Type II/III AG that displayed both stromal and diploic dome embedment. (F) Axial FLAIR image at the calvarial vertex shows superior sagittal sinus (SSS) in the midline with surrounding FLAIR hyperintensity due to a combination of proteinaceous DAS and Type I and Type II AG. Note irregularity of the SSS at the site of Type I AG. (G and H) The distribution of AG types is summarized along the frontal convexities (G) and (H) at distinct frontal levels and highlight a greater percentage of stromal type AG at posterior regions. Data represent 220 frontal granulations from 15 subjects.
Figure S3.
Figure S3.
The perisinus DAS harbors mixed immune cells, immune synapses, and lymphatic endothelial components. (A) The perisinus region houses DAS. (B) This stroma contains extracellular matrix elements, vessels, and heterogeneous cell types. (C) Cropped intermediate-power H&E-labeled and immunofluorescent images of the stromal tissue reveals collagen and fibronectin-rich matrix admixed with immune cells, proliferating and degenerating cells, and blood vascular and lymphatic vascular elements. (D) Intermediate-power images of DAS from young, middle-aged, and old individuals on routine stain (left) and with pan-collagen and TNF label (middle) or pan-collagen, fibronectin, and MHCII labels (right). (E) In addition to trapped TNF-positive cells and cell debris, effector immune cells are observed within DAS of an old decedent. (F) DAS cellularity, percent fibronectin label, percent overlap of MHCII and CD4 labels, and percent D2-40 label are summarized in young (Y), middle-aged (M), and old (O) decedents. (G) Additional cellular, cytokine, chemokine, and molecular label results are summarized according to age, and highlight heterogeneity of immune components in DAS tissue. (C–E) Green or violet/FITC, fibronectin (fibro), CD45, podoplanin, cleaved-caspase 3, Ki67, or CD4; red/CY3, pan-collagen, CD68, myeloperoxidase, SMA, or IFN-γ (γ); white or cyan/CY5, CD11c, CD41, TNF, or MHCII; blue, DAPI. Scale bars: (C and D [right]) 5 µm; (D [left and middle] and E) 10 µm. Data summarize findings in 27 DAS sections from nine decedents and are from >two independent experiments.

Comment in

  • CSF-to-dura gateways.
    Thomas JL, Benveniste H. Thomas JL, et al. J Exp Med. 2023 Feb 6;220(2):e20221719. doi: 10.1084/jem.20221719. Epub 2022 Dec 6. J Exp Med. 2023. PMID: 36472584 Free PMC article.

References

    1. Absinta, M., Ha S.K., Nair G., Sati P., Luciano N.J., Palisoc M., Louveau A., Zaghloul K.A., Pittaluga S., Kipnis J., and Reich D.S.. 2017. Human and nonhuman primate meninges harbor lymphatic vessels that can be visualized noninvasively by MRI. Elife. 6:e29738. 10.7554/eLife.29738 - DOI - PMC - PubMed
    1. Albayram, M.S., Smith G., Tufan F., Tuna I.S., Bostancıklıoğlu M., Zile M., and Albayram O.. 2022. Non-invasive MR imaging of human brain lymphatic networks with connections to cervical lymph nodes. Nat. Commun. 13:203. 10.1038/s41467-021-27887-0 - DOI - PMC - PubMed
    1. Amor, S., Peferoen L.A., Vogel D.Y., Breur M., van der Valk P., Baker D., and van Noort J.M.. 2014. Inflammation in neurodegenerative diseases: An update. Immunology. 142:151–166. 10.1111/imm.12233 - DOI - PMC - PubMed
    1. Brunori, A., Vagnozzi R., and Giuffrè R.. 1993. Antonio Pacchioni (1665-1726): Early studies of the dura mater. J. Neurosurg. 78:515–518. 10.3171/jns.1993.78.3.0515 - DOI - PubMed
    1. Conegero, C.I., and Chopard R.P.. 2003. Tridimensional architecture of the collagen element in the arachnoid granulations in humans: A study on scanning electron microscopy. Arq. Neuropsiquiatr. 61:561–565. 10.1590/S0004-282X2003000400007 - DOI - PubMed

Publication types