. 2022 Dec 5;18(12):e1010747.
doi: 10.1371/journal.pcbi.1010747. eCollection 2022 Dec.

EEG-representational geometries and psychometric distortions in approximate numerical judgment

Affiliations

EEG-representational geometries and psychometric distortions in approximate numerical judgment

Stefan Appelhoff et al. PLoS Comput Biol. .

Abstract

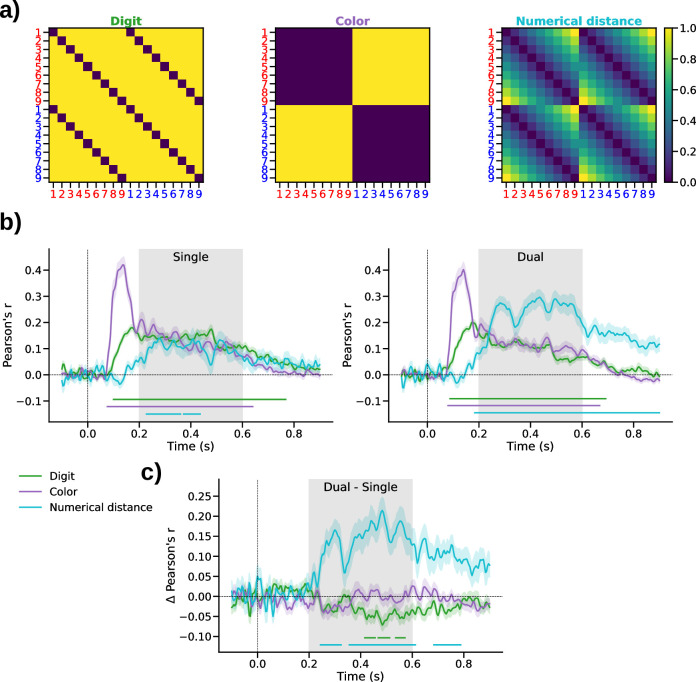
When judging the average value of sample stimuli (e.g., numbers) people tend to either over- or underweight extreme sample values, depending on task context. In a context of overweighting, recent work has shown that extreme sample values were overly represented also in neural signals, in terms of an anti-compressed geometry of number samples in multivariate electroencephalography (EEG) patterns. Here, we asked whether neural representational geometries may also reflect a relative underweighting of extreme values (i.e., compression) which has been observed behaviorally in a great variety of tasks. We used a simple experimental manipulation (instructions to average a single-stream or to compare dual-streams of samples) to induce compression or anti-compression in behavior when participants judged rapid number sequences. Model-based representational similarity analysis (RSA) replicated the previous finding of neural anti-compression in the dual-stream task, but failed to provide evidence for neural compression in the single-stream task, despite the evidence for compression in behavior. Instead, the results indicated enhanced neural processing of extreme values in either task, regardless of whether extremes were over- or underweighted in subsequent behavioral choice. We further observed more general differences in the neural representation of the sample information between the two tasks. Together, our results indicate a mismatch between sample-level EEG geometries and behavior, which raises new questions about the origin of common psychometric distortions, such as diminishing sensitivity for larger values.


Conflict of interest statement

The authors have declared that no competing interests exist.

Figures

Fig 1
Fig 1. Experimental paradigm and behavioral results.
a) Each participant performed two variants of a sequential number integration task. Left: In both variants, participants viewed a stream of ten rapidly presented digits (five in red and five in blue color; in random serial order) drawn from 1 to 9 (uniform random). In the single-stream averaging task, participants were asked to judge whether the average value of all ten samples was higher or lower than 5 (ignoring the samples’ colors). In the dual-stream comparison task, participants were asked to compare the average value of the red samples against that of the blue samples and to report which was larger. Right: In both tasks, the response mapping onto left/right button presses was randomized across trials and cued only after sample presentation, in order to avoid motor preparation confounds. b) Mean accuracy (proportion correct choices) in the two tasks. c) Decision weights of number values in the single-stream (left) and dual-stream (right) tasks. Inset plots illustrate the shape of distortion implied by the best-fitting k (see panel d) according to model Eq 1, with b set to 0 for visual comparability between task conditions. Thin dotted lines show the shape of distortion in the other task for comparison. d) Parameter estimates from fitting our psychometric model to the empirical choice data (cf. c). Error bars in all panels show SE.
Fig 2
Fig 2. RSA results.
a) Model RDMs encoding individual sample attributes. Left, “Digit” model encoding the unique number symbols; Middle, “Color” model encoding whether a sample was red or blue; Right, “Numerical distance” model encoding the samples’ magnitude (1–9). For visual clarity, the model RDMs are illustrated before orthogonalization (see Materials and methods). b) Correlation between orthogonalized model RDMs and the empirical ERP-RDMs in the single-stream (left) and dual-stream (right) task. Colored shadings show SE. Marker lines on bottom indicate significant differences from zero (pcluster<0.005). Gray shading outlines the time window used in subsequent neurometric analysis (see Fig 3 below). c) Difference in correlation between the single- and dual-stream tasks. Same conventions as in b.
Fig 3
Fig 3. Neurometric RSA results.
a) Mean ERP-RDMs in the time window of the numerical distance effect (see gray shading in Fig 2B). b) Mean neurometric maps. Left: single-stream task; right: dual-stream task. Dashed lines indicate linear (k = 1) and unbiased (b = 0) parameterizations. Color scale indicates increase in model correlation (Δ r) relative to the standard model where k = 1 and b = 0. Transparency mask delineates where the increase was statistically significant (p<0.05, FDR corrected). Red markers show maxima (diamond, mean map; dots, individual participant maps).
Fig 4
Fig 4. Univariate CPP/P3 results.
a) Centro-parietal ERPs (mean-subtracted) evoked by sample values 1–9 in the single- (left) and dual-stream (right) tasks. Marker lines on bottom indicate significant differences between the 9 different sample values (pcluster<0.001, repeated measures analysis of variance). b) Mean CPP/P3 amplitudes averaged over the time window outlined by gray shading in a (0.3–0.7 s). c) Neurometric model fit of CPP/P3 amplitudes. Line plot shows grand mean fit. Inset bar graph shows mean parameter estimates. Error indicators in all panels show SE.

References

    1. Bernoulli D. Exposition of a New Theory on the Measurement of Risk. Econometrica. 1954;22: 23. doi: 10.2307/1909829 - DOI
    1. Fechner GT. Elemente der Psychophysik. Breitkopf und Härtel; 1860. Available: https://books.google.de/books?id=6rINAAAAYAAJ
    1. Juechems K, Balaguer J, Spitzer B, Summerfield C. Optimal utility and probability functions for agents with finite computational precision. Proc Natl Acad Sci. 2021;118. doi: 10.1073/pnas.2002232118 - DOI - PMC - PubMed
    1. Li V, Castañón SH, Solomon JA, Vandormael H, Summerfield C. Robust averaging protects decisions from noise in neural computations. PLOS Comput Biol. 2017;13: e1005723. doi: 10.1371/journal.pcbi.1005723 - DOI - PMC - PubMed
    1. Tversky A, Kahneman D. Advances in prospect theory: Cumulative representation of uncertainty. J Risk Uncertain. 1992;5: 297–323. doi: 10.1007/BF00122574 - DOI

Publication types