. 2022 Dec 13;119(50):e2201097119.
doi: 10.1073/pnas.2201097119. Epub 2022 Dec 5.

Regenerative failure of intrahepatic biliary cells in Alagille syndrome rescued by elevated Jagged/Notch/Sox9 signaling

Affiliations

Regenerative failure of intrahepatic biliary cells in Alagille syndrome rescued by elevated Jagged/Notch/Sox9 signaling

Chengjian Zhao et al. Proc Natl Acad Sci U S A. .

Abstract

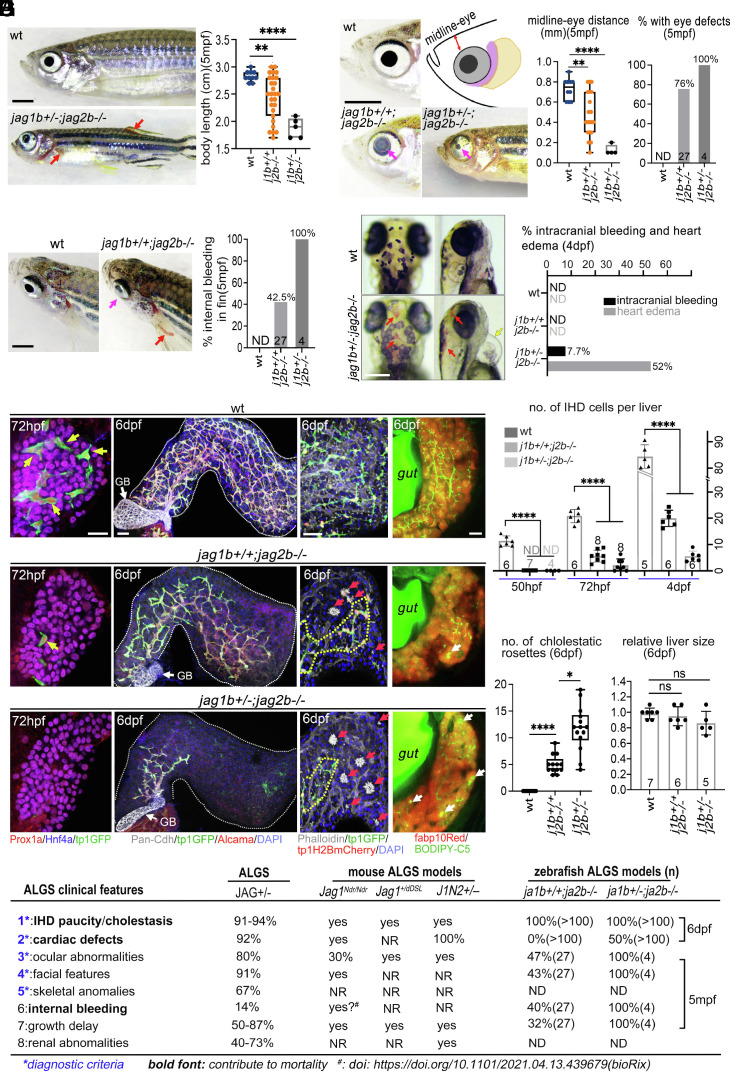
Despite the robust healing capacity of the liver, regenerative failure underlies numerous hepatic diseases, including the JAG1 haploinsufficient disorder, Alagille syndrome (ALGS). Cholestasis due to intrahepatic duct (IHD) paucity resolves in certain ALGS cases but fails in most with no clear mechanisms or therapeutic interventions. We find that modulating jag1b and jag2b allele dosage is sufficient to stratify these distinct outcomes, which can be either exacerbated or rescued with genetic manipulation of Notch signaling, demonstrating that perturbations of Jag/Notch signaling may be causal for the spectrum of ALGS liver severities. Although regenerating IHD cells proliferate, they remain clustered in mutants that fail to recover due to a blunted elevation of Notch signaling in the distal-most IHD cells. Increased Notch signaling is required for regenerating IHD cells to branch and segregate into the peripheral region of the growing liver, where biliary paucity is commonly observed in ALGS. Mosaic loss- and-gain-of-function analysis reveals Sox9b to be a key Notch transcriptional effector required cell autonomously to regulate these cellular dynamics during IHD regeneration. Treatment with a small-molecule putative Notch agonist stimulates Sox9 expression in ALGS patient fibroblasts and enhances hepatic sox9b expression, rescues IHD paucity and cholestasis, and increases survival in zebrafish mutants, thereby providing a proof-of-concept therapeutic avenue for this disorder.

Keywords: ALGS; Cholangiocytes; Jag1; Sox9; zebrafish.


Conflict of interest statement

The authors declare no competing interest.

Figures

Fig. 1.
Fig. 1.
Clinical features of Alagille syndrome are phenocopied by jag1b/2b mutant zebrafish. (AD) Bright-field images and quantification of jag mutant zebrafish with phenotypes analogous to Alagille syndrome, including (A) reduced body length, (B) craniofacial and eye defects, and (C and D) cardiovascular defects. Magenta arrows point to abnormal eyes; red arrows indicate bleeding, and yellow arrow points to heart edema. mpf, months postfertilization; dpf, days postfertilization. Each point on graphs represents a single fish. Total sample size indicated in individual graph except D (n > 100 for each group). (E) 3D renderings of wild-type (wt) and jag1b/2b mutant zebrafish livers at specified stages. (Left) 72 hpf IHD markers: Prox1a+/tp1GFP+/Hnf4a–; hepatocyte markers: Prox1a+/Hnf4a+/fabp10Red+. Yellow arrows indicate IHD cells. (Middle, Left) 6 dpf with IHD markers: Pan-Cdh/tp1GFP/Alcama with DAPI+ nuclei show partial regeneration. (Middle, Right) 6 dpf with phalloidin+ canaliculi revealing cholestatic rosettes (red arrows) in jag1b/2b mutant livers. tp1H2BdsRed marks IHD cell nuclei. (Right) BODIPY-C5 staining reveals poor bile flow in mutants. White arrows point to bile droplets. n = 10 to 20 for each condition. GB: gallbladder. (Scale bar, 50 μm.) (F) Quantification of IHD cell number per liver from wild type and jag1b/2b mutants at indicated stages. Number of animals analyzed indicated on graph. NR: not reported, ND: not determined. (G and H) Quantification of cholestatic rosette number and relative liver size of wild type and jag1b/2b mutants at 6 dpf. (I) Table summarizing the most common phenotypes in ALGS patients and in mouse and zebrafish Jag mutant models. (Scale bars, (AC) 2 mm and (D and E) 50 μm.) P values, *<0.05, **<0.01, ***<0.001, and ****<0.0001.
Fig. 2.
Fig. 2.
IHD regenerative outcomes stratified by jag1b+/+;2b−/− and jag1b+/−;2b−/− mutants. (A) 3D renderings showing IHD cells (tp1GFP+/Alcama+) in livers of wt and jag1b/2b mutants at 8 and 11 dpf. Dotted white lines outline liver margin. (B) Number of IHD cells within a 200 × 200-μm2 area in the liver of wt and jag1b/2b mutants at 8 and 11 dpf (n = 5 to 11 for each condition). (C) Quantification of IHD branch points in the liver of wt and jag1b/2b mutants at 1 to 12 dpf (n = 5 to 11 for each condition). (D) (Left) Bright-field microscopy showing the liver (dotted yellow lines) is more opaque in jag1b+/−;2b−/− mutants at 12 dpf. (Middle) Confocal images of livers show IHD paucity and cholestasis in jag1b+/−;2b−/− mutants but not in wt at 12 dpf. Yellow circles indicate phalloidin+ cholestatic rosettes; yellow arrow indicates bile droplet; cyan arrows point to cytoplasmic cholestasis. (Right) Senescence-associated beta-galactosidase (SA-β-gal) staining shows liver damage in jag1b+/−;2b−/− mutants at 12 dpf. (E) Percentage of liver area with IHDs in wt and jag1b/2b mutants at 12 dpf (number of livers analyzed indicated in graph). (F) Number of SA-β-gal+ clusters per liver in wt and jag1b+/−;2b−/− mutants at 12 dpf. (G) Quantification of phalloidin+ cholestatic rosettes in livers from wt and jag1b+/−;2b−/− mutants at 12 dpf. (H) Survival curve of wt and jag1b/2b mutants (n = 9 to 27 for each condition in FH). (I) (Top) EdU dosing regimen. (Bottom) 3D renderings of livers from wt and jag1b/2b mutants at 6 dpf with IHD cells labeled (tp1GFP+/Alcama+). Yellow arrows indicate EdU+ IHD cells. (J) Ratio of EdU+ IHD cells to total IHD cells per liver in wt and jag1b/2b mutants at 6 dpf (number of livers analyzed indicated in graph). (Scale bar, 50 μm.) P values, *<0.05, **<0.01, ***<0.001, and ****<0.0001.
Fig. 3.
Fig. 3.
Elevated Notch signaling drives the branching and segregation of leading IHD cells during regeneration. (A) 3D projections of jag1b/2b mutant livers at 6.5 dpf. IHD cells (pan-Cdh+/tp1GFP+/Alcama+), with area in dotted boxes magnified below, showing high tp1GFP expression in leading IHD cells (yellow arrows). Cyan dots indicate the IHD nucleus based on DAPI staining in tp1GFP+/Alcama+ cells. (B) Number of branches per leading IHD cell in jag1b/2b mutants (n = 20 to 30 leading IHD cells in 4 to 6 animals analyzed). (C) A color-coded image of confocal 3D projections showing the tp1GFP intensity in regenerating leading IHD cells (yellow arrows) and trailing IHD cells (magenta arrows) of jag1b/2b mutants. (D) Number of high tp1GFP+ leading IHD cells in jag1b/2b mutants (n = 6 to 9 livers for each genotype analyzed). (E) (Top) GSI (gamma-secretase inhibitor), LY411575 (LY; 10 μM) treatment regimen. (Bottom) 3D projections of the proximal liver in control Jag1b/2b morphants and morphants with LY treatment at 5.5 dpf. Dotted lines outline the extrahepatic duct (EHD). IHD cells (tp1GFP+/Alcama+) with white arrows indicate branching leading IHD cells in control morphant magnified to the right, with the IHD nucleus marked with light blue dots based on DAPI in tp1GFP+ cells. (F) Number of branches per leading IHD cell in Jag1b/2b morphants with and without LY treatment (n = 6 to 9 livers). (G) 3D projections of the liver in (Top) control Jag1b/2b morphants and morphants with LY treated at 4.5 dpf and analyzed at 6.5 dpf and (Bottom) with LY treated at 4.5 dpf and washed out at 6.5 dpf and analyzed at 8.5 dpf, as indicated in (H). White arrows point to leading IHD cells (tp1GFP+/Alcama+). Panels to the right show outline of tp1GFP+ IHD cells with blue dots indicating nuclei positions (DAPI). (I) Number of branching leading IHD cells per liver with and without LY treatment at 6.5 dpf and with continuous LY treatment or drug washout at 8.5 dpf. n = 7 to 12 for each condition. (J) N3ICD (Notch3 intracellular domain) heat shock (HS) induction regimen. (K) 3D projections of the livers in jag1b+/−;2b−/− mutants with and without N3ICD induction at 6.5 dpf and analyzed at 7.5 dpf. Panels to the right show outline of tp1GFP+ IHD cells with blue dots indicating nuclei positions (DAPI). White arrows indicate IHD cells with elevated tp1GFP expression (high Notch activity). (L) Percentage of liver area with IHDs, and (M) number of IHD branch points within 200 × 200 μm2 in the central liver region in jag1b+/−;2b−/− mutants with and without NICD induction at 7.5 dpf. Number of livers analyzed are indicated in graph. (N) Model depicting normal branching and segregation of leading IHD cells with high Notch activity and clustered IHD cells with low Notch activity, which can be rescued with increased Notch activity. (Scale bars, (A, E, G, and K) 50 μm and (C) 20 μm.) P values, *<0.05, **<0.01, ***<0.001, and ****<0.0001.
Fig. 4.
Fig. 4.
Elevated Notch signaling functions through Sox9b to cell autonomously drive branching of IHD cells. (A) 3D projections of the livers in jag1b/2b mutants at 6 dpf with regenerating IHD cells (tp1GFP+Alcama+Sox9b+). White arrows indicate leading IHD cells, and yellow arrows indicate clustered IHD cell nuclei. Leading IHD cells are magnified to the right, with split color channels to reveal cytoplasmic Sox9b expression in regenerating but in nonregenerating mutants. (B) 3D projections of the regenerating IHD cells (Left; tp1GFP+Alcama+ and Right; tp1GFP+/tp1H2BmCherry+) in Jag1b/2b morphants in wt and sox9b−/− background at 6.5 dpf showing poor branching and nuclei segregation without Sox9b. White arrows indicate branched leading IHD cells; yellow arrows indicate clustered IHD cells. (C) Graph showing the number of branched leading IHD cells and the number of IHD cells along a 400 μm length of IHD. Number of livers analyzed are indicated in the graph. (D) 3D projections of the livers in jag1b+/−;2b−/− mutants with and without ectopic wtSox9b expression within regenerating IHD cells (white arrows indicate mCherry+ branching IHD cells) as noted in (E). (F) Number of ductal branches along a 200 μm length of IHD, and average IHD thickness in jag1b+/−;2b−/− mutants with and without ectopic wtSox9b expression. (G) Model depicting the ductal branching and segregation from clustered regenerating IHD cells in jag1b+/−;2b−/− mutants with induced increase in Sox9b expression. (Scale bar, 50 μm.) P values, *<0.05, **<0.01, ***<0.001, and ****<0.0001.
Fig. 5.
Fig. 5.
Small-molecule elevation of Notch/Sox9 signaling can rescue regenerative failure in jag1b/2b mutants. (A) Whole-mount in situ hybridization of sox9b in wild-type zebrafish at 4.5 dpf with and without NoRA1 (100 μM) treatment for 6 h. sox9b expression is increased in livers (L; outlined in red) of NoRA1-treated animals. (B) 3D projections of IHDs in jag1b+/−;2b−/− mutants with and without NoRA1 treatments at 6 dpf, magnified to the right. Yellow arrows indicate sprouting ductal branches. (C) Number of branches along 400 μm length of IHDs (n = 5 to 7 animals analyzed). (D) 3D projections of the livers in jag1b+/−;2b−/− mutants with or without NoRA1 treatments at 12 dpf showing increased IHDs and decreased cholestatic rosettes (yellow arrows). Dotted white line outlines liver margin. (E and F) Number of ductal branch points within 200 × 200-μm2 liver areas, and number of cholestatic rosettes in each liver in jag1b+/−;2b−/− mutant livers at 12 dpf with and without NoRA1 treatment. 3 doses of 8 h with NoRA1 at 100 μM at 4, 6, and 8 dpf were applied for (BF). (G) 3-mo survival rate of wt and jag1b+/–;2b–/– mutants with or without a single 8-h dose of NoRA1 at 100 μM, applied at 4 dpf (n = 20 in each group and tested 3 times). (H and I) Primary IHD cells isolated from patient liver with hepatocellular carcinoma (HCC) and cultured as organoids (Top, bright field; Bottom, IF), showing SOX9 and CK19 expression. qPCR analysis shows increased SOX9 expression with NoRA1 treatment. (JL) IF staining of the Hccc9810 intrahepatic cholangiocarcinoma cells showing higher intensity of SOX9 protein detection with NoRA1 treatment and (L) qPCR showing increased SOX9 expression with NoRA1 treatment. Cells were treated with DMSO (5 μM) or NoRA1 (5 μM) for 3 h. (M) Sox9 expression increased in fibroblasts from three individual ALGS patients (Coriell Institute, also see SI Appendix, Table S1) with a 3-h treatment of NoRA1 (5 μM). (Scale bars, (B and D) 50 μm and (H and J) 20 μm). P values, *<0.05, **<0.01, ***<0.001, and ****<0.0001.

Similar articles

Cited by

References

    1. Li L., et al. , Alagille syndrome is caused by mutations in human Jagged1, which encodes a ligand for Notch1. Nat. Genet. 16, 243–251 (1997). - PubMed
    1. Oda T., et al. , Mutations in the human Jagged1 gene are responsible for Alagille syndrome. Nat. Genet. 16, 235–242 (1997). - PubMed
    1. Gilbert M. A., Loomes K. M., Alagille syndrome and non-syndromic paucity of the intrahepatic bile ducts. Transl. Gastroenterol. Hepatol. 6, 22 (2021). - PMC - PubMed
    1. Emerick K. M., et al. , Features of Alagille syndrome in 92 patients: Frequency and relation to prognosis. Hepatology 29, 822–829 (1999). - PubMed
    1. Kamath B. M., et al. , Outcomes of childhood cholestasis in alagille syndrome: Results of a multicenter observational study. Hepatol. Commun. 4, 387–398 (2020). - PMC - PubMed

Publication types