. 2022 Dec 13;119(50):e2214562119.
doi: 10.1073/pnas.2214562119. Epub 2022 Dec 5.

An abstract categorical decision code in dorsal premotor cortex

Affiliations

An abstract categorical decision code in dorsal premotor cortex

Gabriel Diaz-deLeon et al. Proc Natl Acad Sci U S A. .

Erratum in

Abstract

The dorsal premotor cortex (DPC) has classically been associated with a role in preparing and executing the physical motor variables during cognitive tasks. While recent work has provided nuanced insights into this role, here we propose that DPC also participates more actively in decision-making. We recorded neuronal activity in DPC while two trained monkeys performed a vibrotactile categorization task, utilizing two partially overlapping ranges of stimulus values that varied on two physical attributes: vibrotactile frequency and amplitude. We observed a broad heterogeneity across DPC neurons, the majority of which maintained the same response patterns across attributes and ranges, coding in the same periods, mixing temporal and categorical dynamics. The predominant categorical signal was maintained throughout the delay, movement periods and notably during the intertrial period. Putting the entire population's data through two dimensionality reduction techniques, we found strong temporal and categorical representations without remnants of the stimuli's physical parameters. Furthermore, projecting the activity of one population over the population axes of the other yielded identical categorical and temporal responses. Finally, we sought to identify functional subpopulations based on the combined activity of all stimuli, neurons, and time points; however, we found that single-unit responses mixed temporal and categorical dynamics and couldn't be clustered. All these point to DPC playing a more decision-related role than previously anticipated.

Keywords: categorical decision; continuum responses; dorsal premotor cortex; inter-trial coding; temporal signals.


Conflict of interest statement

The authors declare no competing interest.

Figures
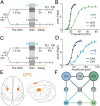
Fig. 1.
Fig. 1.
Task Schematic, Psychophysical Performance, Data Sets, and Recording Sites. (A and C) Task schematic for categorization of frequencies (A) and amplitudes (C). Trials start when the mechanical probe lowers, indenting the glabrous skin of one fingertip of the monkeys’ restrained right hand (probe down event, “PD”). The animals respond by placing their left hand on an immovable key (key down event, “KD”). After KD, a variable period (1.5 to 3 s) is presented, followed by the presentation of a single stimulus lasting 0.5 s. After stimulation, a fixed delay period of 2 s is presented, followed by the probe up event (“PU”). PU serves as the “go” cue for monkeys to remove their hand from the key (key up event, “KU”) and report their decision using one of the two push buttons placed in front of him (push button event, “PB”). Correct answers were rewarded with a few drops of juice. (B and D) Psychometric performance for all categorization sets: (B) Psychometric curves for the two frequency range sets, short (dark green) and long (light green). The short frequency set (SFR) had 12 stimuli that varied between 10 and 30 Hz, in steps of 2 Hz, with the middle stimulus (20 Hz) repeated once for each category (61 sessions). The LFR set had 10 stimuli that varied between 14 and 78 Hz, in steps of 8 Hz, with the middle stimulus (46 Hz) repeated once for each category (16 sessions). (D) Psychometric curves for two amplitude range sets, short (dark blue; SAR) and long (light blue; LAR). The SAR set had 12 stimuli that varied between 20 and 80 µm, in steps of 6 µm, with the middle stimulus (50 µm) repeated once for each category (48 sessions). The LAR set had 10 stimuli that varied between 42 and 138 µm, in steps of 12 µm, with the middle stimulus (90 µm) repeated once for each category (11 sessions). (E) Top (Left) and lateral (Right) views of a monkey brain, with recorded DPC area highlighted (yellow). (F) Diagram of populations of neurons recorded per set. Colors are consistent with those in panels B and D. Corner circles with solid colors represent sets, intersecting circles with two mixed colors represent populations recorded in both sets, and the black circle in the middle is the population of neurons recorded in all the four sets.
Fig. 2.
Fig. 2.
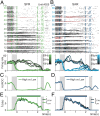
A Single Neuron’s Activity during Frequency and Amplitude Categorization. (A and B) Raster plots of a single neuron recorded in the SFR (A, C, and E) and SAR (B, D, and F) sets. Black and red tick marks represent spikes in trials with correct and incorrect answers, respectively. Green (A) and blue (B) tick marks indicate psychophysical events. Trials are grouped by class (stimulus intensity), with intensity values marked on the left side. From Left to Right, the first green and blue tick marks that occur at −0.5 s indicate stimulus onset, and the second marks at t = 0 s indicate stimulus offset. After a fixed 2 s delay period, the third green and blue tick marks indicate PU, while the fourth represents KU and the fifth represents PB. Figures below raster plots represent firing rate averages for all the hit trials associated with each of the eight visualized classes. Some classes were excluded for clarity in the visualization. Large gray rectangles represent the stimulation period, while thin rectangles mark PU, and the third and last rectangle marks the average movement period, beginning with KU and ending with PB. Firing rate curves range from dark gray for low category stimuli to bright green (A, frequency) or bright blue (B, amplitude) for high category stimuli. (C and D) Time-dependent differential AUROC (high versus low) values were taken between the firing rate distributions of correct trials. AUROC < 0.5 or AUROC > 0.5 indicates an increased firing rate response for classes of category low or high, respectively. Significant windows, based on permutation tests and correcting for multiple comparisons, are marked above the curve (P < 0.01). (E and F) Time-dependent category (ICAT, light green and blue) and stimulus mutual information (ISTIM, dark green and blue) curves (P < 0.05).
Fig. 3.
Fig. 3.
Single Neuron Coding during Frequency and Amplitude Categorization. (A and B) Neuron population coding for the stimulus frequency (A and B) and stimulus amplitude sets (C and D). Population proportions recorded for frequency short range (SFR; A, n = 275) and long range (LFR; B, n = 84) and for amplitude short range (SAR; C, n = 232) and long range (LAR; D, n = 54) with significant category information (ICAT), stimulus information (ISTIM), and both information types at once (ICAT and ISTIM).
Fig. 4.
Fig. 4.
Abstract Information Coding of Stimulus Attributes. (A and B) Information tuning for all neurons recorded in the frequency and amplitude sets. (A) Neurons recorded (n = 158) during the SFR and SAR. (B) Neurons recorded for both long stimulus attribute ranges (LFR and LAR; n = 54). Lines indicate individual neurons with significant information during only one set (blue and green) or both sets (gray). (C and D) Percentage of neurons, recorded during short-range (C) or long-range sets (D), with only frequency (green), amplitude (blue), or dual information coding (dark gray).
Fig. 5.
Fig. 5.
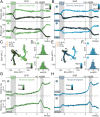
Stimulus and Temporal Population Dynamics. (A and B) Projections of class averages over the first and second decoding stimulus-axes of the short-range population for frequency (A, SFR, n = 275) and amplitude (B, SAR, n = 232). Classes ranging from dark (lowest stimulus) to light (highest stimulus). The ordinal number of each dPC is shown in a circle; explained variances are shown as percentages. (C and E) Phase diagram of the same classes projected across the first two decoding axes for frequency (C) and amplitude (E). The yellow circle marks t = −0.5 s (SO), the yellow square marks the end of the delay (PU, t = 2 s), and the yellow x marks t = 3.2 s (intertrial period). (D and F) Distributions of the neuronal weights for the first two decoding axes of short range for frequency (SFR, D) and amplitude (SAR, F). (G and H) The first two temporal population signals for the short-range population for frequency (SFR, G) and amplitude (SAR, H).
Fig. 6.
Fig. 6.
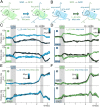
Abstract Temporal and Categorical Coding Population Dynamics. (A and B) Schematic depicting the projection of the SAR activity over the SFR decoding axes (A), and vice versa (B) (n = 158). (C and E) Projection of classes from the SAR population over the first two SFR freq-axes (C), and the first two SFR temporal-axes (E). Axes computed with the SFR dynamic. The numbers in green circles, as well as the color of the y-axis, mark the source of the decoding axes. Explained variance of the SAR dynamic for each SFR freq-dPC is included below. (D and F) Projection of classes from the SFR population over the first two blue circles, as well as the color of the y-axis, mark the source of the decoding axes. Explained variance of the SFR dynamic for each SAR amp-dPC is included below.
Fig. 7.
Fig. 7.
Mixed Dynamics Interlink Categorical and Temporal Neural Responses. (A) UMAP plane with a density contour plot. Each black point represents a single neuron. The colored X marks are the centers of the double-Gaussian (σ = 0.4) weighted averages presented in the panels in (B). (B) Each subpanel presents the weighted average of neuronal activity and is presented in back-transformed arbitrary units that roughly correspond to the firing rate values (Hz).

References

    1. Hernández A., et al. , Decoding a perceptual decision process across cortex. Neuron 66, 300–314 (2010). - PubMed
    1. de Lafuente V., Romo R., Neuronal correlates of subjective sensory experience. Nat. Neurosci. 8, 1698–1703 (2005). - PubMed
    1. Mante V., Sussillo D., Shenoy K. V., Newsome W. T., Context-dependent computation by recurrent dynamics in prefrontal cortex. Nature 503, 78–84 (2013). - PMC - PubMed
    1. Rossi-Pool R., et al. , Emergence of an abstract categorical code enabling the discrimination of temporally structured tactile stimuli. Proc. Natl. Acad. Sci. U.S.A. 113, E7966–E7975 (2016). - PMC - PubMed
    1. Remington E. D., Narain D., Hosseini E. A., Jazayeri M., Flexible sensorimotor computations through rapid reconfiguration of cortical dynamics. Neuron 98, 1005–1019.e5 (2018). - PMC - PubMed

Publication types