. 2023 Feb;614(7946):136-143.
doi: 10.1038/s41586-022-05605-0. Epub 2022 Dec 5.

Dendritic cells direct circadian anti-tumour immune responses

Affiliations

Dendritic cells direct circadian anti-tumour immune responses

Chen Wang et al. Nature. 2023 Feb.

Abstract

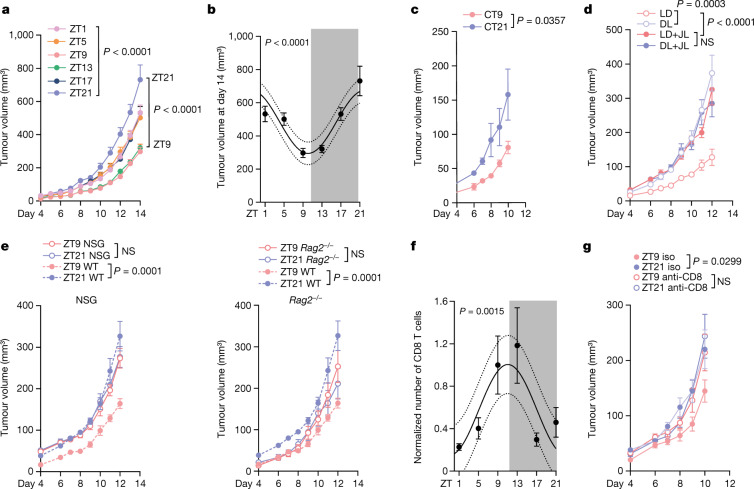
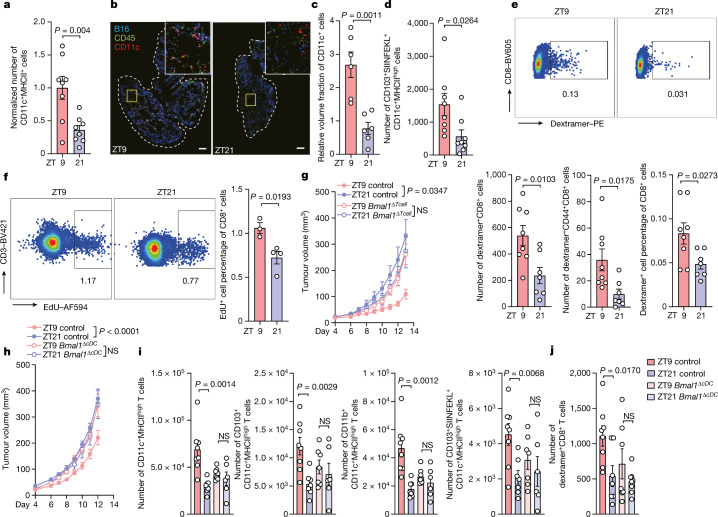
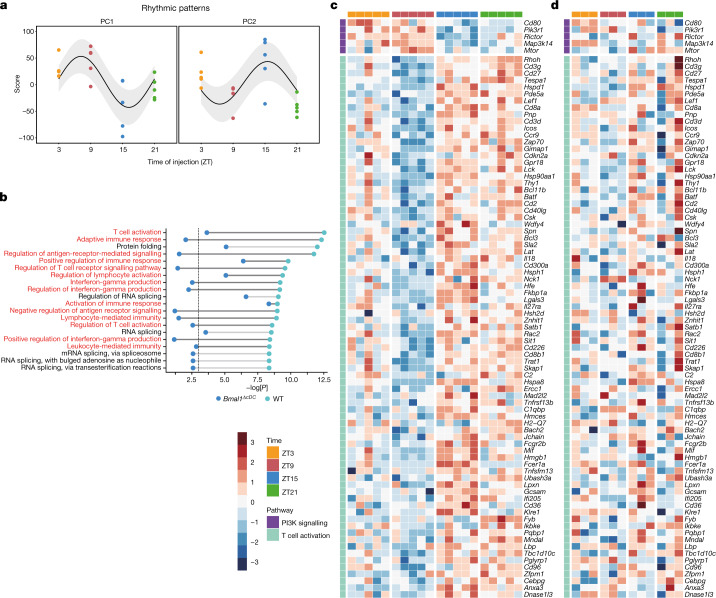
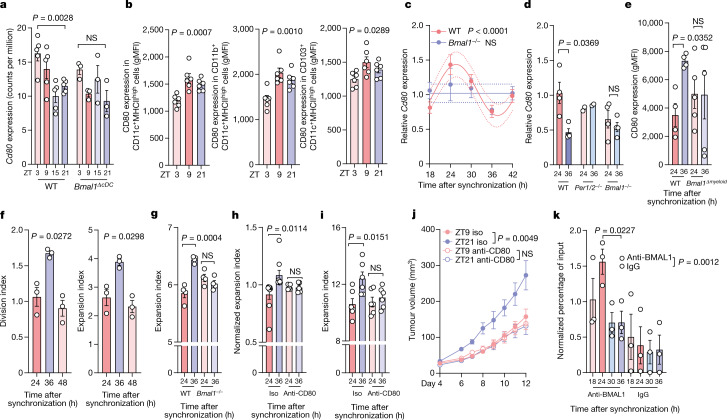
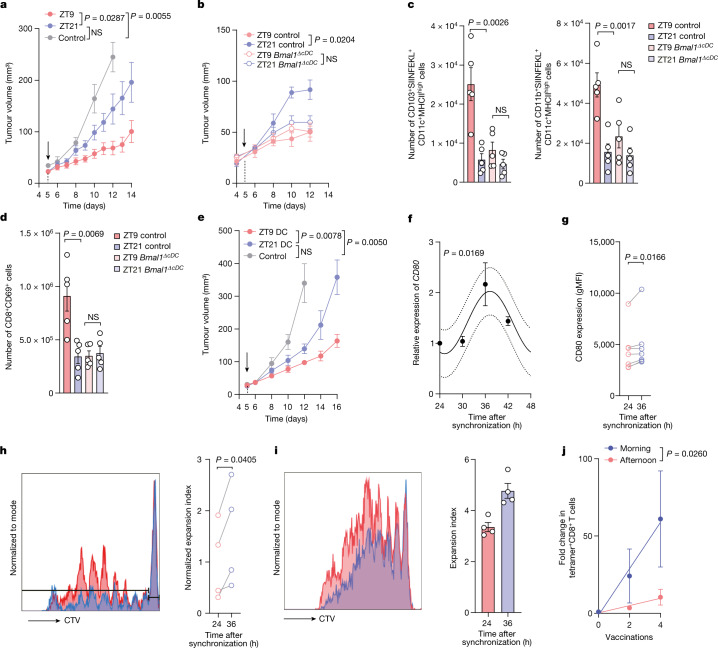
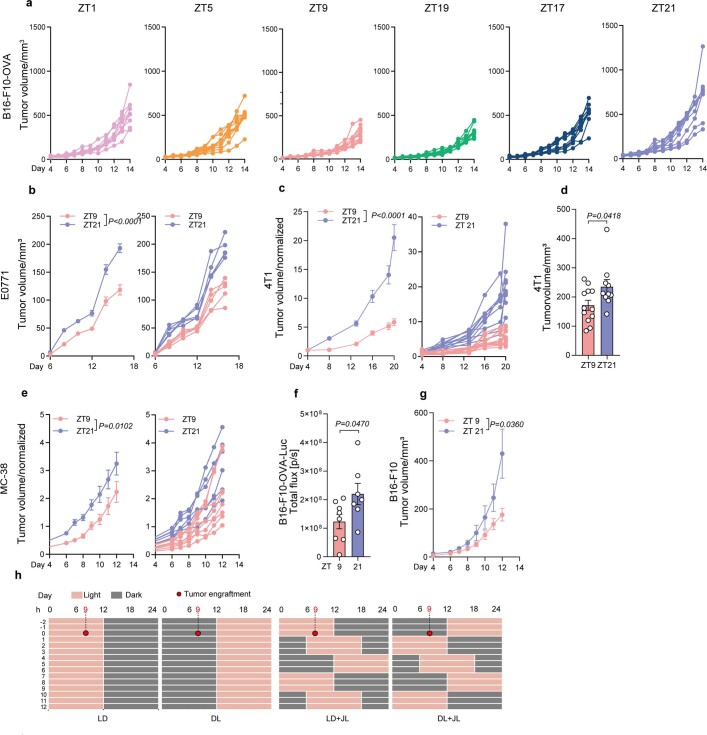
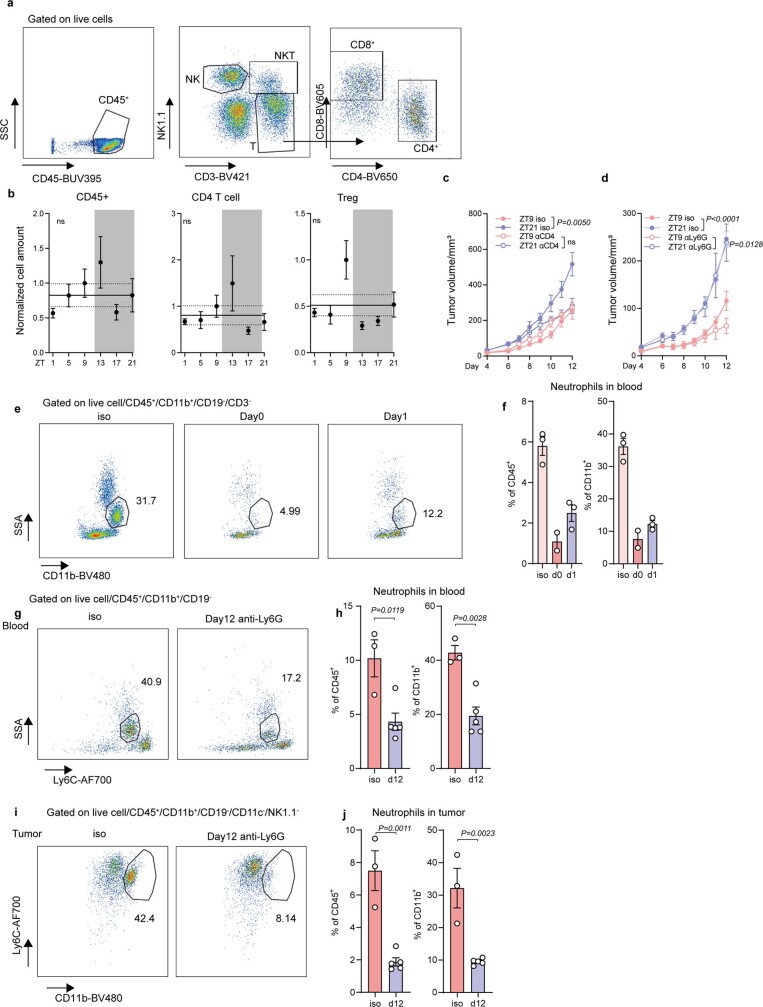
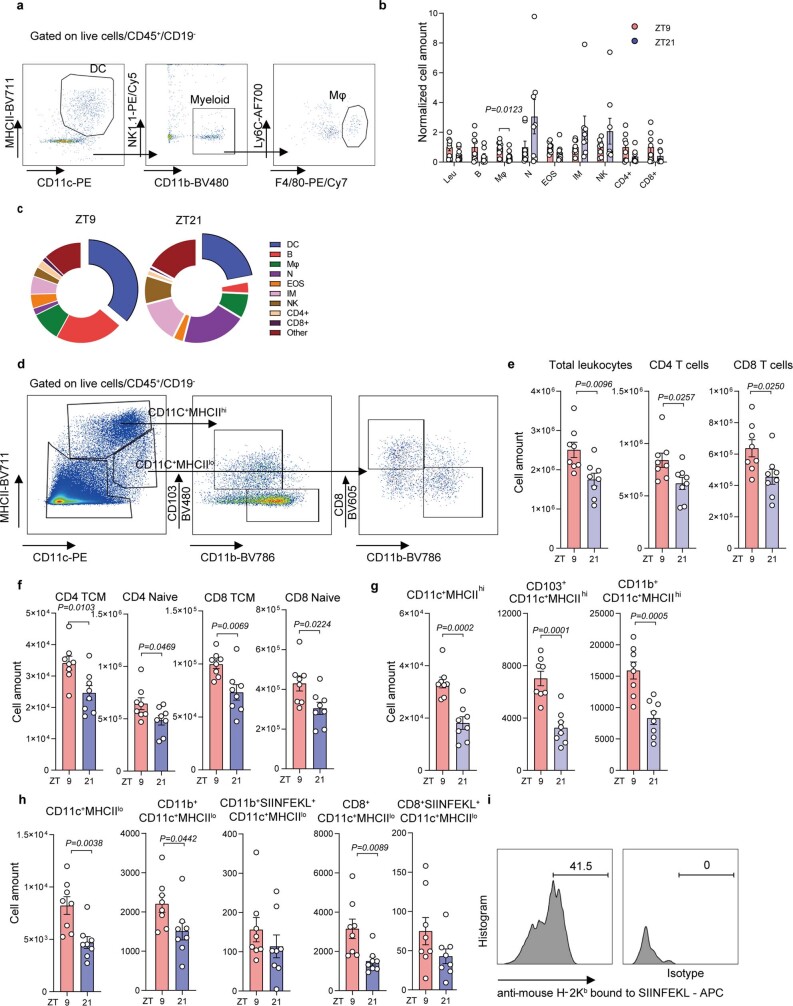
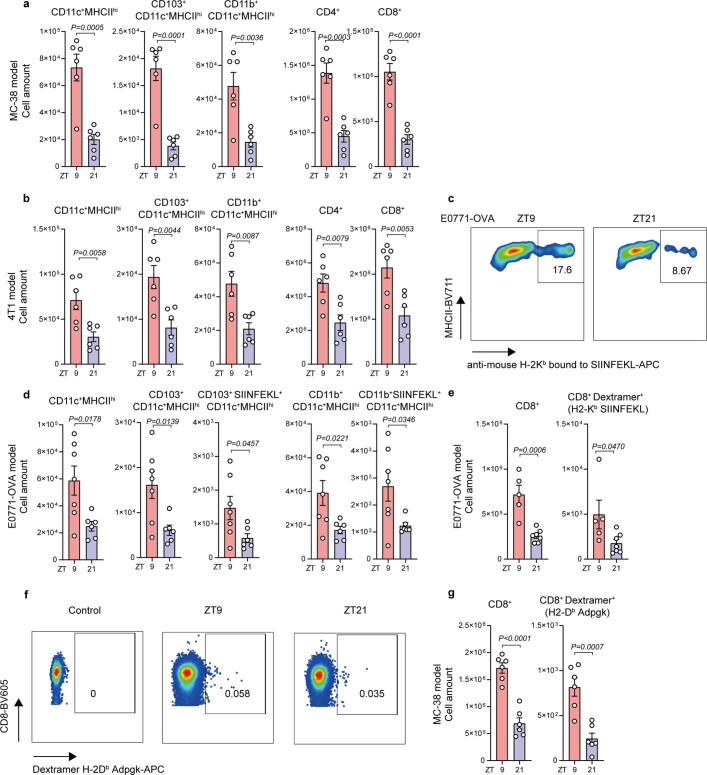
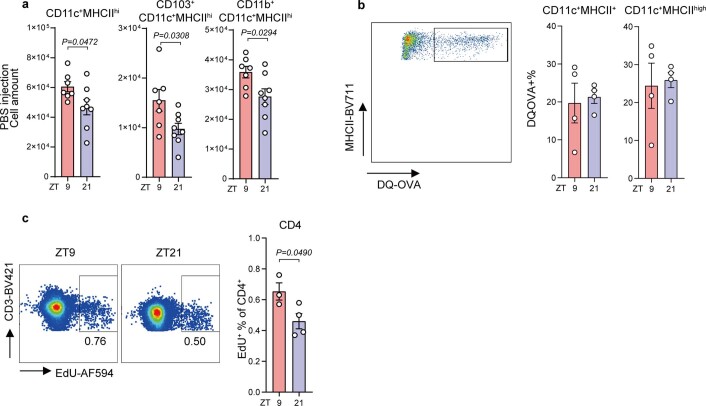
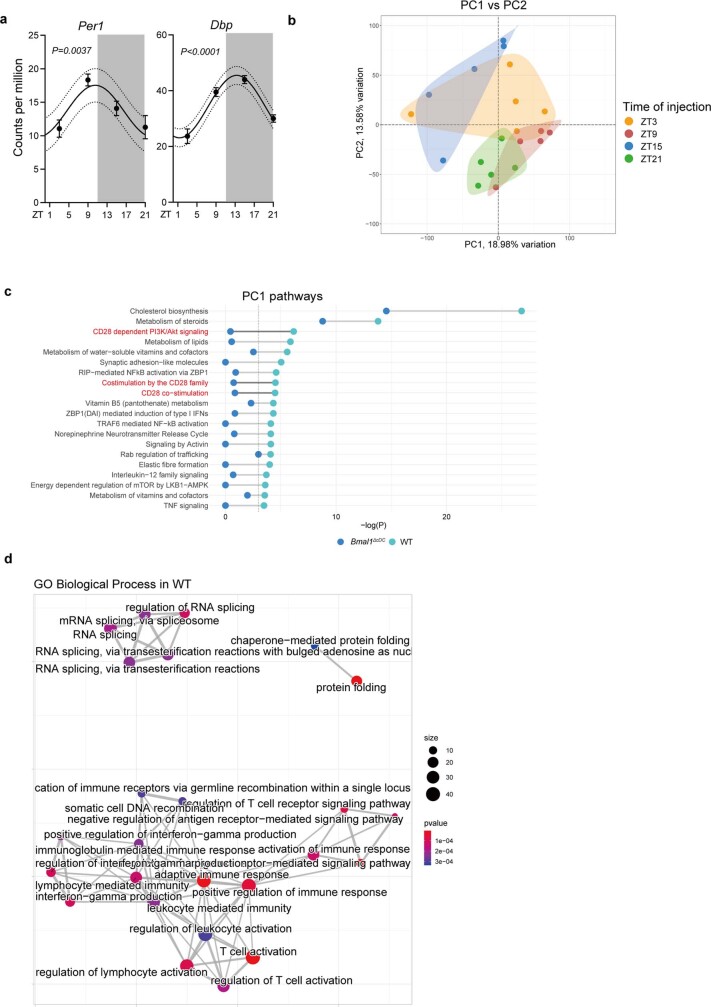
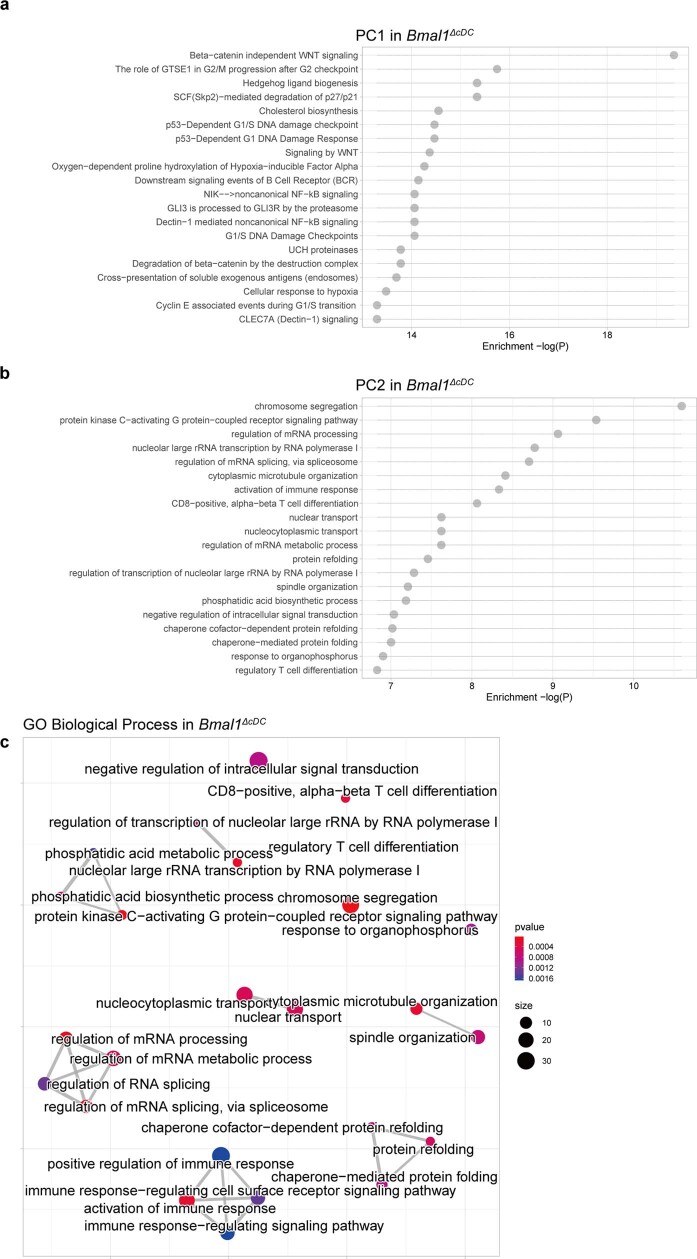
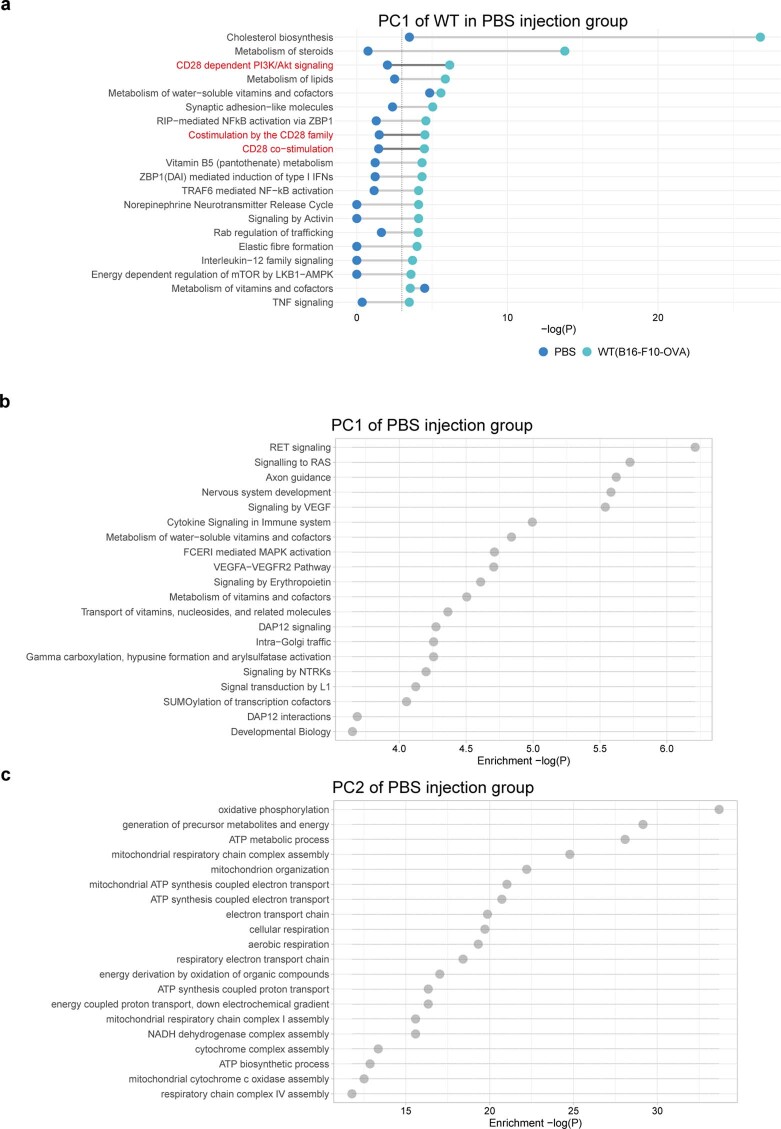
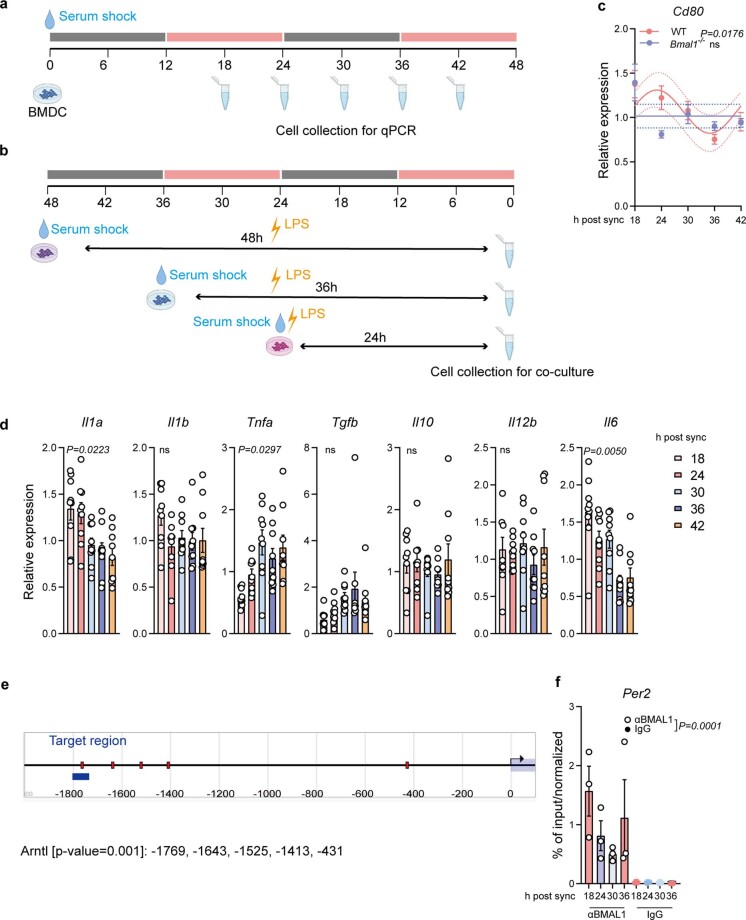
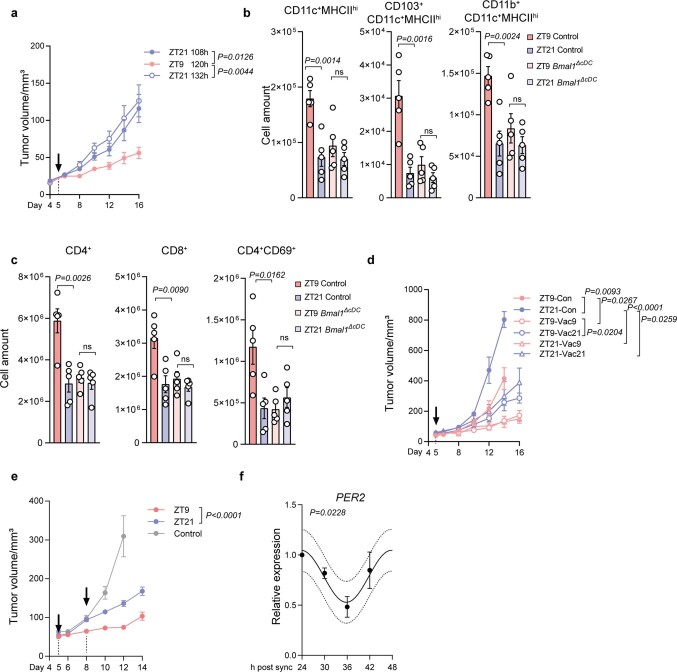
The process of cancer immunosurveillance is a mechanism of tumour suppression that can protect the host from cancer development throughout its lifetime1,2. However, it is unknown whether the effectiveness of cancer immunosurveillance fluctuates over a single day. Here we demonstrate that the initial time of day of tumour engraftment dictates the ensuing tumour size across mouse cancer models. Using immunodeficient mice as well as mice lacking lineage-specific circadian functions, we show that dendritic cells (DCs) and CD8+ T cells exert circadian anti-tumour functions that control melanoma volume. Specifically, we find that rhythmic trafficking of DCs to the tumour draining lymph node governs a circadian response of tumour-antigen-specific CD8+ T cells that is dependent on the circadian expression of the co-stimulatory molecule CD80. As a consequence, cancer immunotherapy is more effective when synchronized with DC functions, shows circadian outcomes in mice and suggests similar effects in humans. These data demonstrate that the circadian rhythms of anti-tumour immune components are not only critical for controlling tumour size but can also be of therapeutic relevance.


Conflict of interest statement

M.J.P. has been a consultant for AstraZeneca, Debiopharm, Elstar Therapeutics, ImmuneOncia, KSQ Therapeutics, MaxiVax, Merck, Molecular Partners, Third Rock Ventures and Tidal; these relationships are unrelated to the current study. The other authors declare no competing interests.

Figures

Fig. 1
Fig. 1. The time of day of engraftment determines tumour size.
a, Tumour volume after engraftment of B16-F10-OVA cells at six different times of day. n = 10 mice from 2 independent experiments. Statistical analysis was performed using two-way analysis of variance (ANOVA). b, The tumour volume on day 14 from the experiments shown in a. Statistical analysis was performed using a cosinor analysis. c, Tumour volume after engraftment of B16-F10-OVA cells at two different times of day under constant darkness (DD) conditions. CT, circadian time. n = 6 mice from 2 independent experiments. Statistical analysis was performed using two-way ANOVA. d, Tumour volume after engraftment of B16-F10-OVA cells at two different times of day under light–dark (LD, n = 6 mice), inverted dark–light (DL, n = 7 mice) or jet lag (JL, n = 7 mice) conditions. For the jet lag condition, mice were placed into a 6 h or 12 h phase-delayed environment every 3 days. n = 2 independent experiments. Statistical analysis was performed using two-way ANOVA. e, Tumour volume after engraftment of B16-F10-OVA cells at two different times of day in NSG mice (left, n = 10 mice) or Rag2−/− mice (right). n = 10 (ZT9) and n = 11 (ZT21) mice. Control WT mice (n = 9) are plotted as a reference. Data are from two independent experiments. Statistical analysis was performed using two-way ANOVA. f, Tumour-infiltrating CD8+ T cells on day 14 from the experiment in a. From ZT1 to ZT21, n = 10, n = 9, n = 10, n = 7, n = 10, n = 8 mice from n = 4 independent experiments. Statistical analysis was performed using a cosinor analysis. g, Tumour volume after engraftment of B16-F10-OVA cells at two different times of day after anti-CD8 antibody depletion. Iso, isotype control. n = 6 mice from 2 independent experiments. Statistical analysis was performed using two-way ANOVA. The shaded areas indicate dark phases. For ag, data are mean ± s.e.m. NS, not significant. Source data
Fig. 2
Fig. 2. DCs respond rhythmically to tumour engraftment.
a, The number of cells at the skin engraftment site 4 h after engraftment of B16-F10-OVA cells at two different times of day. n = 8 mice from 2 independent experiments. Statistical analysis was performed using unpaired Student’s t-tests. b,c, Imaging (b) and quantification (c) of CD11c+ cells at the skin engraftment site 4 h after engraftment of B16-F10-OVA cells. n = 6 mice from 2 independent experiments. Statistical analysis was performed using unpaired Student’s t-tests. For b, scale bars, 500 µm. d, The numbers of cells in the dLN 24 h after engraftment of B16-F10-OVA cells. n = 8 mice from 2 independent experiments. Statistical analysis was performed using unpaired Student’s t-tests. e, H-2Kb–SIINFEKL dextramer staining of CD8+ T cells in the dLN 72 h after engraftment of B16-F10-OVA cells. n = 8 (ZT9) and n = 7 (ZT21) mice from 2 independent experiments. Statistical analysis was performed using unpaired Student’s t-tests. f, EdU staining gated on CD3+CD8+ T cells in the dLN 48 h after engraftment of B16-F10-OVA cells. n = 3 (ZT9) and n = 4 (ZT21) mice, representative of 2 independent experiments. Statistical analysis was performed using unpaired Student’s t-tests. g,h, Tumour volume after engraftment of B16-F10-OVA cells in Cd4-cre:Bmal1flox mice (n = 8 (ZT9 control), n = 16 (ZT9 cre), n = 16 (ZT21 control) and n = 7 (ZT21 cre)) (g) and Clec9a-cre:Bmal1flox mice (n = 17 (ZT9 control), n = 9 (ZT9 cre), n = 16 (ZT21 control) and n = 10 (ZT21 cre)) (h). n = 3 independent experiments. Statistical analysis was performed using two-way ANOVA. i, The cell numbers for the CD11c+MHCIIhigh subsets in the dLN 24 h after engraftment of B16-F10-OVA cells in Clec9a-cre:Bmal1flox mice. n = 8 (ZT9 control), n = 7 (ZT9 cre), n = 7 (ZT21 control) and n = 6 (ZT21 cre) from 2 independent experiments. Statistical analysis was performed using unpaired Student’s t-tests. j, H-2Kb–SIINFEKL dextramer staining of CD8+ T cells in the dLN 72 h after engraftment of B16-F10-OVA cells in Clec9a-cre:Bmal1flox mice. n = 8 (ZT9 control), n = 7 (ZT9 cre), n = 7 (ZT21 control) and n = 8 (ZT21 cre) mice from 2 independent experiments. Statistical analysis was performed using unpaired Student’s t-tests. For a, c, d and fj, data are mean ± s.e.m. All t-tests were two-tailed. Source data
Fig. 3
Fig. 3. DCs exhibit circadian gene expression patterns.
ad, RNA-seq analysis of CD11c+MHCIIhigh cells in the dLN 24 h after engraftment of B16-F10-OVA cells at ZT3, ZT9, ZT15 or ZT21 in control mice (n = 5 mice) or Clec9a-cre:Bmal1flox mice (n = 3 mice). n = 2 independent experiments. a, Principal component (PC) analyses of the two main peaks in gene expression oscillation in control mice. n = 5 mice. Statistical analysis was performed using a cosinor analysis. b, Significantly enriched Gene Ontology pathways from PC2 in the control cells shown in a, with T cell activation pathways highlighted in red, shown for control and Clec9a-cre:Bmal1flox CD11c+MHCIIhigh cells. The vertical dashed line represents the significant P values, which were calculated using hypergeometric tests. c,d, Significantly expressed genes in the CD28-dependent PI3K–AKT signalling pathway (top) or T cell activation pathways (bottom) in control mice (c) and the lack of significance in Clec9a-cre:Bmal1flox mice (d).
Fig. 4
Fig. 4. Rhythmic expression of CD80 in DCs governs T cell responses.
a, Expression (counts per million (CPM)) of Cd80 in CD11c+MHCIIhigh cells from control (n = 5) or Clec9a-cre:Bmal1flox (n = 3) mice. Statistical analysis was performed using one-way ANOVA. b, CD80 expression in DCs subsets was determined using flow cytometry in the dLN 24 h after engraftment of B16-F10-OVA cells. n = 6 mice from 2 independent experiments. Statistical analysis was performed using one-way ANOVA. gMFI, geometric mean fluorescence intensity. c, Cd80 mRNA expression after synchronization of LPS-matured BMDCs from WT (n = 10) and Bmal1−/− (n = 4) mice from 2 independent experiments. Statistical analysis was performed using a cosinor analysis. d, Cd80 mRNA expression after synchronization of BMDCs generated from WT (n = 4) Per1−/−Per2−/− (n = 2) or Bmal1−/− (n = 4) mice. n = 2 independent experiments. Statistical analysis was performed using unpaired Student’s t-tests. e, Floy cytometry analysis of CD80 protein expression in synchronized Lyz2-cre:Bmal1flox BMDCs. n = 4 (control) and n = 5 (cre) mice from 2 independent experiments. Statistical analysis was performed using paired Student’s t-tests. fh, In vitro co-culture proliferation experiments with OT-I CD8+ T cells and SIINFEKL-loaded BMDCs generated from WT mice (n = 3 mice from 2 independent experiments) (f) or Bmal1−/− mice (n = 4, from 2 independent experiments) (g) or after anti-CD80 antibody treatment (n = 9 (control) and n = 5 (anti-CD80) mice from 9 independent experiments) (h). Statistical analysis was performed using one-way ANOVA (f), an unpaired Student’s t-test (g) and a paired Student’s t-test (h). i, In vitro co-culture proliferation experiments with naive CD8+ T cells treated with an anti-CD3 antibody and WT BMDCs in the presence of absence of an anti-CD80 antibody. n = 3 mice, 2 replicates each, from 2 independent experiments. Statistical analysis was performed using unpaired Student’s t-tests. j, The tumour volume after engraftment of B16-F10-OVA cells at two different times of day, and after treatment with an anti-CD80 antibody or isotype control. n = 10 mice from 2 independent experiments. Statistical analysis was performed using two-way ANOVA. k, ChIP analysis of BMAL1 binding to the promoter region of Cd80 in synchronized BMDCs. n = 3 mice from 2 independent experiments. Statistical analysis was performed using unpaired Student’s t-tests. For ak, all data are mean ± s.e.m. All t-tests were two-tailed. Source data
Fig. 5
Fig. 5. Chronotherapeutic vaccination as tumour immunotherapy.
a, Tumour volume after engraftment of B16-F10-OVA cells at ZT9 and OVA vaccination on day 5 (arrow) at ZT9 or ZT21. n = 12 (vaccinated) and n = 3 (unvaccinated control) mice from 2 independent experiments. Statistical analysis was performed using two-way ANOVA. b, Tumour volume after engraftment of B16-F10-OVA cells with OVA vaccination on day 5 (arrow) at ZT9 or ZT21 in control or Clec9a-cre:Bmal1flox mice. n = 5 mice from 2 independent experiments. Statistical analysis was performed using two-way ANOVA. c,d, The cell numbers for DC subsets (c) and T cells (d) in the dLN 24 h after OVA vaccination (on day 5 after B16-F10-OVA cell engraftment) in control or Clec9a-cre:Bmal1flox mice. n = 5 mice from 2 independent experiments. Statistical analysis was performed using unpaired Student’s t-tests. e, The tumour volume after engraftment of B16-F10-OVA cells with SIINFEKL-loaded BMDC vaccination on day 5 (arrow) at ZT9 or ZT21. n = 6 mice from 2 independent experiments. Statistical analysis was performed using two-way ANOVA. f, mRNA expression of CD80 in hMoDCs after synchronization. n = 3 patients. Statistical analysis was performed using a cosinor analysis. g, Human CD80 protein expression was analysed using flow cytometry in hMoDCs after synchronization. n = 7 patients. Statistical analysis was performed using paired Student’s t-tests. h, In vitro co-culture proliferation experiments with human naive CD8+ T cells and synchronized hMoDCs. n = 4 patients. Statistical analysis was performed using paired Student’s t-tests. i, In vitro co-culture proliferation experiments with antigen-specific CD8+ T cells from patients with melanoma and synchronized HLA-A2+ hMoDCs. Data are technical replicates, representative of two donors from two independent experiments. Statistical analysis was performed using unpaired Student’s t-tests. j, Fold change in Melan-A-specific T cells after 2 and 4 vaccinations (with Melan-A peptide, CpG 7909 and incomplete Freund’s adjuvant) in the morning (n = 6 patients) or afternoon (n = 4 patients). Statistical analysis was performed using a linear regression analysis. For ag, i and j, data are mean ± s.e.m. All t-tests were two-tailed. Source data
Extended Data Fig. 1
Extended Data Fig. 1. Time of day of engraftment dictates tumour size.
(a) Tumour volume of each mouse after engraftment of B16-F10-OVA cells at 6 different times of the day (Zeitgeber time (ZT)); n = 10 mice per timepoint from 2 independent experiments. (b) Tumour volume after engraftment of E0771 cells at 2 different times of the day, plotted per group (left) and mouse (right); n = 5 mice from 2 independent experiments, two-way ANOVA. (c-d) Normalized tumour volume, plotted per group (left) and mouse (right) (c) and tumour volume on day 20 (d), after engraftment of 4T1 cells at 2 different times of the day; n = 12 (ZT9), n = 10 (ZT21) mice from 2 independent experiments, two-way ANOVA (c) and unpaired Student’s t-test (d). (e) Normalized tumour volume after engraftment of MC-38 cells at 2 different times of the day, plotted per group (left) and mouse (right); n = 8 (ZT9), n = 6 (ZT21) mice from 2 independent experiments, two-way ANOVA. (f) Fluorescence flux in photons/seconds of B16-F10-OVA-Luc (5 × 10⁵ cells) tumours on day 5 after engraftment; n = 8 (ZT9), n = 7 (ZT21) mice from 2 independent experiments, unpaired Student’s t-test. (g) Tumour volume in phase-shifted mice injected using the same batch of B16-F10 cells (without OVA expression); n = 9 (ZT9), n = 6 (ZT21) mice from 2 independent experiments, two-way ANOVA. (h) Scheme of the normal (light:dark), inverted lighting (dark:light) and jet lag protocols. For the jet lag, every three days mice were placed into a 6 h- or 12 h-phase delayed environment. The red dots represent the time when tumours were engrafted (9 h after the start of the cycle). All data are represented as mean ± SEM, all t-tests are two-tailed. Source data
Extended Data Fig. 2
Extended Data Fig. 2. Depletion of CD4 T cells and neutrophils.
(a) Flow cytometry gating strategy of tumour infiltrating leukocytes. (b) Normalized cell numbers of tumour infiltrating leukocytes after 14 days of tumour engraftment; from ZT1 to 21, n = 10, 9, 10, 7, 10, 8 mice from 4 independent experiments, Cosinor analysis. Treg, regulatory T cells. (c-d) Tumour volume upon anti-CD4 antibody depletion, n = 4 (ZT9 anti-CD4), n = 5 (ZT21 anti-CD4), n = 6 (control) mice (c), or anti Ly6G antibody depletion, n = 5 (control), n = 6 (anti-Ly6G) mice (d), from 2 independent experiments, two-way ANOVA. (e-j) Flow cytometry gating strategies and quantification of neutrophils in blood (e-h) or tumour (i-j) after anti-Ly6G treatment. Anti-mouse Ly6G antibody was given every 3 days, starting 1 day before the tumour inoculation (d-1). Neutrophil frequency after treatment at days 0 and 1 (e-f), from left to right, n = 3, 2, 3 mice, or day 12 (g-j), n = 3 (iso), n = 5 (anti-Ly6G) mice from 2 independent experiments, unpaired Student’s t-test. All data are represented as mean ± SEM, ns, not significant, all t-tests are two-tailed. Source data
Extended Data Fig. 3
Extended Data Fig. 3. Leukocyte populations in skin and dLN.
(a) Flow cytometry gating strategy of skin myeloid populations. (b-c) Number (b) and proportion (c) of leukocytes at the tumour engraftment site 4 h after B16-F10-OVA engraftment; n = 8 mice from 2 independent experiments, unpaired Student’s t-test. Leu, leukocyte; N, neutrophils; EOS, eosinophil; IM, inflammatory monocytes; NK, natural killer cells. (d) Flow cytometry gating strategy of DC subsets in draining lymph nodes (dLN). (e-i) Leukocytes, T cell (e-f) and DCs (g-h) in the dLN, 24 h after tumour engraftment (5×10⁵ B16-F10-OVA); n = 8 mice, from 2 independent experiments, unpaired Student’s t-test. (i) Gating of anti-mouse H-2Kb bound to SIINFEKL+ DCs in the B16-F10-OVA model. All data are represented as mean ± SEM, all t-tests are two-tailed. Source data
Extended Data Fig. 4
Extended Data Fig. 4. Time-of-day differences exist in other tumour models.
(a-d) DCs and T cell numbers in the dLN, 24h after tumour engraftment of MC-38 cells (n = 6 mice) (a), 4T1 cells (n = 6 mice) (b), or E0771-OVA cells, n = 7 (ZT9), n = 6 (ZT21) mice, (c-d), from 2 independent experiments, unpaired Student’s t-test. (c) Gating of anti-mouse H-2Kb bound to SIINFEKL+ DCs in the E0771-OVA model. (e-g) T cell numbers in the dLN 72h after tumour engraftment of E0771-OVA cells, n = 5 (ZT9), n = 7 (ZT21) (e), or MC-38 cells, n = 6 mice (f-g), from 2 independent experiments, unpaired Student’s t-test. (f) Gating of Dextramer H-2Db/ ASMTNMELM bound to CD8 T cells in the MC-38 model and, (g) quantification. All data are represented as mean ± SEM, all t-tests are two-tailed. Source data
Extended Data Fig. 5
Extended Data Fig. 5. Differences in DCs and CD4 T cells in the dLN.
(a) DCs numbers in the dLN 24h after sham PBS injection without tumour inoculation, n = 7 (ZT9), n = 8 (ZT21) mice, from 2 independent experiments, unpaired Student’s t-test. (b) DQ-OVA+ DCs in dLN 24h after inoculation; n = 4 mice from 2 independent experiments, unpaired Student’s t-test. (c) EdU staining in CD3+CD4+ T cells in the dLN 48 h after B16-F10-OVA cell engraftment; n = 3 (ZT9), n = 4 (ZT21) mice, representative from 2 independent experiments, unpaired Student’s t-test. All data are represented as mean ± SEM, all t-tests are two-tailed. Source data
Extended Data Fig. 6
Extended Data Fig. 6. RNA-seq analyses of CD11+ MHCIIhi cells in the dLN.
(a-d) RNA-seq analyses of CD11c+ MHCIIhi cells in the dLN 24h after B16-F10-OVA cell engraftment in control mice (n = 5 mice) or Clec9acre:Bmal1flox mice (n = 3 mice), from 2 independent experiments. (a) Expression (Counts per million (CPM)) of Per1 and Dbp in CD11c+ MHCIIhi cells from control mice, Cosinor analysis. (b) Principal Component (PC) analyses of each sample from sequencing of CD11c+ MHCIIhi DCs in control mice. (c) Significantly enriched pathways from PC1 in control cells with CD28 signalling pathways highlighted in red, shown for control and Clec9acre:Bmal1flox CD11c+ MHCIIhi cells. The vertical dashed line represents the significant p values, hypergeometric test. (d) GO Biological Process interactions in the PC2 gene cluster for control cells. All data are represented as mean ± SEM. Source data
Extended Data Fig. 7
Extended Data Fig. 7. RNA-seq analyses in Clec9acre:Bmal1flox mice.
(a-c) RNA-seq analyses of CD11c+ MHCIIhi cells in the dLN 24h after B16-F10-OVA cell engraftment at ZT3, 9, 15 and ZT21 in Clec9acre:Bmal1flox mice (n = 3 mice). (a-b) Significantly enriched pathways from PC1 (a) and PC2 (b) in Clec9acre:Bmal1flox cells, hypergeometric test. (c) GO Biological Process interactions in PC2 gene cluster for Clec9acre:Bmal1flox cells.
Extended Data Fig. 8
Extended Data Fig. 8. RNA-seq analyses in sham conditions.
(a-c) RNA-seq analyses of CD11c+ MHCIIhi cells in the dLN 24h after PBS injection (n = 3 mice) or after B16-F10-OVA cell (n = 5 mice) at ZT3, 9, 15 and ZT21 in WT mice, from 2 independent experiments. (a) Pathways found significantly enriched by over-representation analysis in the lists of significantly oscillating genes in PC1 (Reactome database) in WT mice. The same pathways from RNA-seq analyses in PBS injection mice were also plotted; n = 3 mice per timepoint. The vertical dashed line represents the significant P values, hypergeometric test. (b-c) Pathways found significantly enriched by over-representation analysis in the lists of significantly oscillating genes in PC1 and PC2 in PBS injection mice, hypergeometric test.
Extended Data Fig. 9
Extended Data Fig. 9. Synchronization experiments of BMDCs.
(a-b) Synchronization scheme of BMDCs for qPCR analyses (a) and co-culture experiments (b). The schematics in a and b were created using BioRender. (c) Cd80 mRNA expression after synchronization of immature BMDCs from WT (n = 15 mice) and Bmal1−/− (n = 4 mice) mice without LPS maturation, Cosinor analysis. (d) qPCR of LPS-matured BMDCs at different times after synchronization; n = 9 mice from 2 independent experiments, one-way ANOVA. (e) Predicted binding regions of BMAL1 to the Cd80 gene using Eukaryotic Promoter Database with a cutoff P-value of 0.001. (f) Chromatin immunoprecipitation (ChIP) of BMAL1 binding the promoter of Per2 of BMDCs after synchronization; n = 3 mice, from 2 independent experiments, two-way ANOVA. All data are represented as mean ± SEM, ns, not significant. Source data
Extended Data Fig. 10
Extended Data Fig. 10. Time-of-day differences in vaccination efficacy.
(a) Tumour volume after B16-F10-OVA cell engraftment at ZT9 and OVA vaccination at ZT9 (120 h after tumour engraftment, n = 11) or ZT21 (108 h, n = 12, or 132 h, n = 11 mice, after tumour engraftment); from 2 independent experiments, two-way ANOVA. (b-c) Numbers of DC subsets (b) and T cells (c) in the draining LN 24h after OVA vaccination (on day 5 after B16-F10-OVA cell engraftment) in control or Clec9acre:Bmal1flox mice, n = 5 mice from 2 independent experiments, unpaired Student’s t-test. (d) Tumour volume in WT mice after tumour engraftment (5×10⁵ B16-F10-OVA cells) at ZT9 or ZT21, with or without OVA vaccination on day 5 (arrow) at ZT9 or ZT21, n = 4 mice, two-way ANOVA. (e) Tumour volume after B16-F10-OVA cell engraftment at ZT9 and OVA vaccination on day 5 and 8 (arrows), both at ZT9 or ZT21 (n = 6 mice) or unvaccinated controls (n = 9 mice), from 2 independent experiments, two-way ANOVA. (f) qPCR of human PER2 expression in human monocyte derived DCs (hMoDC) after synchronization, n = 3 patients, Cosinor analysis. All data are represented as mean ± SEM, ns, not significant, all t-tests are two-tailed. Source data

Comment in

References

    1. Gajewski TF, Schreiber H, Fu YX. Innate and adaptive immune cells in the tumor microenvironment. Nat. Immunol. 2013;14:1014–1022. doi: 10.1038/ni.2703. - DOI - PMC - PubMed
    1. Chen DS, Mellman I. Elements of cancer immunity and the cancer-immune set point. Nature. 2017;541:321–330. doi: 10.1038/nature21349. - DOI - PubMed
    1. Arjona A, Silver AC, Walker WE, Fikrig E. Immunity’s fourth dimension: approaching the circadian-immune connection. Trends Immunol. 2012;33:607–612. doi: 10.1016/j.it.2012.08.007. - DOI - PMC - PubMed
    1. Curtis AM, Bellet MM, Sassone-Corsi P, O’Neill LA. Circadian clock proteins and immunity. Immunity. 2014;40:178–186. doi: 10.1016/j.immuni.2014.02.002. - DOI - PubMed
    1. Labrecque N, Cermakian N. Circadian Clocks in the Immune System. J. Biol. Rhythms. 2015;30:277–290. doi: 10.1177/0748730415577723. - DOI - PubMed

Publication types