. 2023 Jan;299(1):102768.
doi: 10.1016/j.jbc.2022.102768. Epub 2022 Dec 5.

Mapping the KRAS proteoform landscape in colorectal cancer identifies truncated KRAS4B that decreases MAPK signaling

Affiliations

Mapping the KRAS proteoform landscape in colorectal cancer identifies truncated KRAS4B that decreases MAPK signaling

Lauren M Adams et al. J Biol Chem. 2023 Jan.

Abstract

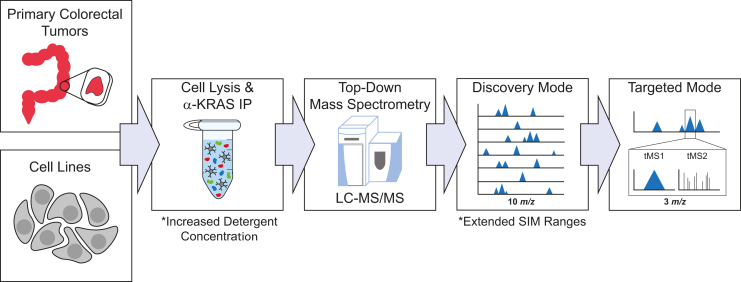
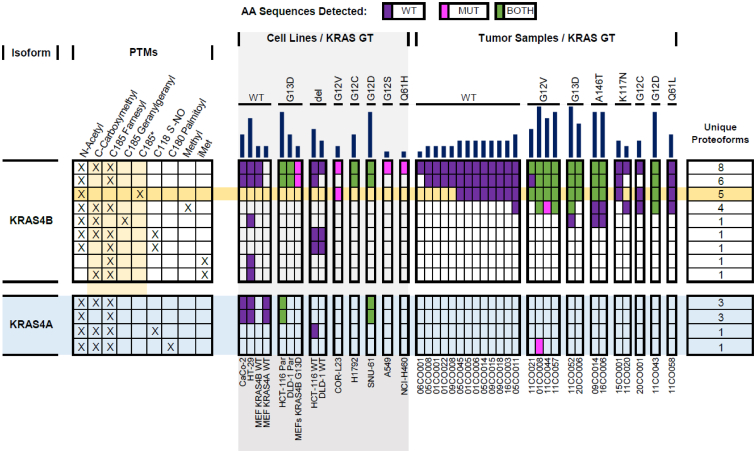
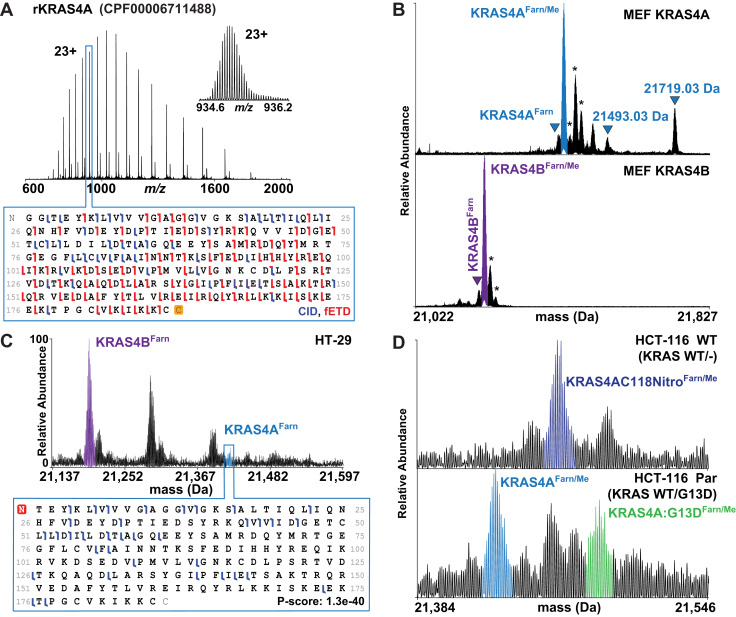
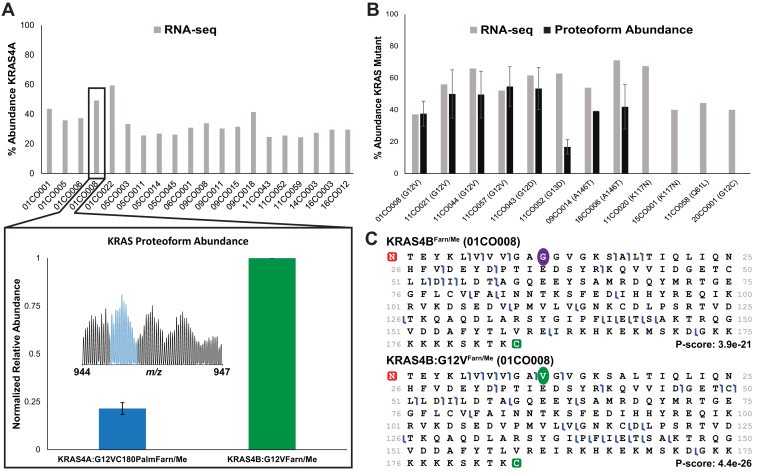
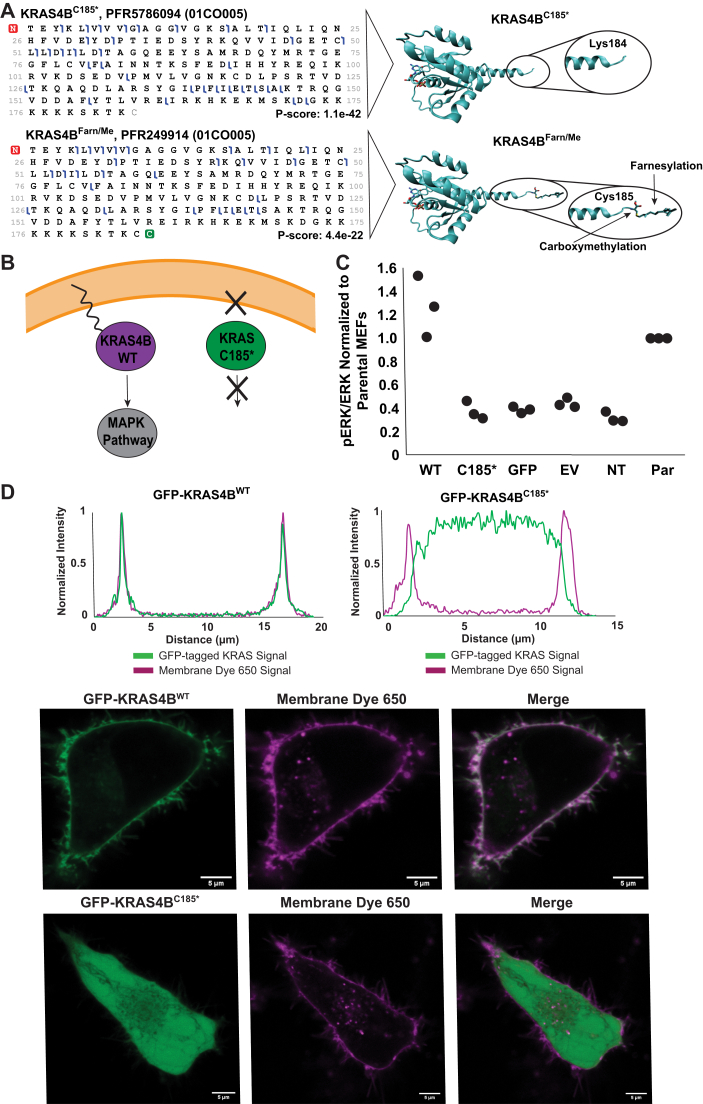
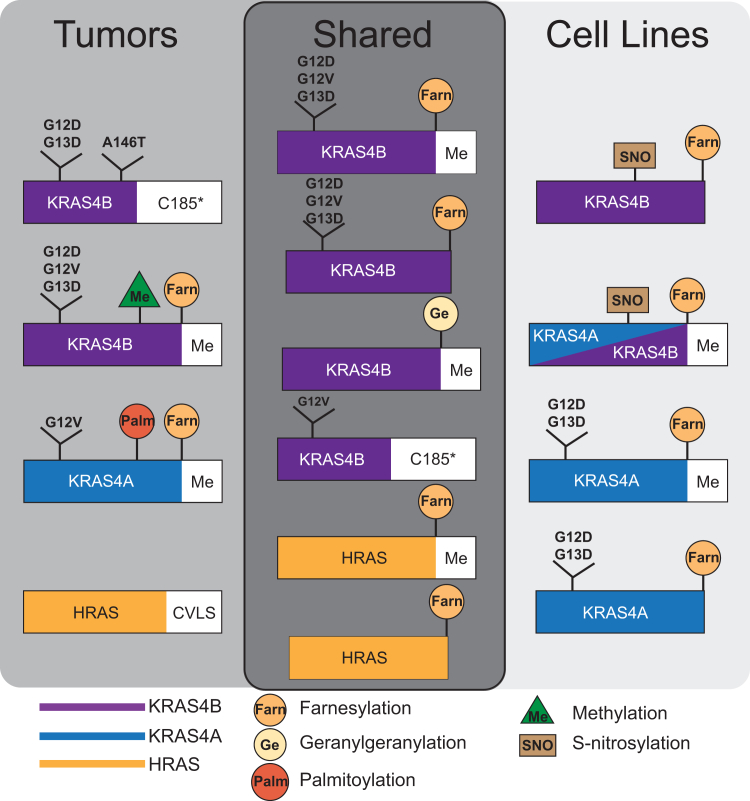
The KRAS gene is one of the most frequently mutated oncogenes in human cancer and gives rise to two isoforms, KRAS4A and KRAS4B. KRAS post-translational modifications (PTMs) have the potential to influence downstream signaling. However, the relationship between KRAS PTMs and oncogenic mutations remains unclear, and the extent of isoform-specific modification is unknown. Here, we present the first top-down proteomics study evaluating both KRAS4A and KRAS4B, resulting in 39 completely characterized proteoforms across colorectal cancer cell lines and primary tumor samples. We determined which KRAS PTMs are present, along with their relative abundance, and that proteoforms of KRAS4A versus KRAS4B are differentially modified. Moreover, we identified a subset of KRAS4B proteoforms lacking the C185 residue and associated C-terminal PTMs. By confocal microscopy, we confirmed that this truncated GFP-KRAS4BC185∗ proteoform is unable to associate with the plasma membrane, resulting in a decrease in mitogen-activated protein kinase signaling pathway activation. Collectively, our study provides a reference set of functionally distinct KRAS proteoforms and the colorectal cancer contexts in which they are present.

Keywords: KRAS; MAPK pathway; RAS protein; colorectal cancer; immunoprecipitation; post-translational modification; proteoform; top–down proteomics.


Conflict of interest statement

Conflict of interest N. L. K. is involved in commercialization of proteomics software. All other authors declare that they have no conflicts of interest with the contents of this article.

Figures

Figure 1
Figure 1
Diagram of the IP–TDMS workflow, which couples immunoprecipitation of KRAS with downstream top–down mass spectrometry. Proteoforms are first detected in discovery mode (intact MS1) and then further characterized in targeted mode using tandem mass spectrometry (tMS1/tMS2). Key differences in the protocol compared with those previously published (41, 42) are denoted by asterisks. IP, immunoprecipitation; TDMS, top–down mass spectrometry.
Figure 2
Figure 2
Oncoproteoform plot describing the manually validated KRAS4A (light blue) and KRAS4B proteoforms and the contexts in which they were identified. Each row represents all validated proteoforms that share the combinations of PTMs indicated with “X”s on the left. The number of unique proteoforms in each row is shown on the right. In the middle section, the presence or the absence of the proteoforms in the biological contexts (cell lines [light gray] and colorectal tumors) is displayed. The color of the box indicates the expressing allele of validated proteoforms: purple denotes WT form only, magenta is mutant form only, and green represents both WT and mutant forms. No fill indicates no proteoform was detected. The dark yellow row shows proteoforms bearing a C185∗ truncation, whereas light yellow columns in the left section highlight modifications, which involve the C-terminal residue C185. Dark blue bars on top indicate the total number of validated KRAS proteoforms in each context. PTM, post-translational modification.
Figure 3
Figure 3
KRAS4AProteoforms.A, recombinant KRAS4A charge state distribution and graphical fragment map from a 21 T FT–ICR mass spectrometer. B, proteoform landscapes in MEF KRAS4A WT and MEF KRAS4B WT cell lines from a 21 T FT–ICR mass spectrometer. Peaks in the KRAS4A landscape match the masses for KRAS4A with phosphorylation (21,493.03 Da) as well as C185 geranylgeranylation with C181 palmitoylation (21,719.03 Da). C, KRAS4B versus KRAS4A proteoform relative abundances in the HT-29 cell line (top) and corresponding KRAS4A fragment ion map (bottom). D, allele-specific KRAS4A proteoforms shown in HCT-116 parental and WT isogenic cell lines. Asterisks denote oxidation. FT–ICR, Fourier transform ion cyclotron resonance; MEF, mouse embryonic fibroblast.
Figure 4
Figure 4
KRASinprimarycolorectaltumors.A, RNA-Seq data collected from tumors showing percent abundance of KRAS4A transcripts out of total KRAS (top). Only the tumor sample 01CO008 displayed a KRAS4A proteoform above the threshold for detection by TDMS. The relative abundance of this proteoform (KRAS4A:G12VC180PalmFarn/Me) was very low compared with the canonical KRAS4B:G12VFarn/Me proteoform (bottom). B, abundance of mutant KRAS4B in tumors as determined by either RNA-Seq (46) and TDMS. C, fragment ion maps showing that TDMS can distinguish mutant from WT proteoforms within the same tumor. Site of mutation is depicted by colored circles. TDMS, top–down mass spectrometry.
Figure 5
Figure 5
Novel KRAS4B Truncation.A, graphical fragment maps from TDMS of KRAS4BFarn/Me and KRAS4BC185∗ proteoforms and their corresponding structural models (Protein Data Bank ID: 5TAR). B, scheme depicting hypothesized differences in membrane association and cell signaling between KRAS4BFarn/Me and KRAS4BC185∗. C, scatter plot showing pERK/ERK levels in MEFs transfected with different plasmids (WT = GFP-KRAS4BWT; no Cys185 = GFP-KRAS4BC185∗; GFP = GFP-only vector; EV = empty vector; NT = no transfection control) normalized to pERK/ERK levels in parental (PAR) MEFs (no 4OHT, no transfection). Densitometry measurements were performed by Fiji ImageJ (73). All three replicates are displayed. D, intensity traces of GFP-KRAS and Membrane Dye 650 signal versus distance across a cell as determined by Fiji ImageJ (micrometer) (top) and live-cell images of HeLa cells expressing KRAS4BFarn/Me or KRAS4BC185∗ plasmids (bottom) (bar represents 5 μm). 4OHT, 4-hydroxytamoxifen; MEF, mouse embryonic fibroblast; TDMS, top–down mass spectrometry.
Figure 6
Figure 6
Schematic diagram of RAS proteoforms either unique or shared between cell lines and colorectal tumor samples.Green triangle indicates internal methylation as distinct from carboxymethylation at the C terminus.

References

    1. Barbacid M. Ras genes. Annu. Rev. Biochem. 1987;56:779–827. - PubMed
    1. Vigil D., Cherfils J., Rossman K.L., Der C.J. Ras superfamily GEFs and GAPs: validated and tractable targets for cancer therapy? Nat. Rev. Cancer. 2011;10:842–857. - PMC - PubMed
    1. Prior I.A., Hood F.E., Hartley J.L. The frequency of ras mutations in cancer. Cancer Res. 2020;80:2969–2974. - PMC - PubMed
    1. Prior I.A., Lewis P.D., Mattos C. A comprehensive survey of Ras mutations in cancer. Cancer Res. 2012;72:2457–2467. - PMC - PubMed
    1. Haigis K.M. KRAS alleles: the devil is in the detail. Trends Cancer. 2017;3:686–697. - PMC - PubMed

Publication types

MeSH terms

Substances