. 2022 Dec 5;13(1):7494.
doi: 10.1038/s41467-022-34460-w.

Proteogenomic characterization of MiT family translocation renal cell carcinoma

Affiliations

Proteogenomic characterization of MiT family translocation renal cell carcinoma

Yuanyuan Qu et al. Nat Commun. .

Abstract

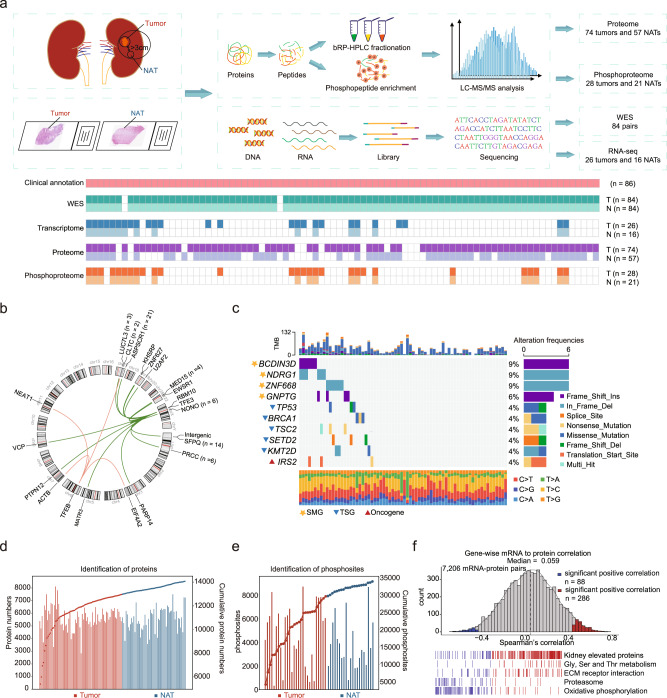
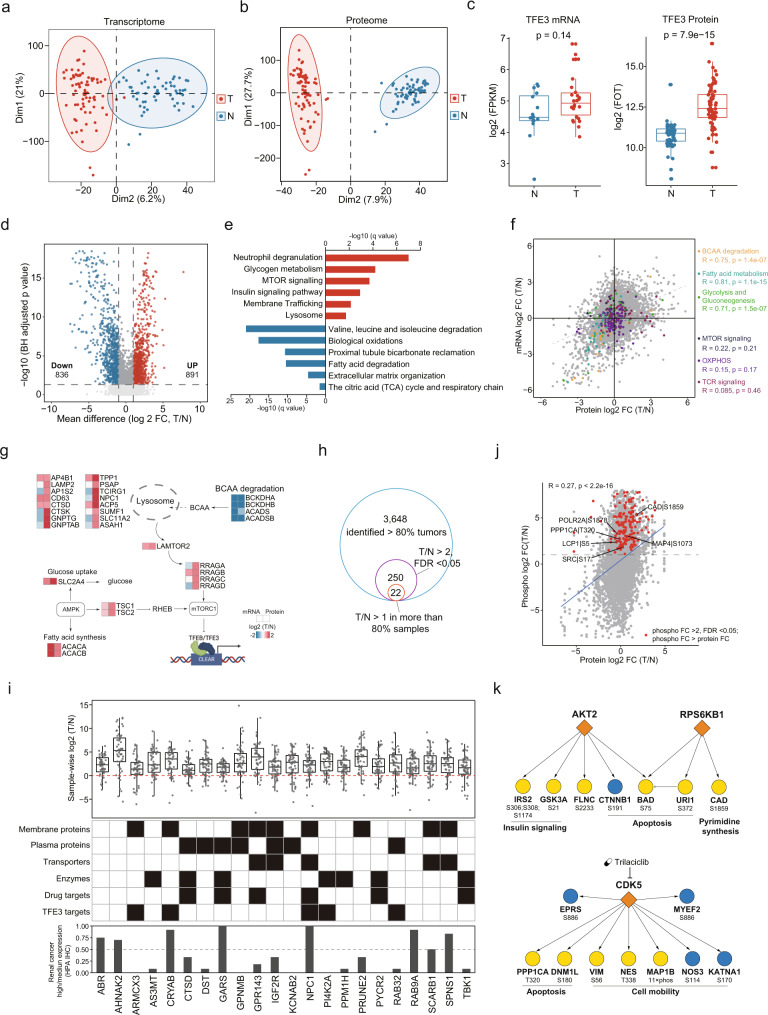
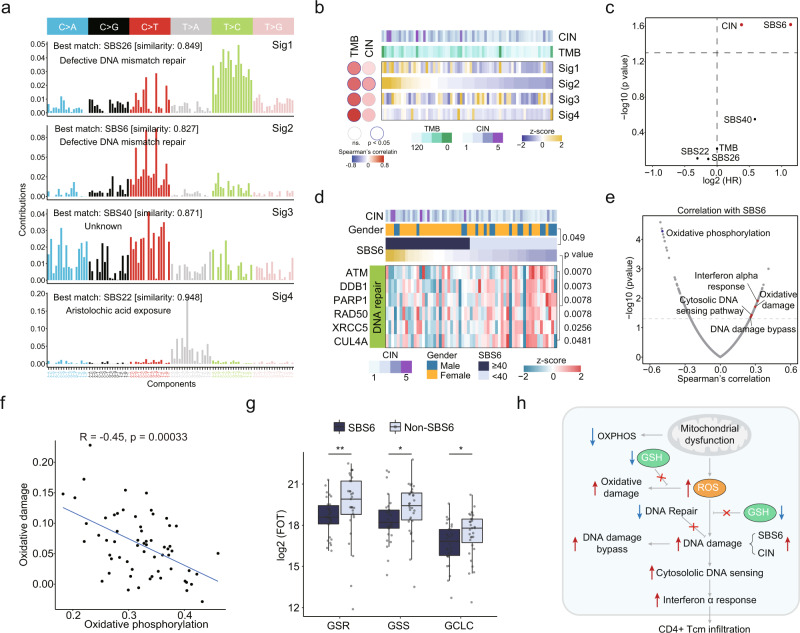
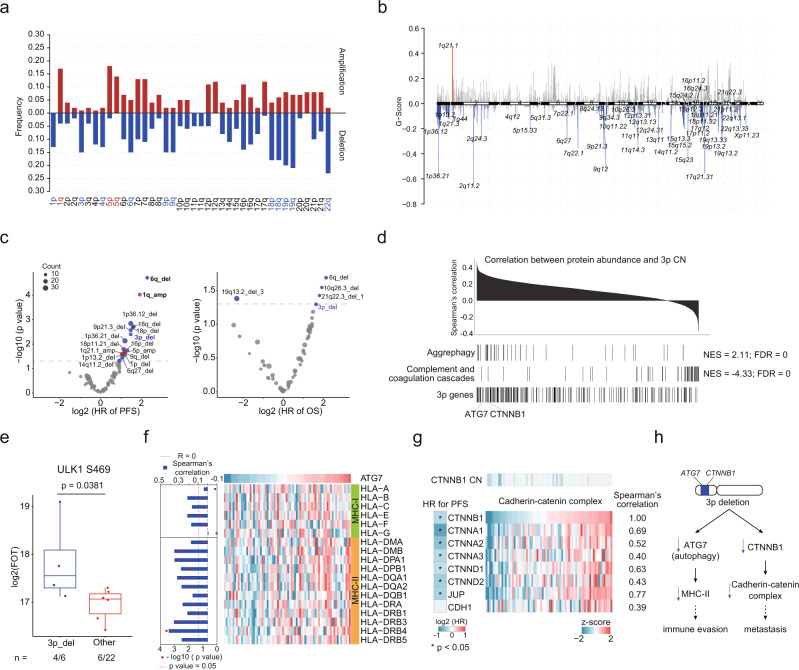
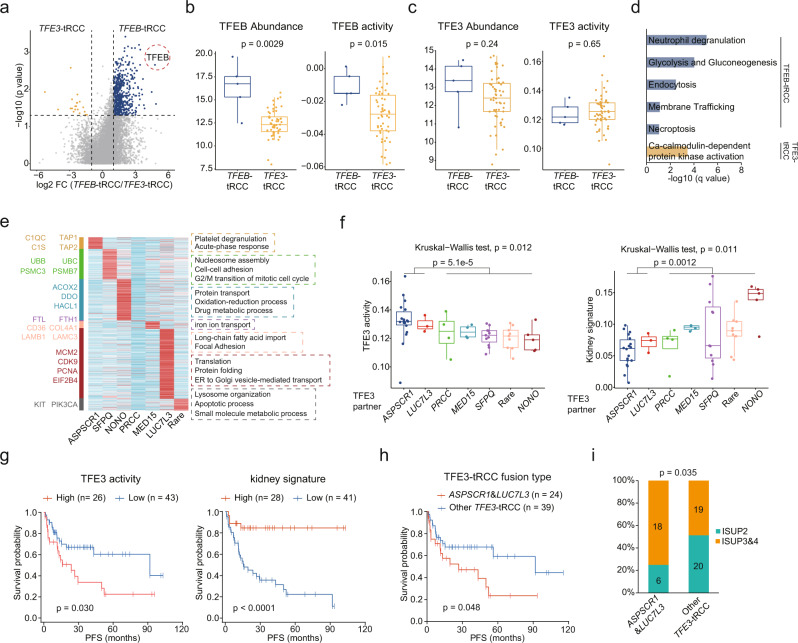
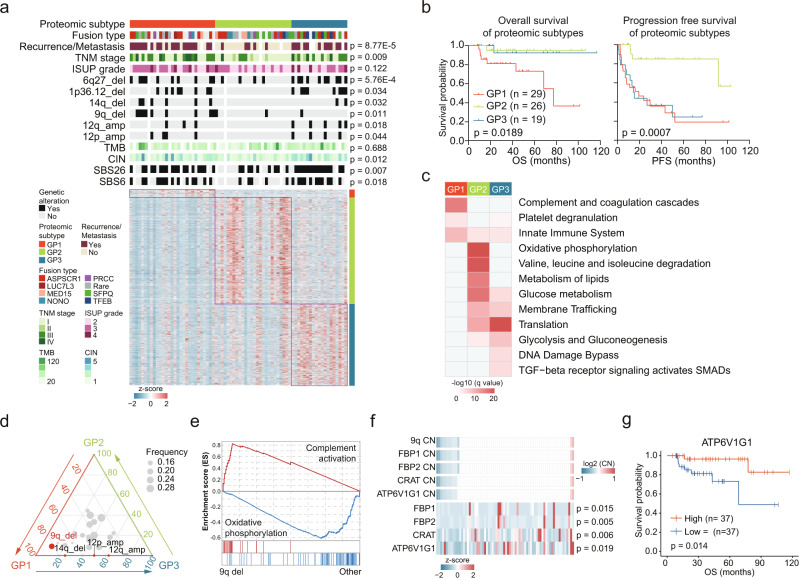
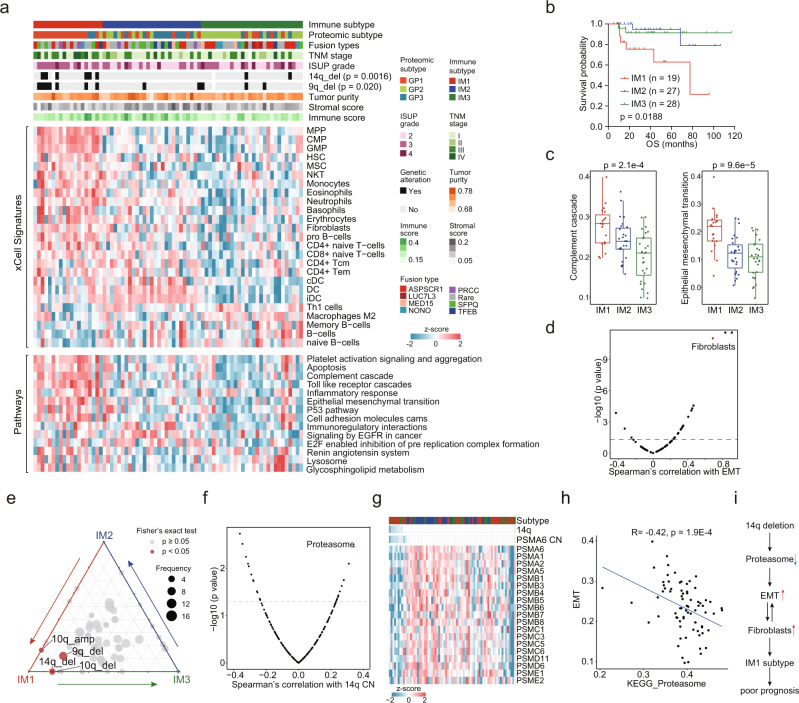
Microphthalmia transcription factor (MiT) family translocation renal cell carcinoma (tRCC) is a rare type of kidney cancer, which is not well characterized. Here we show the comprehensive proteogenomic analysis of tRCC tumors and normal adjacent tissues to elucidate the molecular landscape of this disease. Our study reveals that defective DNA repair plays an important role in tRCC carcinogenesis and progression. Metabolic processes are markedly dysregulated at both the mRNA and protein levels. Proteomic and phosphoproteome data identify mTOR signaling pathway as a potential therapeutic target. Moreover, molecular subtyping and immune infiltration analysis characterize the inter-tumoral heterogeneity of tRCC. Multi-omic integration reveals the dysregulation of cellular processes affected by genomic alterations, including oxidative phosphorylation, autophagy, transcription factor activity, and proteasome function. This study represents a comprehensive proteogenomic analysis of tRCC, providing valuable insights into its biological mechanisms, disease diagnosis, and prognostication.


Conflict of interest statement

The authors declare no competing interests.

Figures

Fig. 1
Fig. 1. Molecular profiling of MiT family tRCC.
a Schematic representation of tRCC multiomics analyses, including WES, RNA-seq, proteomics, and phosphoproteomics. b Circos plot showing the TFE3/TFEB gene fusion events. c Genomic profile of 70 tRCC tumors with somatic mutations. SMGs, TSGs, and oncogenes are noted by different shapes. d Overview of proteomic profiles of tRCC samples. e Overview of phosphoproteomic profiles of tRCC samples. f Gene-wise mRNA-protein correlation and functional enrichment.
Fig. 2
Fig. 2. Molecular alterations in tRCC tumors compared to adjacent tissues.
ab Global transcriptome and proteome PCA plots. Red, tumor; Blue, NATs. c Boxplots of TFE3 gene product levels displaying discordant mRNA (N, n = 16; T, n = 26)-protein (N, n = 57; T, n = 74) expression. Boxplots show the median (central line), the 25–75% interquartile range (IQR) (box limits), the ±1.5 × IQR (whiskers). P values are derived from two-sided Wilcoxon rank-sum test. d Volcano plot showing DEPs (Benjamini–Hochberg-adjusted p value < 0.05, FC > 2) in tumor and normal adjacent tissues. e DEPs in tumors and adjacent tissues, and their enriched biological pathways. f Scatterplots depicting expression of mRNA (x axis) and protein (y axis). Genes involved in BCAA degradation, Fatty acid metabolism, Glycolysis and Gluconeogenesis, MTOR signaling, OXPHOS, and TCR signaling were indicated by different colors. g Schema of uncoupling of MTOR pathways at mRNA and protein levels. h The pipeline for tRCC biomarker identification. i Log2-fold-change between tumor and matched NATs (n = 54) is shown for the 22 tRCC biomarkers. Boxplots show the median (central line), the 25–75% IQR (box limits), the ±1.5 × IQR (whiskers). These biomarkers are annotated with potential clinical utilities and IHC staining scores defined by HPA. j Comparison of abundance changes between phosphosites and their corresponding proteins. Red points indicate the phosphosites with >2-fold increase (Benjamini–Hochberg adjusted p < 0.05) and change stronger than in the corresponding protein. Phosphosites with functional annotations are indicated. k The kinase-substrate links of significantly activated kinases (at both protein abundance and kinase activity).
Fig. 3
Fig. 3. Identification of mutational signatures and associated signaling pathways.
a Decomposition of four mutational signatures from the tRCC cohort. b Correlations between mutational signatures and TMB and CIN. c Cox regression analysis of TMB, CIN, and mutational signatures. d Heatmap showing differentially expressed DNA repair molecules between tRCC with and without SBS6 (two-sided Wilcoxon rank-sum test). e Scatter plot showing the correlation of SBS6 and Wikipathway ssGSEA scores. f Wikipathways oxidative damage and oxidative phosphorylation shows a strong negative correlation. g Relative protein abundance in SBS6 (n = 30) and non-SBS6 (n = 31) groups for ROS defense proteins GSR (**p = 0.0065), GSS (*p = 0.019), and GCLC (*p = 0.044). Boxplots show the median (central line), the 25–75% IQR (box limits), the ±1.5 × IQR (whiskers). P values are derived from two-sided Wilcoxon rank-sum test. GSR Glutathione-Disulfide Reductase, GSS Glutathione Synthetase, GCLC Glutamate-Cysteine Ligase Catalytic Subunit. h Schematic representation of the molecular features of tRCC with SBS6 signature.
Fig. 4
Fig. 4. Somatic copy number alteration analysis in tRCC cohort.
a Arm-level SCNA events. Red denotes amplification and blue denotes deletion. Significant events are highlighted using red and blue (q < 0.10). b Focal SCNA events. Focal peaks with significant copy number amplifications (red) and deletions (blue) (q < 0.05) are shown. c Cox regression analysis of significant arm-level CNA and focal CNA events. d Identifying cis- and trans-effect of 3p deletion. Proteins are ranked based on the correlation between protein abundance and 3p CN. e Trans-effect of 3p deletion on ULK1 S469 phosphorylation level. Boxplots show the median (central line), the 25–75% IQR (box limits), the ±1.5 × IQR (whiskers). P value is derived from two-sided Wilcoxon rank-sum test. f Correlations between ATG7 protein abundance and MHC molecules. g Cis and trans- effects of CTNNB1 deletion on cadherin-catenin complex abundances. Cox regression analysis of cadherin-catenin complex abundances are shown in left. h A model depicting the association of 3p deletion and poor prognosis in tRCC.
Fig. 5
Fig. 5. Molecular heterogeneity of different fusion types of tRCC.
a Volcano plot showing DEPs (two-sided Wilcoxon rank-sum test, p value <0.05, FC > 2) of TFEB-tRCC and TFE3-tRCC tumors. b, c Comparisons of TFEB and TFE3 product levels and activities in TFEB-tRCC (n = 5) and TFE3-tRCC (n = 54) tumors. d DEPs in TFEB-tRCC and TFE3-tRCC tumors enriched biological pathways. e Elevated proteins in different TFE3-tRCC fusion types and involved biological processes. f Comparison of TFE3 activities and kidney signature scores among different TFE3-tRCC fusion types (APSCR1, n = 18; LUC7L3, n = 3; PRCC, n = 4, MED15, n = 4; SFPQ, n = 11; Rare, n = 9; NONO, n = 5). P values are derived from two-sides Wilcoxon rank-sum test. g Kaplan–Meier curves of PFS for patients with different TFE3 activities and kidney signature scores (two-sided log-rank test). h Kaplan–Meier curves of PFS for ASPSCR1 and LUC7L3 TFE3-tRCC tumors versus other TFE3-tRCC tumors in this cohort (two-sided log-rank test). i Proportions of ISUP grades for ASPSCR1 and LUC7L3 TFE3-tRCC tumors versus other TFE3-tRCC tumors (One-sided Fisher’s exact test). Data in b, c, f are shown using boxplots. Boxplots show the median (central line), the 25–75% IQR (box limits), the ±1.5 × IQR (whiskers). P values are derived from two-sided Wilcoxon rank-sum test.
Fig. 6
Fig. 6. Proteomic subtypes of tRCC and associations with genetic features and clinical outcomes.
a Relative abundances of upregulated proteins in the three proteomic subtypes and associations of proteomic subtypes with clinical and genetic features (Fisher’s exact test or Kruskal–Wallis test). b Kaplan–Meier curves of OS and PFS for the three subtypes (two-sided log-rank test). c Upregulated pathways enriched in the three proteomic subtypes. d Ternary plot showing the distribution of significant arm-level events in the three proteomic subtypes. CNA events with significant differences among three proteomic subtypes are indicated (Fisher’s exact test). e GSEA plots showing the trans-effect of 9q deletion. f Cis-effects of 9q deletion in tRCC. P values are derived from two-sided Spearman’s correlation test. g Kaplan–Meier curves of OS for patients with different ATP6V1G1 abundances (two-sided log-rank test).
Fig. 7
Fig. 7. Immune infiltration of tRCC tumors.
a Relative abundances of upregulated proteins in the three immune subtypes and associations of immune subtypes with clinical and genetic features and proteomic subtypes (Fisher’s exact test). b Kaplan–Meier curves of OS for the three immune subtypes (two-sided log-rank test). c Comparison of pathway scores for the Complement Cascade and EMT among immune subtypes (IM1, n = 19; IM2, n = 27; IM3, n = 28). Boxplots show the median (central line), the 25–75% IQR (box limits), and the ±1.5 × IQR (whiskers). P values are derived from Kruskal–Wallis test. d Scatter plot showing the correlation of EMT scores and xCell immune signatures. Fibroblasts are indicated. e Ternary plot showing the distribution of significant arm-level events in the three immune subtypes. CNA events with significant differences among three subtypes are indicated (Fisher’s exact test). f Proteasome showing the highest correlation with 14q CN. g Cis and trans-effects of 14q deletion on proteasome. h Correlation of proteasome scores and EMT scores (two-sided Spearman’s correlation test). i A model depicting the association of 14q deletion and immune signature in tRCC.

Comment in

References

    1. Kauffman EC, et al. Molecular genetics and cellular features of TFE3 and TFEB fusion kidney cancers. Nat. Rev. Urol. 2014;11:465–475. doi: 10.1038/nrurol.2014.162. - DOI - PMC - PubMed
    1. Srigley, J. R. et al. The international society of urological pathology (ISUP) vancouver classification of renal neoplasia. 37, 1469–1489, (2013). - PubMed
    1. Classe M, et al. Incidence, clinicopathological features and fusion transcript landscape of translocation renal cell carcinomas. Histopathology. 2017;70:1089–1097. doi: 10.1111/his.13167. - DOI - PubMed
    1. Ellis C, et al. Clinical heterogeneity of Xp11 translocation renal cell carcinoma: impact of fusion subtype, age, and stage. Mod. Pathol. 2014;27:875–886. doi: 10.1038/modpathol.2013.208. - DOI - PubMed
    1. Magers M, Udager A, Mehra R. MiT family translocation-associated renal cell carcinoma: a contemporary update with emphasis on morphologic, immunophenotypic, and molecular mimics. Arch. Pathol. Lab. Med. 2015;139:1224–1233. doi: 10.5858/arpa.2015-0196-RA. - DOI - PubMed

Publication types

MeSH terms

Substances