. 2022 Dec 5;13(1):7217.
doi: 10.1038/s41467-022-34897-z.

The circadian clock influences T cell responses to vaccination by regulating dendritic cell antigen processing

Affiliations

The circadian clock influences T cell responses to vaccination by regulating dendritic cell antigen processing

Mariana P Cervantes-Silva et al. Nat Commun. .

Abstract

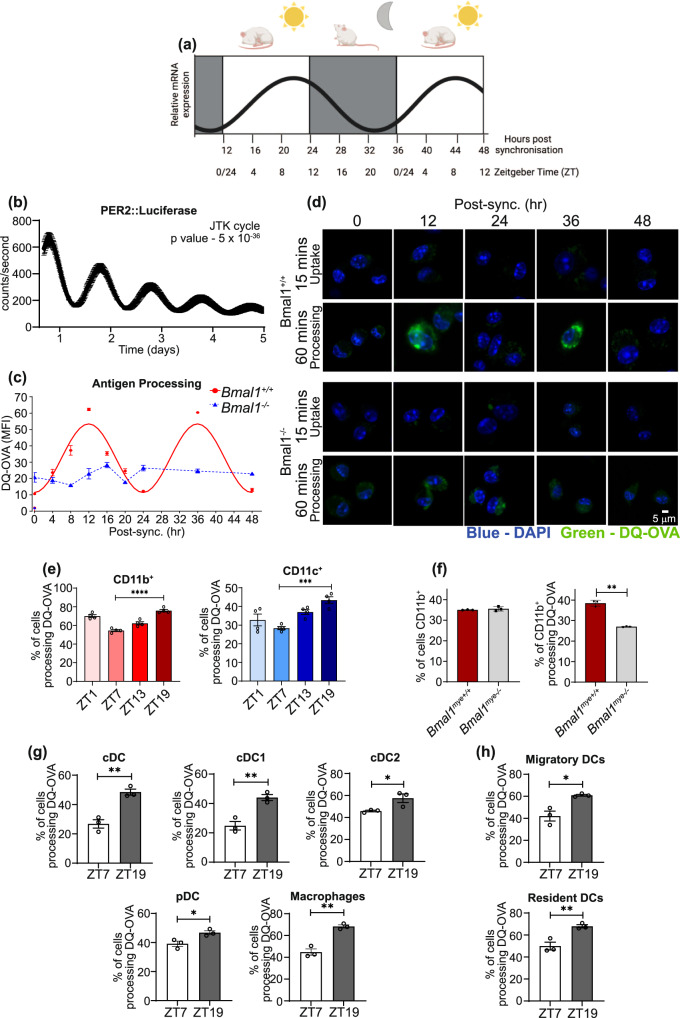
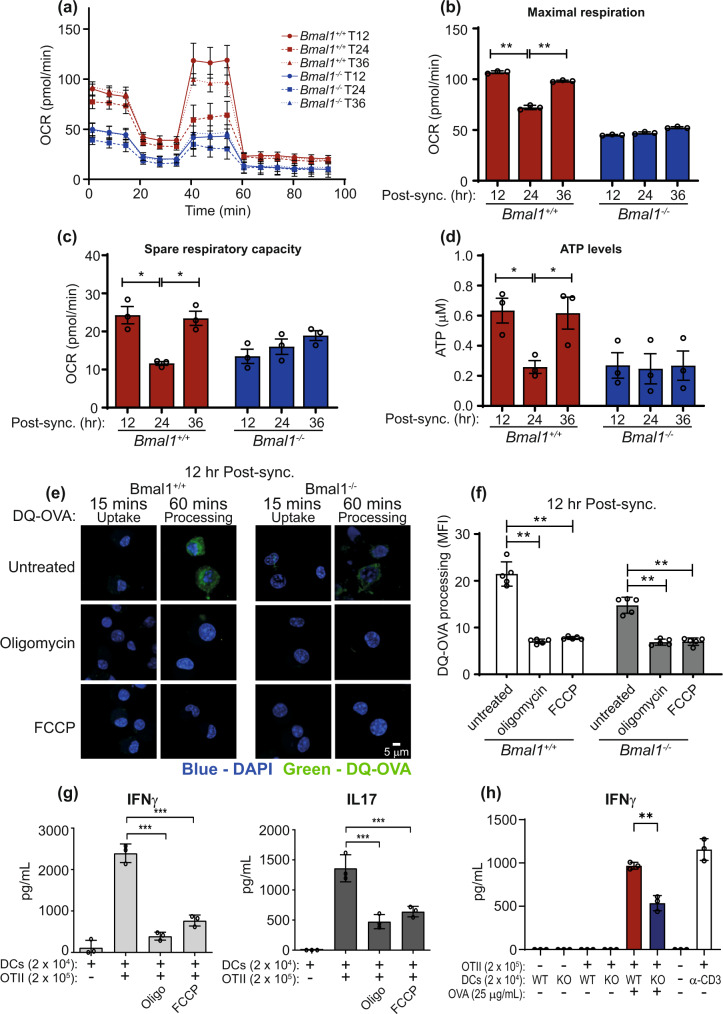
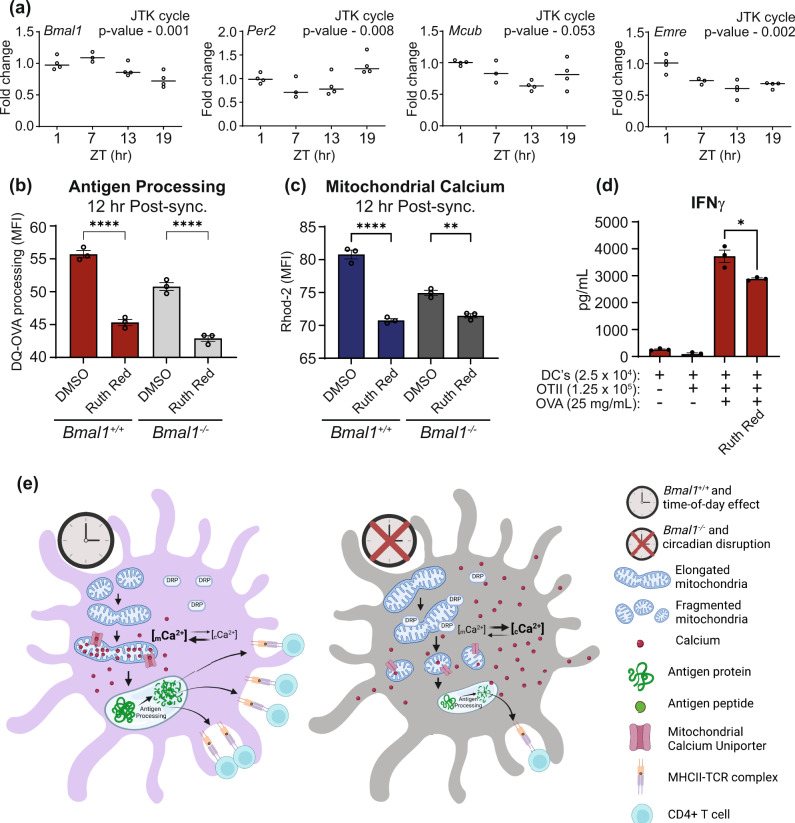
Dendritic cells play a key role in processing and presenting antigens to naïve T cells to prime adaptive immunity. Circadian rhythms are known to regulate many aspects of immunity; however, the role of circadian rhythms in dendritic cell function is still unclear. Here, we show greater T cell responses when mice are immunised in the middle of their rest versus their active phase. We find a circadian rhythm in antigen processing that correlates with rhythms in both mitochondrial morphology and metabolism, dependent on the molecular clock gene, Bmal1. Using Mdivi-1, a compound that promotes mitochondrial fusion, we are able to rescue the circadian deficit in antigen processing and mechanistically link mitochondrial morphology and antigen processing. Furthermore, we find that circadian changes in mitochondrial Ca2+ are central to the circadian regulation of antigen processing. Our results indicate that rhythmic changes in mitochondrial calcium, which are associated with changes in mitochondrial morphology, regulate antigen processing.


Conflict of interest statement

The authors declare no competing interests.

Figures

Fig. 1
Fig. 1. T cell activation and proliferation is dependent on time-of-day of immunisation.
a Experimental design for adoptive transfer of labelled T cells and immunisations by circadian phase. CTV+ OT-II CD4+ T cells (harvested at ZT3) were transferred directly into ZT7 or ZT19 recipient mice. 24 h later immunisations of ZT7 or ZT19 recipient mice occurred. Immunisations were performed using wcP vaccine + OVA 10 µg/mouse (n = 6 mice) or PBS control (n = 3 mice) and mediastinal lymph nodes harvested 72 h later. b, c Proliferation of CTV+ stained OT-II CD4+ T cells harvested from mediastinal lymph node. d Percentage of divided and undivided CTV+ stained OT-II CD4+ T cells (n = 6 immunised mice or n = 3 control mice) p = 0.04 for divided and undivided cells. e Representative plot of CD69+ expression on CTV+ stained OT-II CD4+ T cells. f Percentage of CD69+ expression on CTV+ stained OT-II CD4+ T cells (n = 6 immunised mice or n = 3 control mice) p = 0.02. Data shown is mean with error bars representing ± SEM. Data were compared using two-tailed t-test, *p < 0.05. Source data are provided as a Source Data file.
Fig. 2
Fig. 2. Dendritic cells display robust circadian rhythms in antigen processing.
a A schematic summarising how ZT time can be inferred from the in vitro synchonised serum shock model comparing Per2 mRNA oscillation in BMDCs. Shading represents the relative active periods. As mice are nocturnal, 12 h post synchronisation represents ZT0 the onset of the inactive phase, whereas 24 h post synchronisation represents ZT12 the onset of the active phase. b Per2::luciferase BMDCs were synchronised by serum shock and circadian rhythms were measured using lumicycle technology (n = 3 biologically independent samples). Bmal1+/+ and Bmal1/ BMDCs were synchronised and antigen processing was measured at c 4 h or d 12 h intervals over a 48 h time course (n = 3 independent experiments). Antigen processing was measured by addition of DQ-OVA (1 µg/mL) and fluorescence (blue – DAPI, green – DQ-OVA) was measured at 15 min (uptake) or 60 min (processing) and then fixed and analysed by confocal microscopy. e Spleens were isolated from WT mice at ZT1, ZT7, ZT13 and ZT19 and single cell suspension generated, stained for DQ-OVA (1 μg/mL) as in (c, d) and subsequently stained for CD11b+ and CD11c+ and analysed by flow cytometry (n = 4 mice). f Spleens isolated from Bmal1myeloid+/+ and Bmal1myeloid/ mice and stained for DQ-OVA as in (c, d) and CD11b+ and analysed by flow cytometry (n = 3 mice) p = 0.0045. g, h Splenic DCs were expanded by B16-FLT3L cells. g cDCs, cDC1s, cDC2s, plasmacytoid DCs and macrophages, or h migratory and resident DCs were identified by flow cytometry and DQ-OVA processing quantified by flow cytometry (n = 3–4 mice). cDC p = 0.003, cDC1 p = 0.005, cDC2 p = 0.04, pDC p = 0.02, macs p = 0.001, migratory DCs p = 0.01, resident DCs p = 0.0092 Data shown is mean with error bars representing ± SEM. Luciferase data was analysed for circadian rhythmicity by JTK cycle (b). Antigen processing in Bmal1+/+ was predicted to be circadian by cosinor analysis (c). Data were compared by one-way ANOVA with Tukey’s post-hoc test for multiple comparisons (e) or by a two-tailed t-test (f–h). *p < 0.05, **p < 0.01, ***p < 0.001 and ****p < 0.0001. Source data are provided as a Source Data file.
Fig. 3
Fig. 3. Dendritic cell mitochondrial metabolism displays circadian rhythmicity which directs antigen processing and T cell activation.
a Bmal1+/+ and Bmal1−/− BMDCs were synchronised and OCR was measured at indicated times post serum synchronisation using an XFe96 Analyzer and from this b maximal respiration and c spare respiratory capacity measurements were derived (n = 3 biologically independent samples). d Bmal1+/+ and Bmal1−/− BMDCs were synchronised and ATP levels were measured at indicated times using an ATP/ADP assay kit (n = 3 biologically independent cells). e and f Bmal1+/+ and Bmal1−/− BMDCs at 12 h post synchronisation were treated with oligomycin (10 µM) or FCCP (10 µM) and antigen processing was then measured by confocal microscopy using DQ-OVA (1 µg/mL) (n = 5 biologically independent samples). g BMDCs (unsynchronised) were treated with oligomycin (10 µM) and FCCP (10 µM) for 2 h. OVA protein (25 µg/mL) was then added to the BMDCs for 2 h. Supernatants were removed and indicated number of OTII CD4+ T-cells were added. Cells were incubated for 3 days before IFNγ and IL17 were analysed by ELISA (n = 3 biologically independent samples) (h) Bmal1+/+ and Bmal1−/− BMDCs (unsynchronised) were incubated with OVA protein (25 µg/mL) for 2 h. Supernatants were removed and indicated number of OTII CD4+ T-cells were added. Cells were incubated for 3 days before IFNγ was analysed by ELISA (n = 3 biologically independent samples). Data shown is mean with error bars representing ± SEM. Statistical significance was determined using one-way ANOVA with Tukey’s post-hoc test for multiple comparisons. Results are from duplicate BMDCs cultures, from two independent experiments. *p < 0.05, **p < 0.01, ***p < 0.001. Source data are provided as a Source Data file.
Fig. 4
Fig. 4. Mitochondrial fission and fusion in BMDCs display robust circadian rhythms that are dependent on Bmal1.
a–g Bmal1+/+ and Bmal1−/− BMDCs were synchronised and mitochondria were stained with Mitotracker Red CMXRos (50 nM) at indicated timepoints. Mitochondrial morphology was assessed over a 48 h time course in a Bmal1+/+ and b Bmal1−/− using confocal microscopy. Differences in morphology are illustrated in c at 12 h and d at 36 h post synchronisation between Bmal1+/+ and Bmal1−/− BMDCs. Arrows highlight examples of mitochondrial fusion and fission. (e) Mitochondrial fission (fragmented mitochondria) (f) mitochondrial fusion (elongated mitochondria and (g) mitochondrial membrane potential were quantified by confocal microscopy (n = 3 biologically independent samples). h Bmal1+/+ and Bmal1−/− BMDCs were stained with Mitotracker green FM dye at indicated time points post synchronisation and analysed by flow cytometry (n = 3 biologically independent samples). Data shown is mean with error bars representing ± SEM. Mitochondrial fission and membrane potential in Bmal1+/+ were predicted to be circadian by cosinor analysis (e and g). Data were compared by one-way ANOVA with Tukey’s post-hoc test for multiple comparisons (h). Source data are provided as a Source Data file.
Fig. 5
Fig. 5. Promoting mitochondrial fusion with Mdivi-1 increases DC antigen processing.
a Bmal1+/+ and Bmal1−/− BMDCs were synchronised and treated with Mdivi-1 (10 µM) 12 h prior to the designated timepoint. At the designated time point, mitochondria were then stained with Mitotracker Red CMXRos (50 nM) and mitochondrial morphology was measured using confocal microscopy. b Bmal1+/+ and Bmal1−/− BMDCs were synchronised and treated with Mdivi-1 (10 µM) as in (a) and antigen processing was then measured by confocal microscopy at the indicated times post synchronisation using DQ-OVA (1 µg/mL) (c and d). Quantification of antigen processing in Bmal1+/+ and Bmal1/ BMDCs using confocal microscopy at indicated times post-synchronisation (n = 30 independent images). Data shown is mean with error bars representing ± SEM. Data were analysed by one-way ANOVA with Tukey’s post-hoc test for multiple comparisons. ***p < 0.001. Source data are provided as a Source Data file.
Fig. 6
Fig. 6. Circadian rhythms in calcium localisation co-ordinate rhythms in antigen processing.
a Confocal microscopy analysis of calcium localisation in synchronised Bmal1+/+ and Bmal1−/− BMDCs by staining with Fluo-4 (cytosolic) or Rhod-2 (mitochondrial). b Mitochondrial calcium quantification and c cytosolic calcium quantification from confocal analysis (n = 10 independent images). d Bmal1+/+ and Bmal1−/− BMDCs were synchronised and pre-treated with Mdivi-1 (10 μM). Mitochondrial calcium uptake was quantified using Rhod-2 by confocal microscopy at 24 h post synchronisation (n = 28–50 independent images). e Bmal1+/+ and Bmal1−/− BMDCs were synchronised and treated with FK506 (12 h; 1 μM) and mitochondria morphology quantified by confocal microscopy at 24 h post synchronisation (n = 3 biologically independent samples). f Bmal1+/+ and Bmal1−/− BMDCs were synchronised and antigen processing was quantified by confocal microscopy at indicated timepoints by the addition of DQ-OVA (1 µg/mL) in the presence or absence of FK506 (1 µM). (n = 50 independent images). Data shown is mean with error bars representing ± SEM. Data were analysed by one-way ANOVA with Tukey’s post-hoc test for multiple comparisons. *p < 0.05, **p < 0.01 and ****p < 0.0001. Source data are provided as a Source Data file.
Fig. 7
Fig. 7. Circadian variation in mitochondrial calcium and antigen processing is directed via control of the mitochondrial calcium uniporter.
a Spleens were isolated from WT mice at ZT 1, 7, 13 and 19. CD11c+ cells were isolated and mRNA analysed by qPCR. Circadian analysis was performed using Metacycle and cycMethod set to “JTK”. P value for each gene is specified on the graph. (n = 3 mice) (b, c) Bmal1+/+ and Bmal1−/− BMDCs were synchronised by serum shock. DQ-OVA and mitochondrial calcium uptake was quantified at 12 h post synchronisation in the presence and absence of ruthenium red (5 µM) (n = 3 biologically independent samples). d CD11c+ cells were isolated from WT spleen at ZT4 and treated with ruthenium red (10 µM) for 3 h. OVA protein (25 µg/mL) was then added for 2 h. Supernatants were removed and indicated number of OTII CD4+ T-cells were added to CD11c+ cells. Cells were incubated for 3 days before IFNγ were analysed by ELISA (n = 3 biologically independent samples) p = 0.02. e Schematic showing proposed mechanisms by which the circadian clock in DCs controls antigen processing as inferred from the present study. Data shown are means with error bars representing ± SEM. Data were analysed by Ordinary one-way ANOVA with Tukey’s post-hoc test for multiple comparisons (b, c) or by a two-tailed t-test (d). **p < 0.01 and ****p < 0.0001. Source data are provided as a Source Data file.

References

    1. Silver AC, Arjona A, Walker WE, Fikrig E. The circadian clock controls toll-like receptor 9-mediated innate and adaptive immunity. Immunity. 2012;36:251–261. doi: 10.1016/j.immuni.2011.12.017. - DOI - PMC - PubMed
    1. Oliva-Ramirez J, Moreno-Altamirano MM, Pineda-Olvera B, Cauich-Sanchez P, Sanchez-Garcia FJ. Crosstalk between circadian rhythmicity, mitochondrial dynamics and macrophage bactericidal activity. Immunology. 2014;143:490–497. doi: 10.1111/imm.12329. - DOI - PMC - PubMed
    1. Gibbs JE, et al. The nuclear receptor REV-ERBalpha mediates circadian regulation of innate immunity through selective regulation of inflammatory cytokines. Proc. Natl Acad. Sci. USA. 2012;109:582–587. doi: 10.1073/pnas.1106750109. - DOI - PMC - PubMed
    1. Pick R, He W, Chen CS, Scheiermann C. Time-of-day-dependent trafficking and function of leukocyte subsets. Trends Immunol. 2019;40:524–537. doi: 10.1016/j.it.2019.03.010. - DOI - PubMed
    1. Gagnidze K, et al. Nuclear receptor REV-ERBalpha mediates circadian sensitivity to mortality in murine vesicular stomatitis virus-induced encephalitis. Proc. Natl Acad. Sci. USA. 2016;113:5730–5735. doi: 10.1073/pnas.1520489113. - DOI - PMC - PubMed

Publication types

LinkOut - more resources