. 2022 Dec 5;13(1):7496.
doi: 10.1038/s41467-022-34732-5.

Genome-wide association study of REM sleep behavior disorder identifies polygenic risk and brain expression effects

Lynne Krohn  1   2 Karl Heilbron  3 Cornelis Blauwendraat  4 Regina H Reynolds  5   6 Eric Yu  1   2 Konstantin Senkevich  1   2 Uladzislau Rudakou  1   2 Mehrdad A Estiar  1   2 Emil K Gustavsson  6   7 Kajsa Brolin  8 Jennifer A Ruskey  2 Kathryn Freeman  2 Farnaz Asayesh  2 Ruth Chia  4 Isabelle Arnulf  9 Michele T M Hu  10   11 Jacques Y Montplaisir  12   13 Jean-François Gagnon  12   14 Alex Desautels  12   15 Yves Dauvilliers  16 Gian Luigi Gigli  17 Mariarosaria Valente  17   18 Francesco Janes  17 Andrea Bernardini  17 Birgit Högl  19 Ambra Stefani  19 Abubaker Ibrahim  19 Karel Šonka  20 David Kemlink  20 Wolfgang Oertel  21 Annette Janzen  21 Giuseppe Plazzi  22   23 Francesco Biscarini  24 Elena Antelmi  23   25 Michela Figorilli  26 Monica Puligheddu  26 Brit Mollenhauer  27   28 Claudia Trenkwalder  27   28 Friederike Sixel-Döring  21   27 Valérie Cochen De Cock  29   30 Christelle Charley Monaca  31 Anna Heidbreder  32 Luigi Ferini-Strambi  33 Femke Dijkstra  34   35   36 Mineke Viaene  34   35 Beatriz Abril  37 Bradley F Boeve  38 23andMe Research TeamSonja W Scholz  39   40 Mina Ryten  6   7 Sara Bandres-Ciga  4 Alastair Noyce  41   42 Paul Cannon  3 Lasse Pihlstrøm  43 Mike A Nalls  44   45 Andrew B Singleton  4   45 Guy A Rouleau  1   2   46 Ronald B Postuma  2   46 Ziv Gan-Or  47   48   49
Collaborators, Affiliations

Genome-wide association study of REM sleep behavior disorder identifies polygenic risk and brain expression effects

Lynne Krohn et al. Nat Commun. .

Abstract

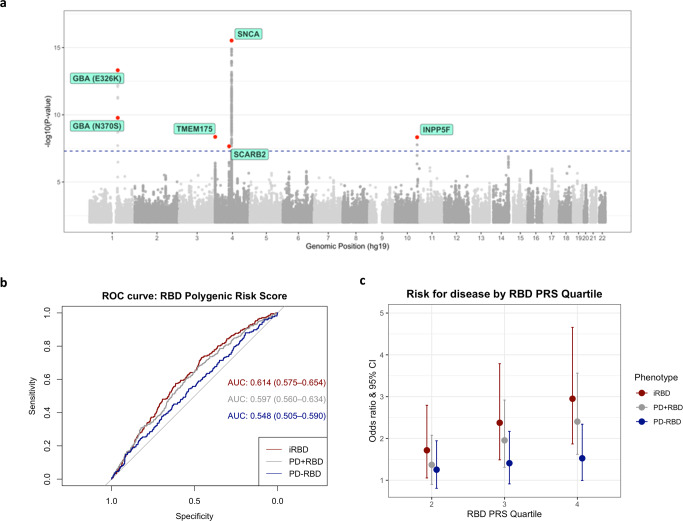
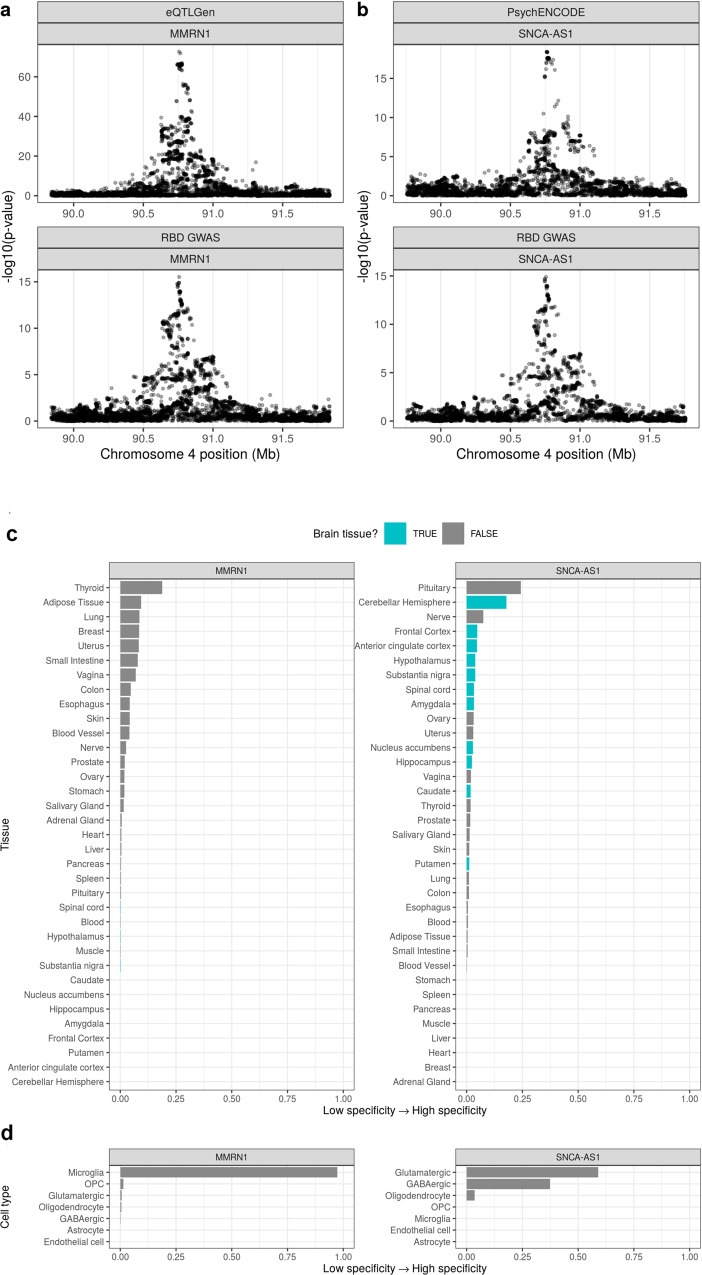
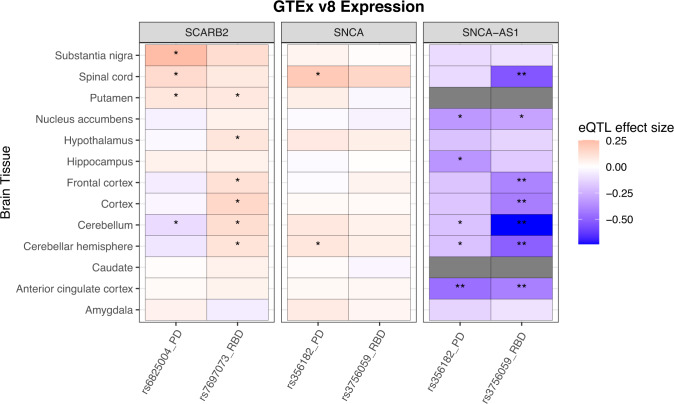
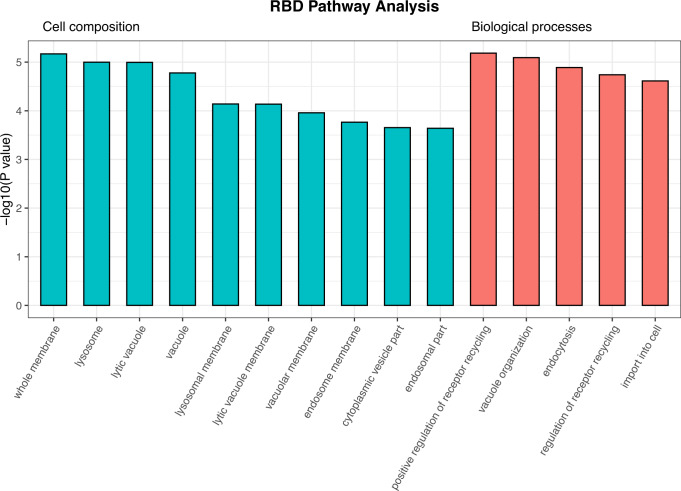
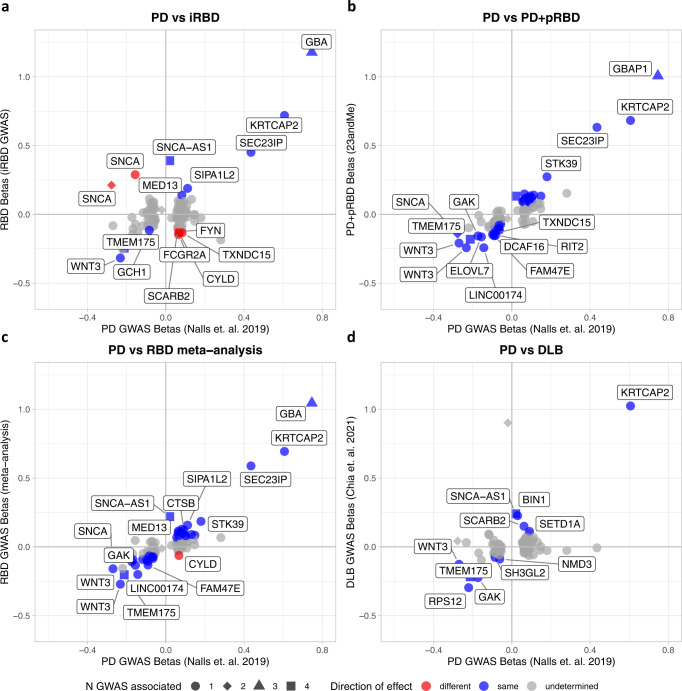
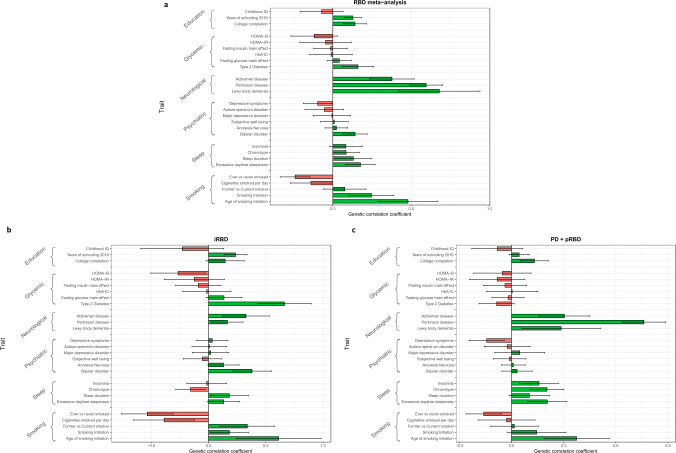
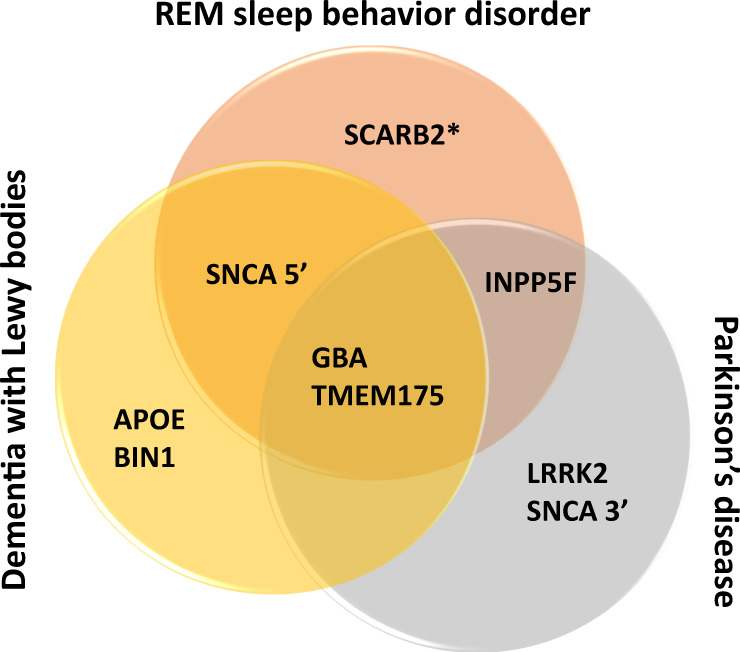
Rapid-eye movement (REM) sleep behavior disorder (RBD), enactment of dreams during REM sleep, is an early clinical symptom of alpha-synucleinopathies and defines a more severe subtype. The genetic background of RBD and its underlying mechanisms are not well understood. Here, we perform a genome-wide association study of RBD, identifying five RBD risk loci near SNCA, GBA, TMEM175, INPP5F, and SCARB2. Expression analyses highlight SNCA-AS1 and potentially SCARB2 differential expression in different brain regions in RBD, with SNCA-AS1 further supported by colocalization analyses. Polygenic risk score, pathway analysis, and genetic correlations provide further insights into RBD genetics, highlighting RBD as a unique alpha-synucleinopathy subpopulation that will allow future early intervention.


Conflict of interest statement

S.W.S. serves on the Scientific Advisory Council of the Lewy Body Dementia Association. S.W.S. is an editorial board member for JAMA Neurology and the Journal of Parkinson’s Disease. I.A. was previously consultant for Idorsia pharma, and UCB Pharma. A.D. served on the scientific advisory board for Eisai, UCB, Jazz Pharma, received research support from Jazz Pharma, Flamel Ireland, Canopy Growth, and honoraria from speaking engagements from Eisai and Sunovion. M.A.N.’s participation in this project was part of a competitive contract awarded to Data Tecnica International LLC by the National Institutes of Health to support open science research, he also currently serves on the scientific advisory board for Clover Therapeutics and is an advisor to Neuron23 Inc as a data science fellow. Z.G.O. is supported by the Fonds de recherche du QuebecSante (FRQS) Chercheurs-boursiers award, and is a Parkinson’s Disease Canada New Investigator awardee. He received consultancy fees from Ono Therapeutics, Handl Therapeutics, Neuron23, Lysosomal Therapeutics Inc., Bial Biotech Inc., Deerfield, Lighthouse, and Idorsia, all unrelated to the current study. K.H., P.F., and the 23andMe Research Team are employed by and hold stock or stock options in 23andMe, Inc. The remaining authors declare no competing interests.

Figures

Fig. 1
Fig. 1. Summary of GWAS findings in the RBD meta-analysis. Manhattan plot.
ROC receiver operating characteristic, iRBD idiopathic REM sleep behavior disorder, PRS polygenic risk score, PD Parkinson’s disease, pRBD probable RBD. a The Manhattan plot highlights the 6 GWAS-nominated loci after meta-analysis. GWAS was performed as repeated logistic regression across the genome, adjusted for age, sex, and principal components. Each point represents the log adjusted p-value at each genomic site. A locus was considered significant if the two-sided p-value was less than the corrected GWAS-significant p-value threshold of 5E-08, visualized in this plot with the dashed line. The points in red show the top variant at that locus, as well as any secondary independent associations. Predictive power of RBD polygenic risk score. Polygenic risk scores for RBD were calculated using FDR-corrected GWAS variants (N SNPs = 47) in 3 cohorts: idiopathic RBD, PD+pRBD, and PD–pRBD, each with controls. b The predictive power of the PRS in each cohort was assessed with area under the curve (AUC) and 95% confidence intervals. c The PRS for each cohort were divided in quartiles and analyzed against case status with logistic regression (N iRBD = 212 with N controls = 1265; N PD+pRBD = 285 with N controls = 907; N PD–pRBD = 217 with N controls = 907). The odds ratios and 95% confidence intervals (the odds ratio +/− 1.96*standard error) are visualized here as compared to the lowest quartile (the lowest 25% of scores).
Fig. 2
Fig. 2. Regional association plots for eQTL and RBD GWAS colocalizations and tissue and cell-type specificity of MMRN1 and SNCA-AS1.
RBD REM sleep behavior disorder, GWAS genome-wide association study. Regional association plots for eQTL (upper pane) and RBD GWAS association signals (lower pane) in the regions surrounding a SNCA-AS1 (colocalization PPH4 = 0.89) and b MMRN1 (colocalization PPH4 = 0.86). eQTLs are derived from a PsychENCODE’s analysis of adult brain tissue from 1387 individuals or b the eQTLGen meta-analysis of 31,684 blood samples from 37 cohorts. In a and b, the x-axis denotes chromosomal position in hg19, and the y-axis indicates association p-values from across-locus logistic (RBD GWAS) or linear (eQTL) regression on a –log10 scale. Plot of SNCA-AS1 and MMRN1 specificity in c 35 human tissues (GTEx dataset) and d 7 broad categories of cell type derived from human middle temporal gyrus (AIBS dataset). Specificity represents the proportion of a gene’s total expression attributable to one cell type/tissue, with a value of 0 meaning a gene is not expressed in that cell type/tissue and a value of 1 meaning that a gene is only expressed in that cell type/tissue. In c tissues are colored by whether they belong to the brain. In c and d, tissues and cell types have been ordered by specificity from high to low.
Fig. 3
Fig. 3. eQTL data from GTEx version 8 for RBD and PD top variants in differing loci.
GTEx Genotype-Tissue Expression Consortium, v8 version 8, RBD REM sleep behavior disorder, PD Parkinson’s disease, eQTL expression quantitative trait loci. All data was extracted from the GTEx online portal (https://www.gtexportal.org/). The effect sizes represent the slope of linear regression on normalized gene expression data versus the genotype status using single-tissue eQTL analysis, performed by the GTEx consortium. Nominal associations are indicated with* (p < 0.05) while FDR-corrected significant associations are indicated with**. FDR correction q-values were calculated using beta distribution-adjusted empiracle p-values, derived from adaptive permutations during eQTL mapping. Dark gray indicates missing data in these tissues. The RBD SNCA variant correlates most strongly with decreased SNCA-AS1 expression in the cerebellum (uncorrected p = 9.9e-19) cerebellar hemisphere (p = 3.1e-08), cortex (p = 1.9e-05), frontal cortex (p = 6.3e-05), and anterior cingulate cortex (p = 2.6e-04). The PD variant only significantly correlates with decreased expression in the anterior cingulate cortex (p = 2.5e-05).
Fig. 4
Fig. 4. Pathways associated with genes nominated by RBD meta-analysis.
RBD REM sleep behavior disorder. We used WebGestalt (http://www.webgestalt.org/) to perform gene-set enrichment analysis in cellular components and biological processes. Enrichment scores are calculated similar to Kolmogorov–Smirnov statistics; they indicate whether a group of genes is over- or under-represented in a list of processes. Two-sided p-values are calculated by comparison to the enrichment scores null distribution, produced with phenotypic permutation testing. Bars on this plot represent the unadjusted p-values for pathways nominated by gene-set enrichment analysis. All pictured pathways are significant after FDR multiple testing correction.
Fig. 5
Fig. 5. Beta-beta plots comparing synucleinopathy GWAS summary statistics to the latest PD GWAS.
PD Parkinson’s disease, RBD REM sleep behavior disorder, GWAS genome-wide association study, pRBD probable RBD, DLB dementia with Lewy bodies. We compare significance and direction of PD GWAS-nominated loci to this study’s summary statistics for iRBD (a), PD+pRBD (b), the meta-analysis (c), and in the previously published DLB summary statistics (d). Colored points indicate variants with the same (blue) or opposite (red) direction of effect in both studies, with a nominally significant p-value (p < 0.05) in their respective genome-wide association studies (two-sided p-value derived from logistic regression across the genome). All test statistics for each cohort can be found in Supplementary Table 5. Gray points are those with undetermined direction (p > 0.05 and confidence intervals cross 0). The shapes of the points indicate the number of synucleinopathy GWAS where the locus reaches GWAS significance (counting PD, PD age at onset, DLB, and this RBD meta-analysis). Gene names indicate the closest gene to the represented variant.
Fig. 6
Fig. 6. Genetic correlation results.
RBD REM sleep behavior disorder, PD Parkinson’s disease, pRBD probable REM sleep behavior disorder. Genetic correlation was calculated using LD-score regression for a the RBD meta-analysis (N cases = 2843 and N controls = 139,636), b isolated RBD (iRBD) alone (N cases = 1061 and N controls = 8386), and c PD+pRBD alone (N cases = 1782 and N controls = 131,250). The traits tested are organized in their general categories as labeled by LD Hub. The error bars represent the genetic correlation coefficient +/– the standard error, centered on the correlation coefficient.
Fig. 7
Fig. 7. Key GWAS-significant loci across three synucleinopathies.
It has been shown that the genetic risk for PD and DLB do not overlap completely, and we show that the same is true for RBD and the other two synucleinopathies. Here, we demonstrate key genetic risk loci for the three synucleinopathies. Only GBA and TMEM175 are shared between all three, both of which play a role in the autophagy-lysosomal pathway. SNCA plays a role in PD, DLB, and RBD risk, yet the strongest risk locus for PD is at the 3’ end of the gene while RBD and DLB share a risk locus at the 5’ end. Similarly, SCARB2 is a risk factor for PD as well as RBD, however, the RBD locus is independent of the variant identified for PD risk (as indicated by the asterisk in the figure).

References

    1. Dauvilliers Y, et al. REM sleep behaviour disorder. Nat. Rev. Dis. Prim. 2018;4:19. doi: 10.1038/s41572-018-0016-5. - DOI - PubMed
    1. Postuma, R. et al. Quantifying the risk of neurodegenerative disease in idiopathic REM sleep behavior disorder. Neurology72, 1296–1300 (2009). - PMC - PubMed
    1. Postuma RB, et al. Risk and predictors of dementia and parkinsonism in idiopathic REM sleep behaviour disorder: a multicentre study. Brain. 2019;142:744–759. doi: 10.1093/brain/awz030. - DOI - PMC - PubMed
    1. Högl, B., Stefani, A. & Videnovic, A. J. N. R. N. Idiopathic REM sleep behaviour disorder and neurodegeneration—an update. Nat. Rev. Neurol. 14, 40 (2018). - PubMed
    1. Vendette M, et al. REM sleep behavior disorder predicts cognitive impairment in Parkinson disease without dementia. Neurology. 2007;69:1843–1849. doi: 10.1212/01.wnl.0000278114.14096.74. - DOI - PubMed

Publication types