. 2023 May;7(5):692-703.
doi: 10.1038/s41551-022-00968-1. Epub 2022 Dec 5.

A library of base editors for the precise ablation of all protein-coding genes in the mouse mitochondrial genome

Affiliations

A library of base editors for the precise ablation of all protein-coding genes in the mouse mitochondrial genome

Pedro Silva-Pinheiro et al. Nat Biomed Eng. 2023 May.

Abstract

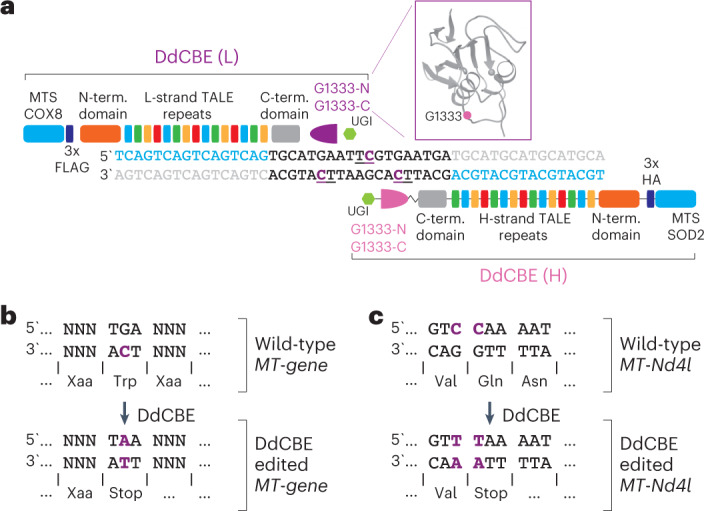
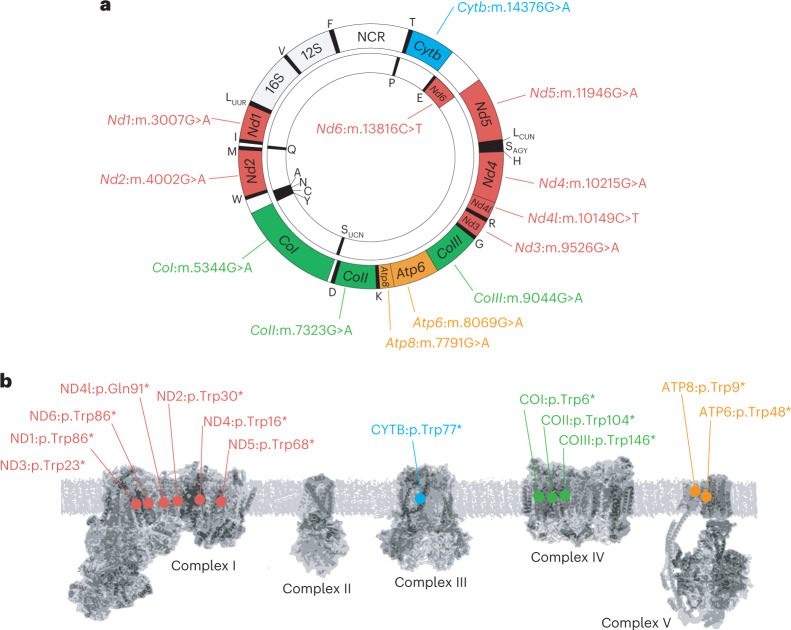
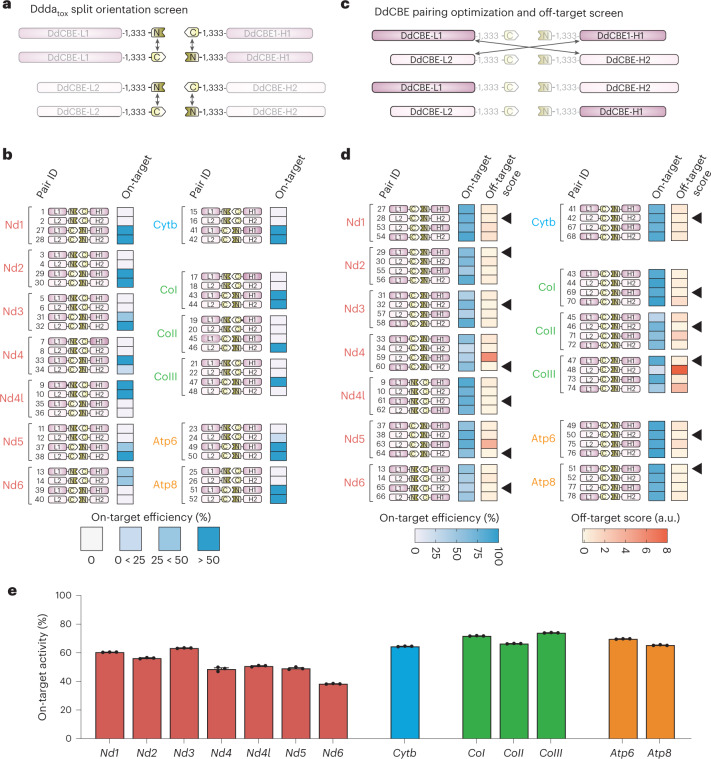
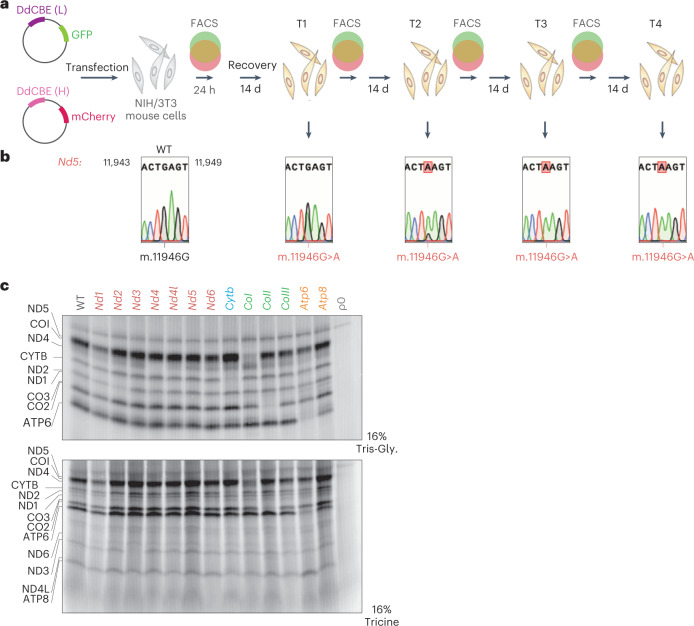
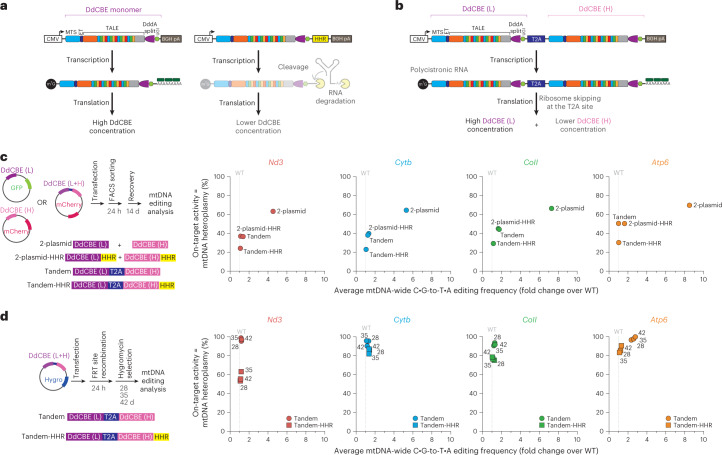
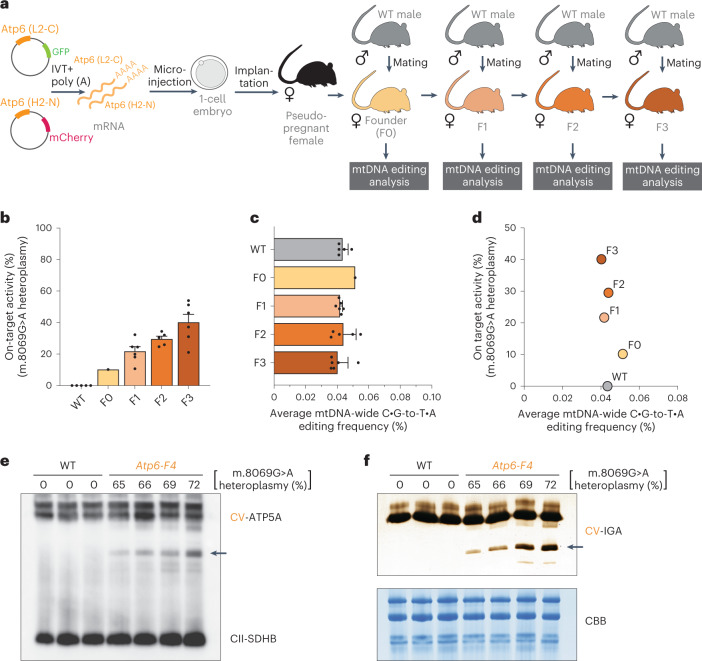
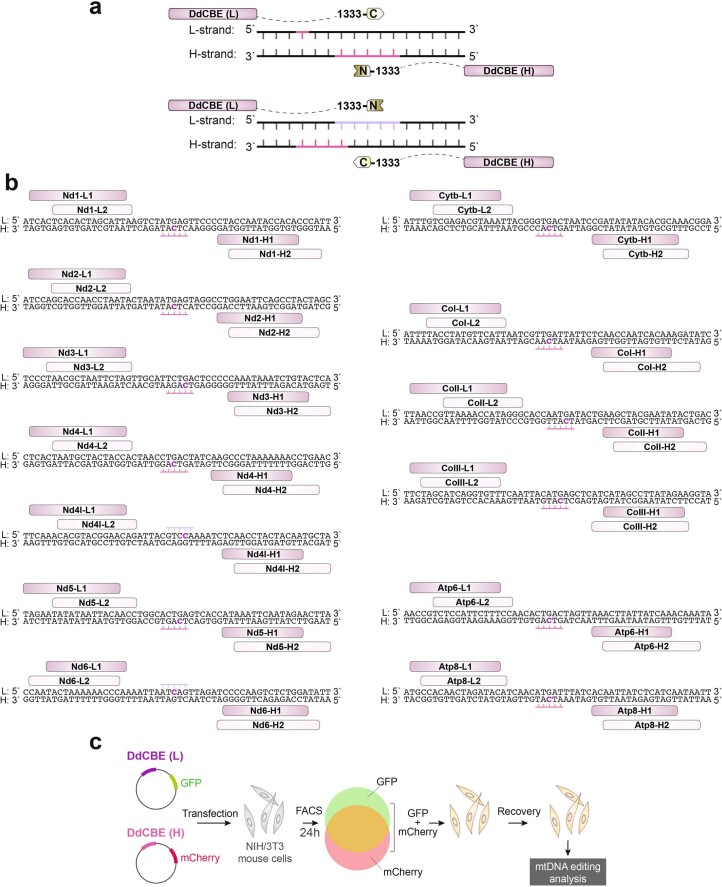
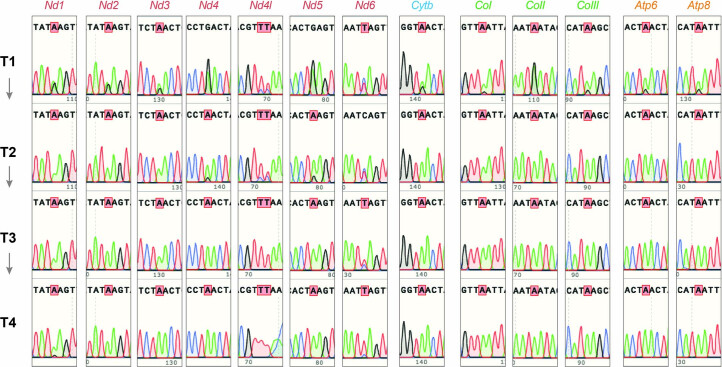
The development of curative treatments for mitochondrial diseases, which are often caused by mutations in mitochondrial DNA (mtDNA) that impair energy metabolism and other aspects of cellular homoeostasis, is hindered by an incomplete understanding of the underlying biology and a scarcity of cellular and animal models. Here we report the design and application of a library of double-stranded-DNA deaminase-derived cytosine base editors optimized for the precise ablation of every mtDNA protein-coding gene in the mouse mitochondrial genome. We used the library, which we named MitoKO, to produce near-homoplasmic knockout cells in vitro and to generate a mouse knockout with high heteroplasmy levels and no off-target edits. MitoKO should facilitate systematic and comprehensive investigations of mtDNA-related pathways and their impact on organismal homoeostasis, and aid the generation of clinically meaningful in vivo models of mtDNA dysfunction.


Conflict of interest statement

M.M. is a founder, shareholder and member of the Scientific Advisory Board of Pretzel Therapeutics, Inc. P.S-P., P.A.N., L.V.H., and C.D.M. provide consultancy services for Pretzel Therapeutics. P.S-P., C.D.M and M.M. have filed patent applications on this work. L.V.H. is director of NextGenSeek Ltd. The remaining authors declare no competing interests.

Figures

Fig. 1
Fig. 1. MitoKO DdCBE library design strategy.
a, The architecture of DdCBE monomers used to generate the mitoKO library targeting each protein-coding gene of the mouse mtDNA. The mtDNA specificity is provided by programmable TALE domains. In each experiment, the DddAtox G1333 split (purple) was tested in both orientations to achieve editing of the desired ‘TC’ sites. The MTS were from human superoxide dismutase 2 (SOD2) or cytochrome C oxidase subunit 8 (COX8). UGI, uracil glycosylase inhibitor. L-strand or (L), light mtDNA strand. H-strand or (H), heavy mtDNA strand. b, The strategy employed to ablate the 12 out of 13 mtDNA protein-encoded genes (Nd1, Nd2, Nd3, Nd4, Nd5, Nd6, Cytb, CoI, CoII, CoIII, Atp6 and Atp8) by introducing a premature stop codon with base editing. In the vertebrate mitochondrial genetic code, the TGA codon encodes tryptophan (Trp). Transition of the cytosine (C) in the opposite strand to a thymine (T) (in purple) using base editing leads to a premature TAA stop codon. c, The strategy employed to knock out the mtDNA protein-encoded gene Nd4l, by introducing a premature stop codon with base editing. Transition of the cytosine (C) in a CAA codon encoding glutamine (Gln) to a thymine (T) (in purple) using base editing leads to a premature TAA stop codon, thereby silencing the Nd4l gene. In this site, base editing can potentially edit the adjacent C of a GTC codon encoding valine (Val). However, the resulting GTT codon also encodes valine leading to a silent mutation.
Fig. 2
Fig. 2. Target sites of the MitoKO DdCBE library.
a, Genetic map of mouse mtDNA indicating the position of DdCBE-introduced STOP mutations. b, Schematic representation of the OXPHOS system indicating the positions of protein truncation.
Fig. 3
Fig. 3. Selection screening of DdCBEs for MitoKO library generation.
a, Schematic of the first screening for the optimization of DddAtox G1333 split orientation. In this screen, DdCBEs were generated by pairing TALEs L1 with H1 and L2 with H2 (Extended Data Fig. 1), testing the N-terminal fragment of DddAtox G1333 linked to L1 or L2 and the C-terminal part linked to H1 or H2, and the reciprocal orientation, with the C terminal of DddAtox G1333 linked to L1 or L2 and the N terminal linked to H1 or H2. b, In vitro on-target editing efficiency in cells after transient expression with the indicated MitoKO DdCBE pairs (Pair ID). The schematics represent the DdCBE pair combinations and which DddAtox G1333 split orientation was used. On-target efficiency was analysed by Sanger sequencing. Note the impact of split orientation on the on-target efficiency. c, Schematic of the second screening for the optimization of DdCBE pairings and off-target analysis. In this screen, DdCBEs with the most efficient DddAtox G1333 split orientation (from screen 1; b,c) were tested with additional pairings: TALEs L1 with H2 and L2 with H1. d, In vitro on-target editing efficiency and off-target scores in NIH/3T3 cells after transient expression with the indicated DdCBE pairs from the MitoKO library (Pair ID). The schematics represent the DdCBE pair combinations and which DddAtox G1333 split orientation was used. On-target efficiency and off-targets were analysed by next-generation sequencing (NGS). The final MitoKO DdCBEs (indicated with black arrows) were selected on the basis of high on-target efficiency and low off-target score (less mtDNA-wide off-targets). Source data are provided as a Source Data file. e, On-target editing by the lead MitoKO DdCBE pairs from 14 d after transfection measured by NGS. Bars and error bars represent mean ± s.e.m. (n = 3 technical replicates). Source data
Fig. 4
Fig. 4. Near-homoplasmic mtDNA editing using the MitoKO library.
a, Schematic of the general workflow for evaluation of the four iterative transfection and recovery cycles (T1–T4) of MitoKO pairings (for further details, see Extended Data Fig. 1c). b, Sanger sequencing of the Nd5 editing site upon iterative cycles of expression and recovery (for the remaining mtDNA genes, see Extended Data Fig. 2). c, Mitochondrial de novo protein synthesis in the NIH/3T3 cells that underwent four rounds of MitotKO DdCBE treatment, assessed by 35S-methionine metabolic labelling. WT and mtDNA-less Rho-0 cells (p0) were used as controls. The mtDNA-encoded products were resolved in two gel systems (16% Tris-Gly and 16% Tricine). For densitometric quantification, see Extended Data Fig. 3a. Source data
Fig. 5
Fig. 5. Optimization of MitoKO constructs by limiting off-target mutagenesis.
a, Schematic of MitoKO transgene (DdCBE monomer) without (left) or with the HHR incorporated (right). After transcription, the mRNA encoding DdCBE is constitutively degraded following HHR cleavage, resulting in substantially lower quantities of translated protein. ET, epitope tag; BGH pA, bovine growth hormone polyadenylation signal. Other symbols/abbreviations as in (Fig. 1a.) or defined in text. b, Schematic of MitoKO transgenes (DdCBE (L) and DdCBE (H)) linked by the T2A ribosome skipping sequence. Expression of the DdCBE in the tandem T2A-linked arrangements leads to lower concentrations of the downstream monomer in the mitochondrial matrix. c, Left: schematic of the general workflow for the on/off-target optimization experiments, involving transient transfection of NIH/3T3 cells with plasmids co-expressing DdCBE monomers and fluorescent marker proteins, FACS-based selection of cells expressing both monomers, recovery and phenotypic evaluation of DdCBE-treated cells (top). Schematic representation of the DdCBE arrangements used (bottom). Right: on-target (Y axis) and off-target (X axis) performance of the Nd3, Cytb, CoII and Atp6 MitoKO constructs transiently delivered into NIH/3T3 cells as separate monomers (2-plasmid), separate monomers with the HHR incorporated in mRNA (2-plasmid-HHR), bi-cistronic construct with the tandemly arrayed DdCBE monomers being linked by the T2A element (Tandem) and the tandem T2A-linked monomers harbouring HHR (Tandem-HHR). Dots represent the mean (n = 3 biological replicates). Source data are provided as a Source Data file. d, Left: schematic of the workflow of the on/off-target optimization experiments for stably expressed tandem constructs without (Tandem) or with HHR (Tandem-HHR), involving transfection, recombination into a docking nuclear DNA site and hygromycin selection (top). Schematic representation of the DdCBE arrangements used (bottom). Right: on-target (Y axis) and off-target (X axis) performance of the Nd3, Cytb, CoII and Atp6 Tandem and Tandem-HHR MitoKO constructs stably expressed in NIH/3T3 cells. Dots represent the mean (n = 3 biological replicates). Source data
Fig. 6
Fig. 6. In vivo mouse mtDNA editing with the MitoKO library.
a, Schematic representation of the use of Atp6 MitoKO constructs (L2-C and H2-N) for the generation of F0 founder animals carrying a heteroplasmic m.8069 G > A mutation and subsequent selective breeding scheme. IVT+poly(A), in vitro transcription and polyadenylation. b, The m.8069 G > A heteroplasmy (Y axis) in the F1–F3 generations of the selectively bred founder F0 female. Bars and error bars represent the mean ± s.e.m. c, Off-target editing in the F0–F3 m.8069 G > A animals and WT controls. Bars and error bars represent the mean ± s.e.m. d, On-target (Y axis) vs off-target (X axis) editing in the F0–F3 m.8069 G > A animals and WT controls. e, Immunoblotting of mitochondria isolated from skeletal muscle of F4 generation Atp6 m.8069 G > A heteroplasmic mice and WT controls upon a CNGE with a CV-specific antibody (ATP5A). Arrow indicates CV subcomplexes. An antibody specific for complex II (SDHB) was used as loading control. f, CNGE followed by in-gel ATP hydrolysis activity of CV in mitochondria isolated from skeletal muscle of F4 generation Atp6 m.8069 G > A heteroplasmic mice and WT controls. Arrow indicates the activity of CV subassemblies. Coomassie brilliant blue (CBB) was used as loading control. For e and f, uncropped scans are provided as a Source Data file. Source data
Extended Data Fig. 1
Extended Data Fig. 1. Design of the MitoKO library.
a. Schematic representation of possible DdCBE orientations of the DddAtox G1333 split and corresponding preference for base editing of cytosines within the DNA targeting window. The N and C-terminal fragments of the DddAtox G1333 split can be linked to the TALE arrays binding either L-strand or H-strand of the mtDNA. The split orientation influences which cytosines are edited. b. The TALE designs to target all mouse protein-coding genes in the mouse mitochondrial genome. For each mtDNA protein-encoding gene, two TALEs binding the L-strand (L1 and L2) and two TALEs binding the H-strand (H1 and H2) of the mtDNA were designed to yield variable spacing windows, so that the target cytosine will be positioned at the center to reflect the preference of the DddAtox G1333 split. c. Schematic of the general workflow for the screening of the MitoKO library involving transient transfection of cultured mouse NIH/3T3 cells with plasmids co-expressing DdCBE monomers and fluorescent marker proteins, followed by FACS-based selection of cells expressing both monomers and evaluation of mtDNA from DdCBE-treated cells, 7 days post-transfection.
Extended Data Fig. 2
Extended Data Fig. 2. Sequential transfection of MitoKO constructs.
Editing of each mouse mtDNA protein-encoded gene (Nd1, Nd2, Nd3, Nd4, Nd4l, Nd5, Nd6, Cytb, CoI, CoII, CoIII, Atp6 and Atp8) using the MitoKO library in the indicated time-points as in Fig. 4 (T1, T2, T3 and T4), analyzed by Sanger sequencing.
Extended Data Fig. 3
Extended Data Fig. 3. Mitochondrial translation and OXPHOS complex integrity in the MitoKO DdCBE-treated cells.
a. Densitometric quantification of the mitochondrial de novo protein synthesis gels presented in Fig. 4c. WT (dark grey line) was used as baseline control in each mtDNA protein-encoded gene. The top panel refers to the 16% Tris-Gly gel and the bottom panel refers to the 16% Tricine gel. Source data are provided as a Source Data file. b. Immunoblotting of a BNGE with antibodies specific to each mitochondrial complex: NDUFB8 (CI), UQRC2 (CIII) COX IV (CIV) and ATP5A (CV), in mitochondria isolated from NIH/3T3 cells that underwent four rounds of MitoKO DdCBE treatment with the Nd4l, Nd5, Nd6, CoIII, Atp8 pairs and WT controls. An antibody specific for complex II (SDHB) was used as loading control. Uncropped scans are provided as a Source Data file. Source data
Extended Data Fig. 4
Extended Data Fig. 4. Mitochondrial respiration and cell growth of MitoKO DdCBE-treated cells.
a. Basal oxygen consumption rates (OCRs) of MitoKO DdCBE-treated cells after 4 cycles of iterative treatments (see Fig. 4). Wild-type (WT) and p0 cells, containing no mtDNA, were used as controls. Bars represent the mean and error bars represent ± SEM (n = 5, biological replicates). Ordinary one-way ANOVA with Dunnett´s test: **** P-value < 0.0001. Source data are provided as a Source Data file. b,c. Growth curves of MitoKO DdCBE-treated cells after 4 cycles of iterative treatments (see Fig. 4) cultured in DMEM supplemented with either glucose (a) or galactose (b). Galactose necessitates mitochondrial ATP production via oxidative phosphorylation. Each cell line is indicated on the plot and grouped by mitochondrial respiratory complex. Wild-type (WT) and p0 cells, containing no mtDNA, were used as controls. Measurements were done using an Incucyte S3 live-cell imaging system. 9 images were taken per well every 6 hours for 7.5 days. Coloured dots represent mean (n = 3, biological replicates). Source data are provided as a Source Data file. d. Editing of MitoKO DdCBE-treated cells after being cultured for 7.5 days in DMEM supplemented with either glucose or galactose, analyzed by Sanger sequencing. Source data
Extended Data Fig. 5
Extended Data Fig. 5. mtDNA off-target editing by the lead MitoKO DdCBE pairs following high level expression.
a,b. Mitochondrial genome-wide off-targeting of the lead MitoKO DdCBE pairs (Fig. 3) measured by NGS 14 days after transfection and presented as absolute values (a) or fold change over wild-type (WT) controls (b). Bars represent the mean and error bars represent ± SEM (n = 3, technical replicates). Source data are provided as a Source Data file. c. On-target (Y axis) vs. off-target (X axis) for the lead MitoKO DdCBE pairs. Dots represent the mean (n = 3, technical replicates). Source data are provided as a Source Data file. Source data
Extended Data Fig. 6
Extended Data Fig. 6. mtDNA on and off-target editing by the lead MitoKO DdCBE pairs following fine-tuned expression.
a. On-target performance of the Nd3, Cytb, CoII and Atp6 MitoKO constructs transiently delivered into NIH/3T3 cells, as separate monomers (2-plasmid), separate monomers with the hammerhead ribozyme (HHR) incorporated in mRNA (2-plasmid-HHR), bi-cistronic construct, with the tandemly arrayed DdCBE monomers linked by the T2A element (Tandem) and the tandem, T2A-linked monomers harboring HHR (Tandem-HHR). Bars represent the mean and error bars represent ± SEM (n = 3, biological replicates). Source data are provided as a Source Data file. b. Mitochondrial genome-wide off-targeting the Nd3, Cytb, CoII and Atp6 MitoKO constructs measured by NGS and presented fold change over wild-type (WT) controls. Bars represent the mean and error bars represent ± SEM (n = 3, biological replicates). Source data are provided as a Source Data file. Source data
Extended Data Fig. 7
Extended Data Fig. 7. Nuclear DNA off-target analysis by the Atp6 MitoKO DdCBE pair.
a. Number of SNVs identified in chromosomes 15 to 19, where T:A nucleotides are identified in C:G positions in cells transfected with the 2-plasmid version of the Atp6 MitoKO constructs, as compared to WT cells, and the proportion of SNVs found in a 5´-TC-3´context or non 5´-TC-3´ context. b,c. NGS analysis of the proportion of T:A identified in C:G loci at single positions of chromosomes 15 to 19 that are in a (b) 5´-TC-3´ or (c) 5´-TCC-3´ context. Cells were transiently transfected (7 days) with the 2-plasmid or tandem architecture of the Atp6 MitoKO constructs and compared with WT controls. Bars represent the mean and error bars represent ± SEM (n = 3 for WT and 2-plasmid, n = 2 for Tandem, biological replicates). Ordinary two-way ANOVA with Tukeys´s test: * P-value < 0.05; ** P-value < 0.01. Source data are provided as a Source Data file. Source data

Comment in

References

    1. Gorman GS, et al. Prevalence of nuclear and mitochondrial DNA mutations related to adult mitochondrial disease. Ann. Neurol. 2015;77:753–759. doi: 10.1002/ana.24362. - DOI - PMC - PubMed
    1. Yonova-Doing E, et al. An atlas of mitochondrial DNA genotype-phenotype associations in the UK Biobank. Nat. Genet. 2021;53:982–993. doi: 10.1038/s41588-021-00868-1. - DOI - PMC - PubMed
    1. Russell OM, Gorman GS, Lightowlers RN, Turnbull DM. Mitochondrial diseases: hope for the future. Cell. 2020;181:168–188. doi: 10.1016/j.cell.2020.02.051. - DOI - PubMed
    1. Silva-Pinheiro P, Minczuk M. The potential of mitochondrial genome engineering. Nat. Rev. Genet. 2022;23:199–214. doi: 10.1038/s41576-021-00432-x. - DOI - PubMed
    1. Stewart JB. Current progress with mammalian models of mitochondrial DNA disease. J. Inherit. Metab. Dis. 2021;44:325–342. doi: 10.1002/jimd.12324. - DOI - PubMed

Publication types

Substances