Clinical Trial
. 2022 Dec;28(12):2601-2610.
doi: 10.1038/s41591-022-02084-8. Epub 2022 Dec 5.

Whole-body CD8+ T cell visualization before and during cancer immunotherapy: a phase 1/2 trial

Affiliations
Clinical Trial

Whole-body CD8+ T cell visualization before and during cancer immunotherapy: a phase 1/2 trial

Laura Kist de Ruijter et al. Nat Med. 2022 Dec.

Abstract

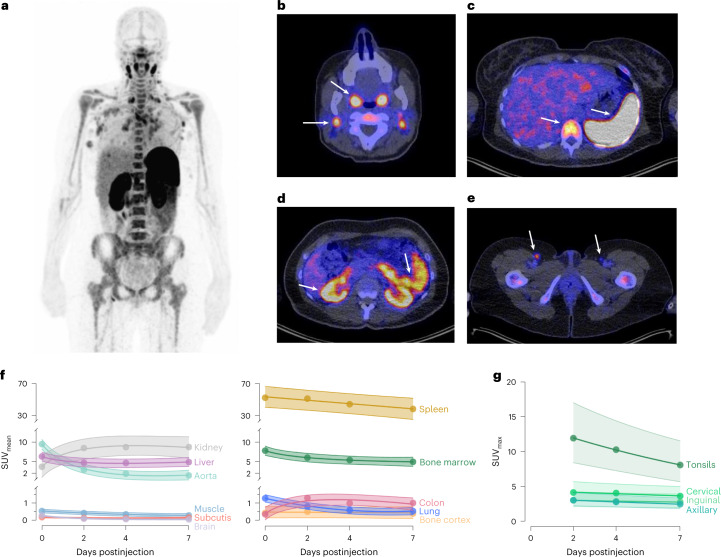
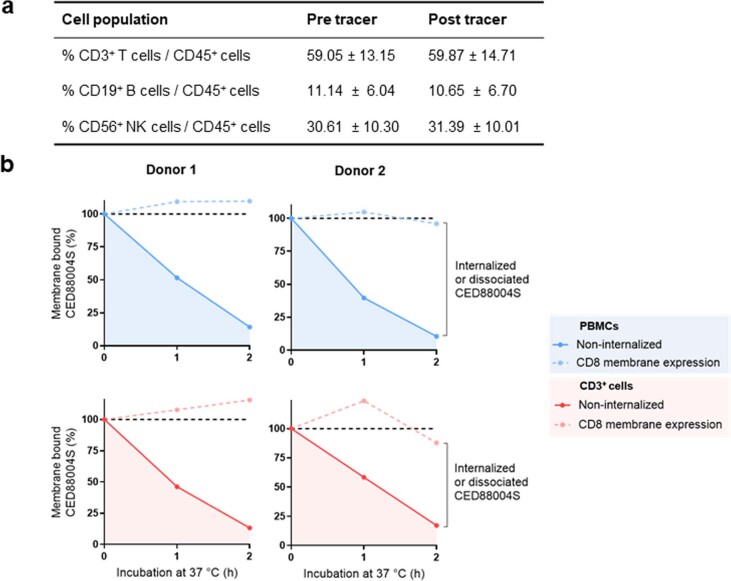
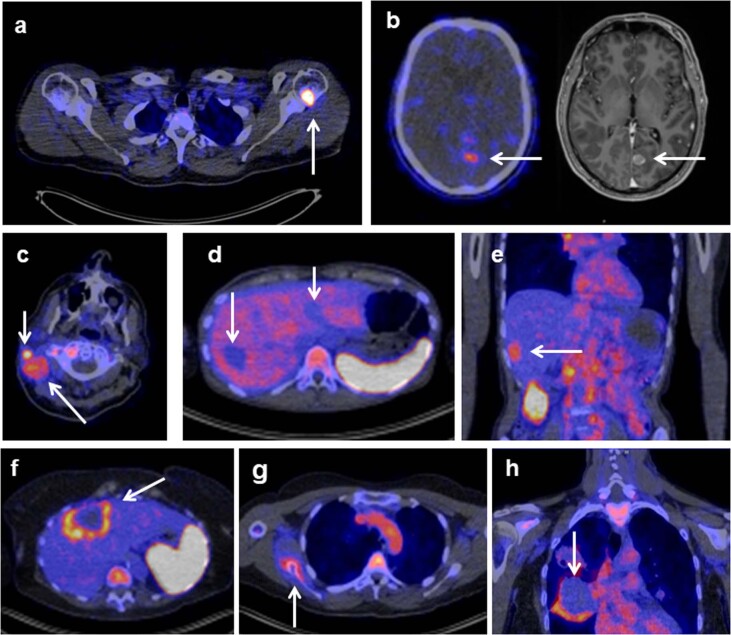
Immune checkpoint inhibitors (ICIs), by reinvigorating CD8+ T cell mediated immunity, have revolutionized cancer therapy. Yet, the systemic CD8+ T cell distribution, a potential biomarker of ICI response, remains poorly characterized. We assessed safety, imaging dose and timing, pharmacokinetics and immunogenicity of zirconium-89-labeled, CD8-specific, one-armed antibody positron emission tomography tracer 89ZED88082A in patients with solid tumors before and ~30 days after starting ICI therapy (NCT04029181). No tracer-related side effects occurred. Positron emission tomography imaging with 10 mg antibody revealed 89ZED88082A uptake in normal lymphoid tissues, and tumor lesions across the body varying within and between patients two days after tracer injection (n = 38, median patient maximum standard uptake value (SUVmax) 5.2, IQI 4.0-7.4). Higher SUVmax was associated with mismatch repair deficiency and longer overall survival. Uptake was higher in lesions with stromal/inflamed than desert immunophenotype. Tissue radioactivity was localized to areas with immunohistochemically confirmed CD8 expression. Re-imaging patients on treatment showed no change in average (geometric mean) tumor tracer uptake compared to baseline, but individual lesions showed diverse changes independent of tumor response. The imaging data suggest enormous heterogeneity in CD8+ T cell distribution and pharmacodynamics within and between patients. In conclusion, 89ZED88082A can characterize the complex dynamics of CD8+ T cells in the context of ICIs, and may inform immunotherapeutic treatments.


Conflict of interest statement

E.G.E.V. reports funding paid to the institution for clinical trials or contracted research from Amgen, AstraZeneca, Bayer, CytomX, Crescendo Biologics, G1 Therapeutics, GE Healthcare, Genentech, Regeneron, Roche, Servier, Synthon; fees paid to the institution for membership of the advisory board from Daiichi Sankyo, NSABP and Crescendo Biologics. S.F.O. reports research grants from Novartis, Celldex Therapeutics paid to the institution. W.T. reports fees paid to the institution for membership advisory boards from Merck Sharp Dohme and Bristol-Myers-Squibb. M.J. reports fees paid to the institution for membership of the advisory board from BMS, Merck, Novartis, Sanofi, AstraZeneca. J.A.G. reports research grants from Roche, AbbVie, Siemens, paid to the institution. S.M.S.B., M.Y., H.K., J.J., S.G., M.T.L., M.J.M., J.R.E., P.K.K., S.P.W. and A.U. are employees of Genentech Inc., member of the Roche group; M.Y., S.G., M.J.M., S.P.W. and A.U. are also stockholders of Genentech, Inc/Roche. B.M.F. was employee of Genentech, Inc. and stockholder of Roche at time of work described; currently employee and stockholder of Gilead Sciences, Inc. The other authors declare no competing interests.

Figures

Fig. 1
Fig. 1. Normal tissue biodistribution of 89ZED88082A.
a, Representative 89ZED88082A PET scan maximum intensity projection day 2. A whole-body visualization is available as Supplementary Video. b–e, Axial views of the same scan fused with low-dose CT. Arrows indicate uptake in Waldeyer’s ring, cervical lymph nodes (b), spleen, bone marrow (c), renal cortex, small intestine (d) and inguinal lymph nodes (e). f,g Pretreatment uptake with 95% confidence bands across tissues adjusted for protein dose, projected at 10 mg dose (n = 9), days 0 (1 h), 2, 4 and 7 (±1 day), with mean SUVmean (f) and mean SUVmax (g) for lymph nodes and tonsils, not visible on day 0.
Fig. 2
Fig. 2. 89ZED88082A uptake in nonirradiated tumor lesions.
a, Pretreatment uptake in 266 lesions day 2 after tracer injection, ordered by increasing geometric mean SUVmax per patient, visualizing lesion size and site, and aorta background uptake. ∅, diameter. μ, mean. b, Axial views PET/CT scans, arrows indicate lesions. (i) High, heterogeneous uptake in dMMR duodenal tumor. (ii) Uptake in a triple-negative right breast cancer lesion, moderate uptake in pleural and no to minor uptake in lung lesions. (iii) Minor uptake in perivesical dMMR urothelial cell cancer lesion pretreatment increased with rim pattern during treatment (iv). c, Violin plot SUVmax in lesions (n = 212) per site (lymph nodes n = 99, liver n = 35, bone n = 17, lung n = 42, skin n = 19). d, Violin plot of SUVmax in patients with pMMR (n = 25) and dMMR tumors (n = 9). e, Violin plot of SUVmax in lesions with desert (n = 15) and nondesert (n = 19) immune phenotype before and during treatment in 24 patients. c–e, Violin plots with bottom and top 1% of SUVmax values truncated (c and d, not for e); colored dots are the geometric means per patient (d) or lesion (e); black vertical lines are geometric mean SUVmax 95% CI; white dots within black lines and values below the violin plot the actual geometric means. Two-sided nominal P values were derived from linear mixed models taking clustering within patients (and, if applicable, lesions) into account, using a Wald test under restricted maximum likelihood for three of higher-level factors (c) or a likelihood ratio test under maximum likelihood for two-level factors (d,e). SqCC, squamous cell carcinoma; OCCC, ovarian clear cell carcinoma; HCC, hepatocellular carcinoma; UP, unknown primary.
Fig. 3
Fig. 3. 89ZED88082A in tumor tissues related to CD8 by IHC.
a, Autoradiography image of 89ZED88082A uptake in a dMMR colorectal cancer liver metastasis and accompanying CD8 IHC staining. Areas 1, 3 and 5 with moderate to high CD8 expression; 2 and 4 without CD8 expression. The representative image is shown with evident correlation between IHC CD8 expression and autoradiography signal (n = 16). b, Overview of SUVmax and CD8 IHC expression pattern (density score) in lesions with corresponding paired biopsy samples before and during treatment in ten patients. On the x axis, primary tumor type and location of biopsy are shown. The symbol above the bar indicates the radiographic response of the lesion at six weeks. LN, lymph node. Source data
Fig. 4
Fig. 4. 89ZED88082A uptake related to tumor response.
a,b, PFS (a) and OS (b), according to baseline geometric mean SUVmax below and above median, and with two-sided nominal P values derived from a log-rank test. c, Changes during repeated imaging in tumor uptake and anatomic size, expressed as estimated changes per week treatment to account for variation between patients in the timing of the PET scan/CT response evaluation. Patients (n = 19) are represented by two bars (blue and pink) and grouped per best overall treatment response. Blue bars, change in sum target lesions according to RECIST between pretreatment and first response evaluation. Pink bars, average SUVmax change. Dots are individual lesions (n = 111). Individual lesion datapoints for size (blue) and uptake (red) are connected by gray lines. Blue dots, lesion blueness, RECIST diameter pretreatment. Dot location, change in size versus baseline. Red dots, lesion redness, SUVmax pretreatment. Dot location, SUVmax change.
Extended Data Fig. 1
Extended Data Fig. 1. Biodistribution of 89ZED88082A in normal tissues.
a, Biodistribution per protein dose cohort pretreatment. Graphs show the average SUVmean with 95% confidence bands of 89ZED88082A in the blood pool and normal tissues at days 0 (1 h), 2, 4, and 7. Colours reflect the dose cohorts with 4 mg in blue (n = 3) and 10 mg in red (n = 6). Note the different scales of the y-axis. b, Table showing average changes in tracer uptake values between pre- and ontreatment PET scans, projected at 4 weeks. Pinteraction is shown for the correlation between change and best overall response (PD vs. SD/PR/CR). ND = not determined.
Extended Data Fig. 2
Extended Data Fig. 2. 89ZED88082A biodistribution in time.
a, Whole-body maximum intensity projection (MIP) images of a patient with cervical cancer show biodistribution of 89ZED88082A over time at 10 mg tracer dose. Orange arrows indicated lung metastases; blue arrows indicate uptake in hilar lymph nodes. b, 89ZED88082A tumor uptake pretreatment projected at 10 mg tracer dose as geometric mean SUVmax (line and dots) with 95% confidence bands for all nine patients in part A (lesions n = 70).
Extended Data Fig. 3
Extended Data Fig. 3. 89ZED88082A/CED88004S effects in PBMCs.
a, Table shows no difference in mean ± SD for T cell, B cell, and NK cell counts in blood samples from patients before (day 0) and post-tracer injection (day 2), at baseline before the start of ICI. b, CED88004S internalization experiments in PBMCs of healthy donors. CED88004S binding to CD8 and subsequent internalization was determined by flow cytometry in unstimulated PBMCs from healthy blood donor buffy coat. Membrane-bound CED88004S was detected using an anti-human allophycocyanin-IgG F(ab′)2 fragment. CD8 membrane levels before incubation (T = 0 h) were set at 100%. Blue: Internalization in total PBMC population, Red: Internalization in CD3 positive cells. CD8-bound CED88004S on the cell surface decreased during incubation at 37 °C (solid line), while membrane levels remained stable (dashed line).
Extended Data Fig. 4
Extended Data Fig. 4. PET image examples of uptake in tumor lesions.
a, Bone metastasis with high tracer uptake (SUVmax 18.9) in a patient with melanoma. b, Uptake in a brain metastasis (SUVmax 1.6) of a patient with melanoma with corresponding MRI, whereas healthy brain showed low uptake with SUVmean 0.1. c, High uptake in multiple cervical lymph node metastases in a patient with cutaneous squamous cell carcinoma. d, Multiple liver metastases in a patient with ovarian clear cell carcinoma without 89ZED88082A uptake. e, Uptake in a liver metastasis in a patient with squamous cell oesophageal cancer. f-h, Several metastases with high rim uptake: f, Liver metastases in a patient with dMMR colorectal cancer. g, Bone lesion in a patient with squamous cell vulvar cancer. h, Lung metastasis in a patient with cervical cancer.
Extended Data Fig. 5
Extended Data Fig. 5. Tumor tissue IHC analyses and correlation with tracer signal.
a, Representative examples of IHC CD8 expression phenotypes (n = 34): i, Liver biopsy of a cholangiocarcinoma metastasis with a desert phenotype. ii, A biopsy of a perivesical tumor mass of dMMR urothelial cell cancer with stromal CD8 expression phenotype [density 2]. iii, A liver biopsy of dMMR colon carcinoma shows an inflamed phenotype [density 3]. b, Correlation of mean CD8 staining pixel positivity and autoradiography signal across 16 samples with weighted quantile regression fit. Point sizes and regression weights are proportional to the size of each sample biopsy. c, Using tile-based analysis, the correlation across and within samples of mean CD8 staining pixel positivity and autoradiography signal at subsample level. Cross-sample correlations and corresponding 95% confidence intervals are displayed with horizontal and vertical lines at each tile size. Within-sample correlations are presented at each tile size for each sample as circles. At each tile size, only samples with ≥ 6 tiles are shown. Tiles containing less than < 25% tissue were excluded. Only cross-sample correlations are shown at tiles sizes higher than 5000px2 as no single sample had >5 tiles. d, Tiles of varying sizes are shown for a single representative clear cell ovarian cancer sample. e, Violin plot of tumor SUVmax-to-muscle SUVmean ratio with desert (n = 15) and non-desert (n = 19) immune phenotype before and during treatment in 24 patients. f, Violin plot of SUVmax in lesions with desert (n = 15), stromal (n = 15) and inflamed (n = 4) immune phenotype before and during treatment in 24 patients. e-f, Coloured dots show individual lesions; black vertical lines show 95% CI of the geometric mean; white dots within black lines and values below the violin plot the actual geometric means. Two-sided nominal P-values were derived from linear mixed models taking clustering within patients into account, either using a likelihood ratio test under maximum likelihood (e; Ptrend in f) or using a Wald test under restricted maximum likelihood (P-values for factor levels in f).
Extended Data Fig. 6
Extended Data Fig. 6. 89ZED88082A tumor uptake in relation to response.
a, Relationship between pretreatment 89ZED88082A uptake and best overall response; red dots show geometric mean SUVmax per patient. Violin plot areas show actual distribution of SUVmax at the metastasis level per category, white dots and values below the violin plot show geometric means, black vertical lines show 95% CIs of geometric mean SUVmax (PD: 149 lesions in 19 patients; SD: 6 lesions in two patients, PR: 41 lesions in eight patients; CR: 36 lesions in four patients). b, Relationship between pretreatment 89ZED88082A uptake in patients with progressive disease and those that did not progress. c, Relationship between pretreatment 89ZED88082A uptake in patients with progressive disease and those with PR or CR, excluding SD. a-c, Two-sided nominal P-values were derived from linear mixed models taking clustering within patients into account, using a Wald test under restricted maximum likelihood for three or higher-level factors or a likelihood ratio test under maximum likelihood for two-level factors and for the trend test. d-e, Changes in tumor lesion SUVmax between the pre- and on-treatment PET scans. Patients are grouped per best overall response (PD, or no-PD). Violin plots show actual distribution of individual lesions. Baseline (BL) to response scan 1 (RS1, on-treatment) trajectories of individual lesions are shown with grey lines, projected at 30 days, when PET scan was regularly performed; red lines and dots (geometric means) present per-patient aggregated data; white dots are the overall geometric means with black 95% CI bars. Two-sided nominal P-values were derived from linear mixed models taking clustering within patients and lesions into account, using a Wald test under restricted maximum likelihood. d, Compared to pre-treatment, patients with SD, PR, or CR show a lowered uptake on the on-treatment PET scan than those with PD (Pinteraction = 0.018). e, Same change in SUVmax, projected at 5 cm3 tumour volume to adjust for volume changes (Pinteraction = 0.71).
Extended Data Fig. 7
Extended Data Fig. 7. PET image examples of uptake in non-malignant sites.
Axial (a-d, i), coronal (e, f), and sagittal (g, h) views of 89ZED88082A PET scans with low dose CT. a, High uptake in urinary bladder diverticulum with urolithiasis and accompanying inflammation. b, Uptake in an aortic atherosclerotic plaque, also detectable on non-attenuated corrected images (data not shown). c, Uptake post-surgery in a patient after inguinal lymph node dissection with a seroma. d, Bilateral uptake in subcutaneous inflammation reaction on heparin injections. e, Hashimoto’s thyroiditis with high uptake before treatment and f, Increased uptake during treatment experiencing a flare-up. g-h, Two patients who received radiotherapy to the spine; arrows indicate the border of the radiation field; the insert shows the radiation field. The irradiated bone marrow in the spine, shows less uptake than non-irradiated bone marrow. g, Patient who received 5×4 Gy to the spine for painful bone metastases 3 months before 89ZED88082A PET scan. h, Patient who received 25×1.8 Gy on para-aortal lymph nodes alongside the spine 12 months before the 89ZED88082A PET scan. i, Uptake of tracer in normal appendix on PET (right), with corresponding diagnostic CT (left).
Extended Data Fig. 8
Extended Data Fig. 8. 89ZED880082A/CED88004S pharmacokinetics and integrity.
a, b, Time-concentration profiles (mean ± standard deviation) of 89ZED88082A/CED88004S serum protein and radioactivity following a single IV infusion of a, 4 mg (n = 3) and b, 10 mg (n = 6). c, Time-concentration profile (mean ± standard deviation) of 89ZED88082A/CED88004S pretreatment and during treatment in the presence of immune checkpoint inhibitor antibodies. d, Representative integrity assay (SDS-PAGE combined with autoradiography) of 89ZED880082A in urine and serum in samples drawn after 30 min and 2, 4, and 7 days after tracer injection (n = 3). Source data

References

    1. Hodi FS, et al. Nivolumab plus ipilimumab or nivolumab alone versus ipilimumab alone in advanced melanoma (CheckMate 067): 4-year outcomes of a multicentre, randomised, phase 3 trial. Lancet Oncol. 2018;19:1480–1492. doi: 10.1016/S1470-2045(18)30700-9. - DOI - PubMed
    1. Vaddepally RK, et al. Review of indications of FDA-approved immune checkpoint inhibitors per NCCN guidelines with the level of evidence. Cancers. 2020;12:738. doi: 10.3390/cancers12030738. - DOI - PMC - PubMed
    1. Chang E, et al. Systematic review of PD-1/PD-L1 inhibitors in oncology: from personalized medicine to public health. Oncologist. 2021;26:e1786–e1799. doi: 10.1002/onco.13887. - DOI - PMC - PubMed
    1. Havel JJ, Chowell D, Chan TA. The evolving landscape of biomarkers for checkpoint inhibitor immunotherapy. Nat. Rev. Cancer. 2019;19:133–150. doi: 10.1038/s41568-019-0116-x. - DOI - PMC - PubMed
    1. Herbst RS, et al. Predictive correlates of response to the anti-PD-L1 antibody MPDL3280A in cancer patients. Nature. 2014;515:563–567. doi: 10.1038/nature14011. - DOI - PMC - PubMed

Publication types

Substances

Associated data