. 2022 Dec;29(12):1178-1187.
doi: 10.1038/s41594-022-00877-6. Epub 2022 Dec 5.

Deciphering the mechanical code of the genome and epigenome

Affiliations

Deciphering the mechanical code of the genome and epigenome

Aakash Basu et al. Nat Struct Mol Biol. 2022 Dec.

Abstract

Diverse DNA-deforming processes are impacted by the local mechanical and structural properties of DNA, which in turn depend on local sequence and epigenetic modifications. Deciphering this mechanical code (that is, this dependence) has been challenging due to the lack of high-throughput experimental methods. Here we present a comprehensive characterization of the mechanical code. Utilizing high-throughput measurements of DNA bendability via loop-seq, we quantitatively established how the occurrence and spatial distribution of dinucleotides, tetranucleotides and methylated CpG impact DNA bendability. We used our measurements to develop a physical model for the sequence and methylation dependence of DNA bendability. We validated the model by performing loop-seq on mouse genomic sequences around transcription start sites and CTCF-binding sites. We applied our model to test the predictions of all-atom molecular dynamics simulations and to demonstrate that sequence and epigenetic modifications can mechanically encode regulatory information in diverse contexts.


Conflict of interest statement

Competing Interests:

The authors declare no competing interests.

Figures

Figure 1:
Figure 1:
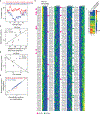
(a) The ordinate depicts mean intrinsic cyclizabilities of sequences in the random library (blue) and in the methylated random library (red) that have at least the number of CpGs as specified by the abscissa. Intrinsic cyclizability values of the methylated random library have been adjusted to allow for comparison with those of the random library (Supplementary Note 2). For each color, from left to right, N = 12,472, 12,036, 10,451, 7,620, 4,516, 2,147, 864, 282. Error bars are s.e.m. (b) Mean intrinsic cyclizability of sequences in the random library as a function of G/C content. Mean is calculated only over those sequences in the random library whose G/C content is as specified by the abscissa. Error bars are s.e.m. From left to right, N = 30, 77, 110, 214, 324, 500, 746, 984, 1239, 1353, 1403, 1316, 1210, 982, 749, 487, 307, 201, 120, 53, 27. (c) The 12,472 sequences in the random library were sorted according to increasing intrinsic cyclizability and grouped into 12 bins with 1,039 sequences each. 4 remaining sequences were ignored. Within each bin, the normalized number of times each of the 16 dinucleotides occur is color coded and depicted (see supplementary note 3). (d) Bendability quotient for a dinucleotide is defined as the slope of the linear fit to the plot of the normalized number of times it occurs among sequences in each of the 12 bins in panel c, vs the mean intrinsic cyclizability of sequences in the 12 bins (supplementary note 3) (e) Pairwise distance distribution functions vs separation distance, averaged over the 1,000 sequences in the random library that have the most (red) or least (blue) values of intrinsic cyclizability, for four different NN-NN pairs. See Supplementary Note 5 for plotting details. (f) For a given NN-NN dinucleotide pair, the best fit linear relationship between its helical separation extent in a sequence and the intrinsic cyclizability of that sequence, for all sequences in the random library, was obtained. The heatmap here depicts the slopes of these linear relationships for all 136 NN-NN pairs. See Supplementary Note 6 for details. (g) Nucleosome occupancy and various sequence parameters as functions of position from the dyad of the +1 nucleosome, averaged over all identified 4,904 genes in S. cerevisiae (see supplementary note 8 for plotting details). To calculate rigidσNNNN, the ten NN-NN pairs that make the most negative contribution to intrinsic cyclizability were identified (supplementary note 8). The sum of the helical separation extents of these pairs over a 50 bp DNA fragment centered around the ordinate value was calculated for each gene. The values were averaged to obtain the abscissa value. flexibleσNNNN was similarly calculated. See supplementary note 8 for heatmaps of TpA and CpG contents.
Figure 2:
Figure 2:
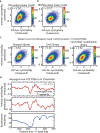
(a) Mean propeller twist as a function of position averaged over N = 1,000 50 bp DNA sequences in the random library that had the most (red) and least (blue) values of intrinsic cyclizability. Sequences were tiled as a series of pentamers and the associated propeller twist of the central base in the pentamer was assigned on the basis of earlier reports. Error bars are s.e.m. (b) The 12,472 sequences in the random library were sorted according to increasing intrinsic cyclizability and grouped into 12 bins with 1,039 sequences each. 4 remaining sequences were ignored. Within each bin, the normalized number of times each of the 256 tetranucleotides occur is color coded and depicted (Supplementary Note 10). Tetranucleotides containing a CG in the middle (ie of the form NCGN) are indicated by a magenta circle, while those containing a TA in the middle are indicated by a green circle. (c) Bendability quotients of all 16 NCGN tetranucleotides as obtained from loop-seq of the random library (see Supplementary Note 10) vs the weighted average of the high-twist and low-twist conformations that the central CG step samples, as obtained from MD simulations. Pearson’s r value is shown. 95% confidence interval (CI) = 0.33, 0.89. P value determined by t-test (two-sided). (d) Bendability quotients of all 16 NCGN tetranucleotides vs roll energy. Roll energy is the energy penalty associated with the tetranucleotide having to deviate from its equilibrium roll angle when adopting a constrained conformation after looping, i.e., the tetranucleotide being part of a circle of circumference 110 bp (Supplementary Note 11). Pearson’s r value is shown. 95% confidence interval (CI) = −0.57, −0.94. P value determined by t-test (two-sided). (e) Bendability quotients for all 256 NNNNs obtained from the measured values of intrinsic cyclizability of the 12,472 sequences in the random library vs those obtained from the measured values of intrinsic cyclizability of the sequences in the methylated random library (which contain the identical set of 12,472 sequences, except all occurring CpG are cytosine methylated). Dashed line represents x=y. NNNNs are marked in red if at least one CG occurs in it (such as ACGA, CGCG, CGAC, etc). Other NNNNs (such as AAGC, GGGC, etc) are marked in blue. (f) Heatmap representing the contributions of all NN-CG dinucleotide pairs towards intrinsic cyclizability, obtained by considering the intrinsic cyclizability values of sequences in the random library (first column, identical to the 15th column in figure 1f except for the color scale), and obtained from measurements on the methylated random library (second column). Contribution towards intrinsic cyclizability of a NN-CG pair is calculated as done in the case of figure 1f.
Figure 3:
Figure 3:
(a) 2-D histogram of the scatter plot between measured intrinsic cyclizabilities of sequences in the random library and the associated predicted intrinsic cyclizability. Here, prediction was made via a model where intrinsic cyclizability of a 50 bp sequence is a linear combination of the number of times each of the 16 dinucleotides occur in the sequence and a constant term (supplementary note 13). Best fit coefficients of the linear model were derived by training the model using the measured intrinsic cyclizability values of sequences in the tiling library (Supplementary Note 1). Pearson’s r value is shown. 95% confidence interval (CI) = 0.34, 0.37. P = 0.0000 (determined by two-sided t-test). (b) Same as panel a, except that prediction was made using a linear model where intrinsic cyclizability of a 50 bp sequence is a linear combination of the 136 helical separation extent values in the sequence of the 136 NN-NN pairs, and a constant term (supplementary note 13). Pearson’s r value is shown. 95% confidence interval (CI) = 0.36, 0.39. P = 0.0000 (determined by two-sided t-test). (c) 2-D histogram of the scatter plots between measured and predicted intrinsic cyclizability values of sequences in the random, chrV, and cerevisiae nucleosomal libraries (Supplementary Note 1). Here, prediction was made using a model were intrinsic cyclizability of a 50 bp sequence is a linear combination of a constant term and the 16 dinucleotide contents (subject to the constraint that their sum = 49) and 136 helical separation extents that describe the sequence (supplementary note 13). Coefficients were derived by training the model against the tiling library. Pearson’s r values are shown. 95% confidence intervals (CIs) are (0.51, 0.53), (0.52, 0.55), and (0.52, 0.55). P = 0.0000 (determined by two-sided t-test) in all cases. (d) Measured intrinsic cyclizability, predicted intrinsic cyclizability, and nucleosome occupancy as functions of position from the dyad of the +1 nucleosome, averaged over 576 genes in S. cerevisiae. Mean occupancy values and positions were as reported earlier. Prediction was performed using the linear physical model trained using the measured intrinsic cyclizability values of the random library. See supplementary note 15 for details.
Figure 4:
Figure 4:
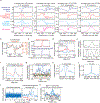
(a) Nucleosome occupancy, predicted intrinsic cyclizability in absence of CpG methylation, predicted intrinsic cyclizability in presence of CpG methylation, and G/C content, as a function of distance from the dyad of the +1 nucleosome (in the case of S. cerevisiae and S. pombe) or from the TSS (in the case of drosophila and mouse), averaged over a large number of genes in these four organisms. Nucleosome occupancy metrics were obtained from previous publications. See supplementary note 16 for details. (b) Measured intrinsic cyclizability as a function of position from the TSS, averaged over 629 mouse genes, in absence and presence of CpG methylation. See supplementary note 17 for details. (c) Top panel: Predicted intrinsic cyclizability (predicted by using the linear physical model trained against the random library) as a function of position from the start of the 20 bp CTCF consensus motif, averaged over 19,900 reported CTCF binding sites in mouse embryonic stem cells. Bottom panel: same as the top panel, except DNA outside the 20 bp concensus sequence motif was chosen at random and not obtained from the mouse genome. See Supplementary Note 18 for details. (d) Predicted intrinsic cyclizability as a function of position (where 0 is the start of the CTCF consensus motif), averaged over the two groups of 1,000 sites that have the highest (blue) and lowest (red) nucleosome Center Weighted Occupancy (CWO) at the CTCF motif. See supplementary note 19 for details. (e) Measured intrinsic cyclizability and nucleosome occupancy vs position from the edge of the CTCF motif, averaged over 433 randomly selected CTCF binding sites. See supplementary note 21 for details. Nucleosome occupancy is the nucleosome CWO. (f) Measured mean intrinsic cyclizability vs position from the edge of the CTCF motif, averaged over two sets of 433 CTCF binding sites that have the least and greatest mean nucleosome CWO at the CTCF motif. See supplementary note 21 for details. (g) Predicted intrinsic cyclizability as a function of position along the 923 bp Ω4 region of the C. elegans genome (blue), and along three more 923 bp DNA sequences obtained by randomizing the order of nucleotides that occur along the native Ω4 sequence (black, green, red). (h) Predicted intrinsic cyclizability as a function of distance from TSSs in S. cerevisiae. Data is averaged over all 11,102 annotated TSSs that were more than 500 bp away from chromosome edges. The red arrow points to a local peak in intrinsic cyclizability coinciding with the known location of the TATA box. The black arrow indicates the flexibility peak associated with the +1 nucleosome dyad, as reported earlier (i) Predicted intrinsic cyclizability as a function of distance from TSSs in E. coli. Data is averaged over 14,860 annotated TSSs. (j) Predicted intrinsic cyclizability along the 35 kb genome of the MU-like prophage FluMu found inserted within the H. influenza genome. Arrow points to the region of the gyrase cleavage site. Right panel: zoomed view of a 1 kb region around the strong gyrase binding site in the FluMu genome. The red dashed line corresponds to the gyrase cleavage site. The dashed grey lines demarcate 80 bp from the cleavage site. (k) Predicted intrinsic cyclizability as a function of position along the 220 bp DNA fragment encompassing the enhancer and promoter of the eight σ54-promoters on which earlier DNA cyclization experiments have been reported. In bold are the two promoters (K. pneumonia nifLA promoter and E. coli glnAp2 promoter) among the eight which lack an IHF binding site. Plotted on the x-axis is the position along the 220 bp fragment from the enhancer to the promoter.

Similar articles

Cited by

References

    1. Kim SH et al. DNA sequence encodes the position of DNA supercoils. Elife 7, e36557 (2018). - PMC - PubMed
    1. Morozov AV et al. Using DNA mechanics to predict in vitro nucleosome positions and formation energies. Nucleic acids research 37, 4707–4722 (2009). - PMC - PubMed
    1. Rohs R, Sklenar H & Shakked Z Structural and energetic origins of sequence-specific DNA bending: Monte Carlo simulations of papillomavirus E2-DNA binding sites. Structure 13, 1499–1509 (2005). - PubMed
    1. Chiu T-P et al. GBshape: a genome browser database for DNA shape annotations. Nucleic acids research 43, D103–D109 (2015). - PMC - PubMed
    1. Pasi M et al. μABC: a systematic microsecond molecular dynamics study of tetranucleotide sequence effects in B-DNA. Nucleic acids research 42, 12272–12283 (2014). - PMC - PubMed

Methods only references:

    1. Basu A in Methods in Enzymology Vol. 661 305–326 (Elsevier, 2021). - PubMed

Publication types