. 2022 Dec;54(12):1881-1894.
doi: 10.1038/s41588-022-01236-3. Epub 2022 Dec 5.

The landscape of tumor cell states and spatial organization in H3-K27M mutant diffuse midline glioma across age and location

Affiliations

The landscape of tumor cell states and spatial organization in H3-K27M mutant diffuse midline glioma across age and location

Ilon Liu et al. Nat Genet. 2022 Dec.

Abstract

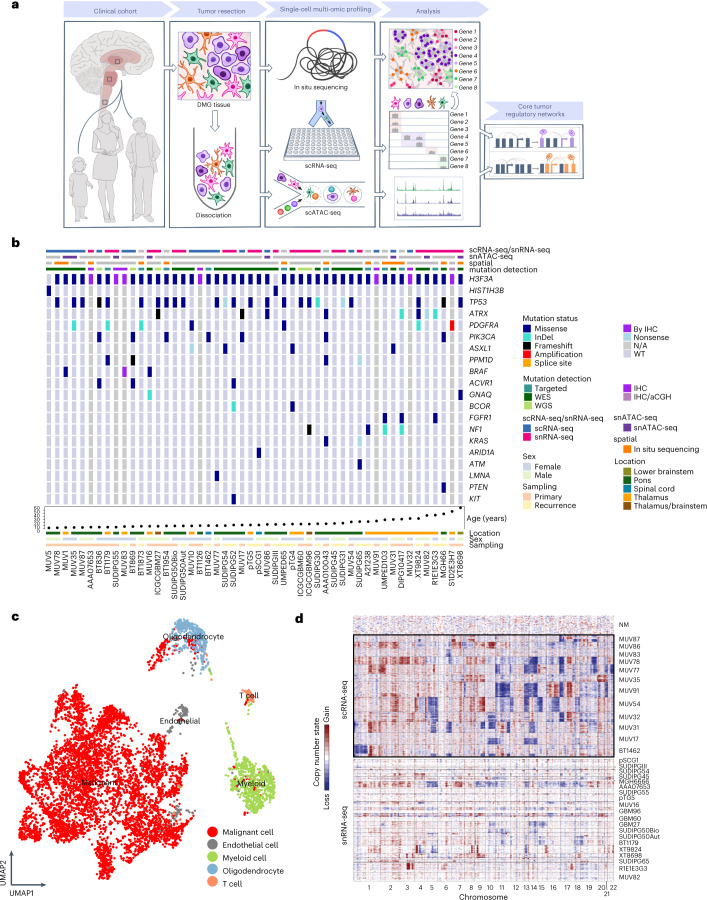
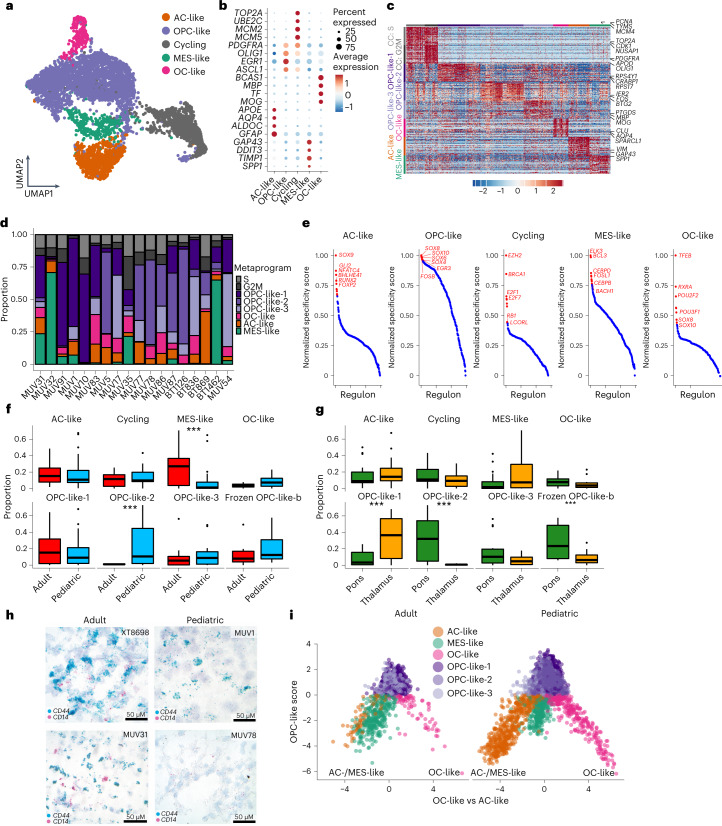
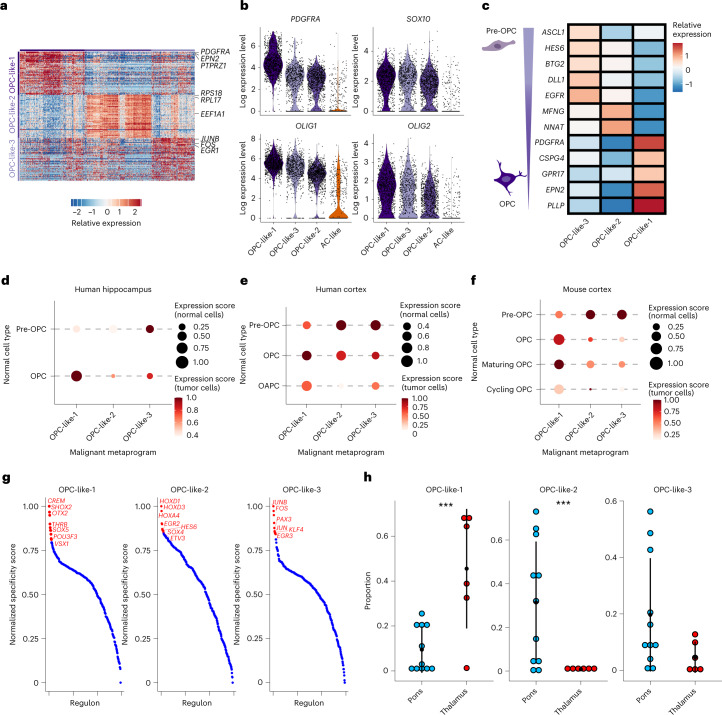
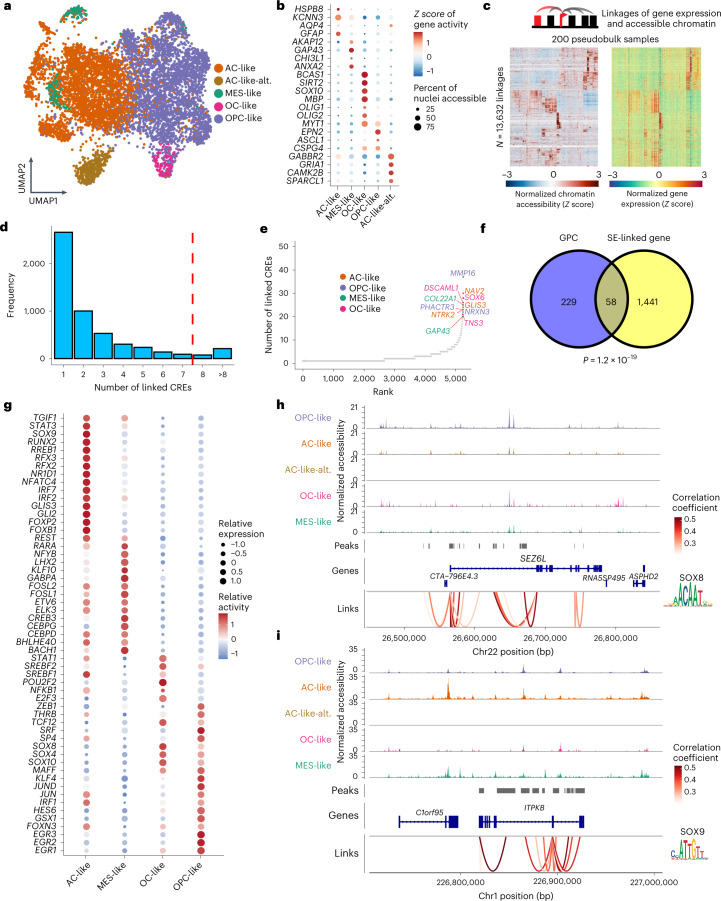
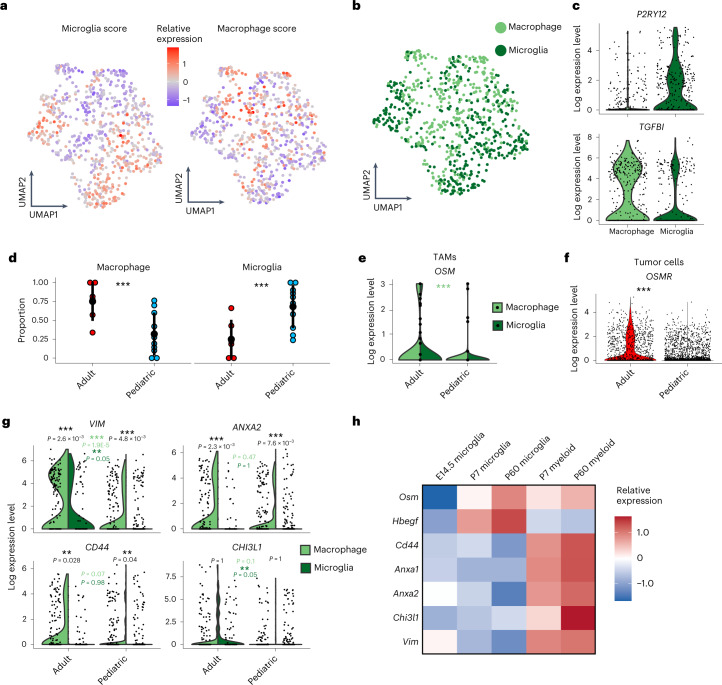
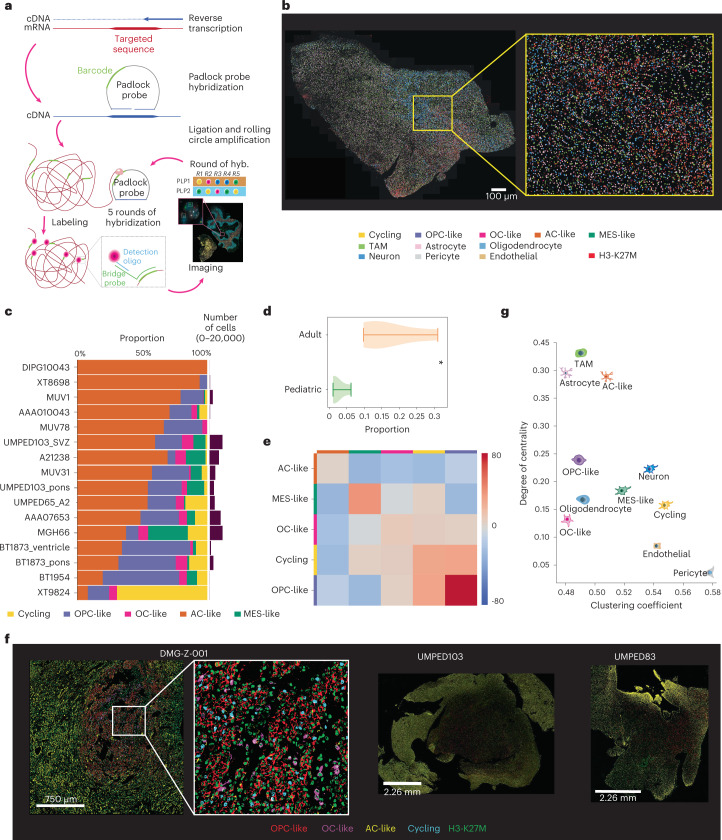
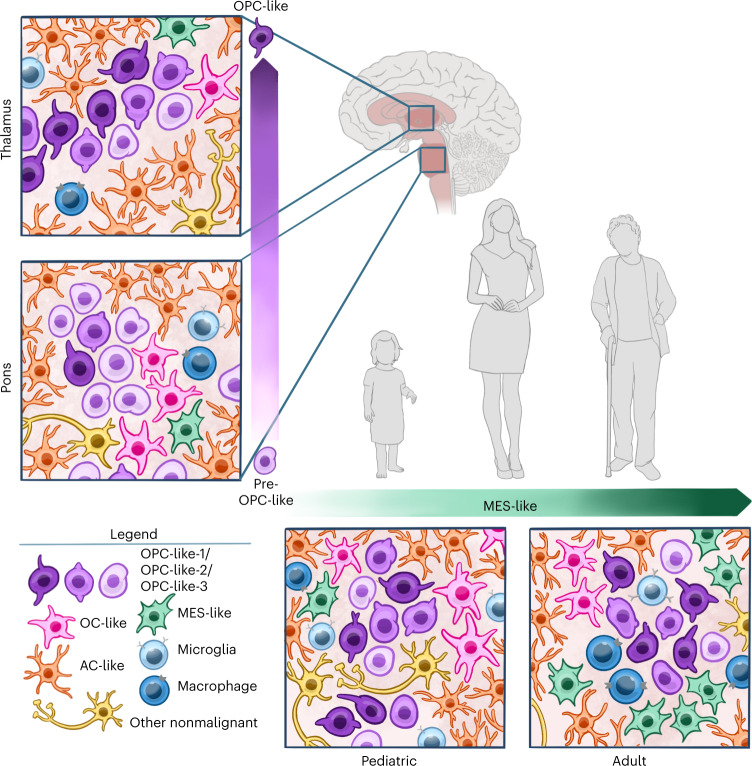
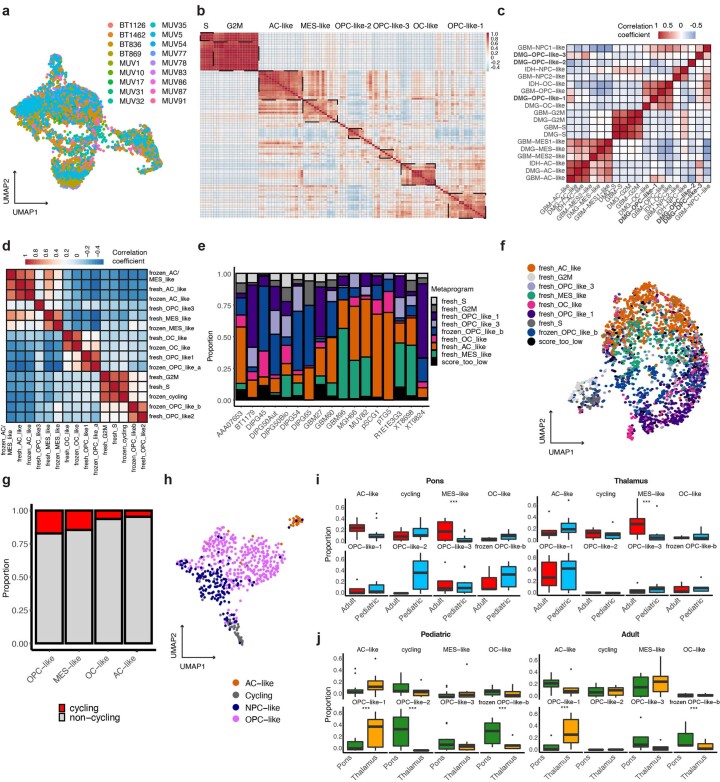
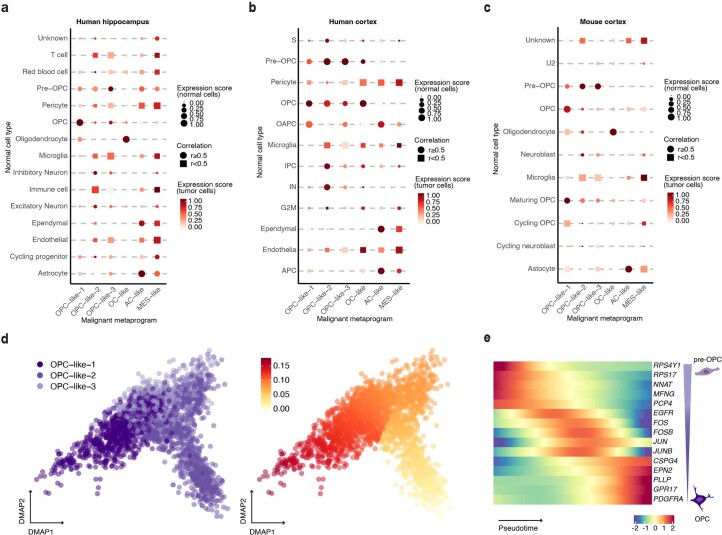
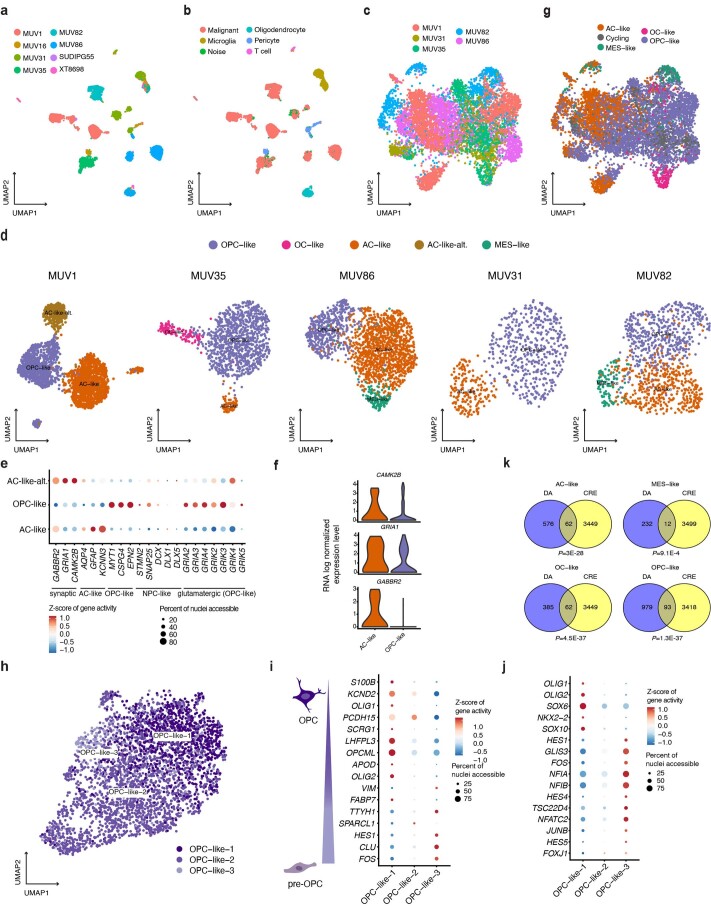
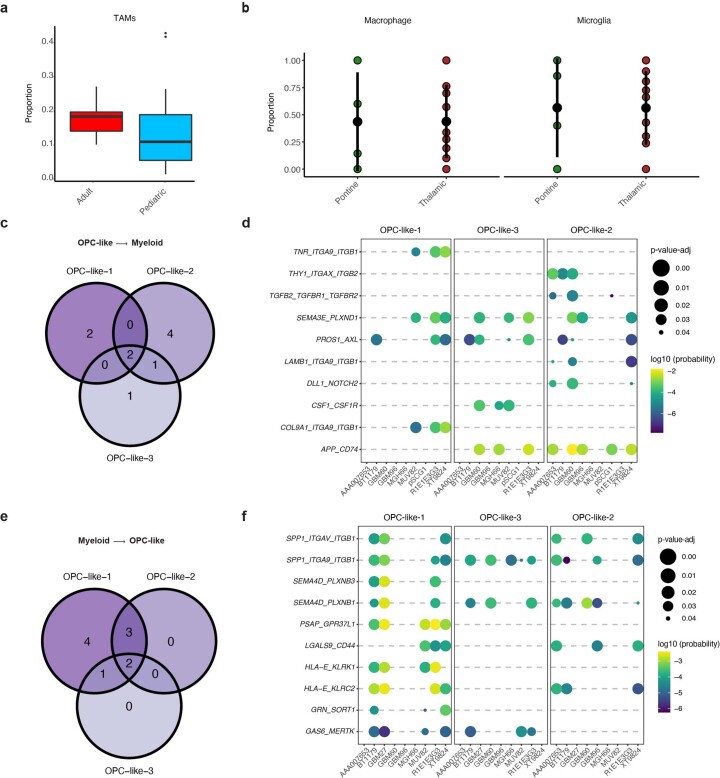
Histone 3 lysine27-to-methionine (H3-K27M) mutations most frequently occur in diffuse midline gliomas (DMGs) of the childhood pons but are also increasingly recognized in adults. Their potential heterogeneity at different ages and midline locations is vastly understudied. Here, through dissecting the single-cell transcriptomic, epigenomic and spatial architectures of a comprehensive cohort of patient H3-K27M DMGs, we delineate how age and anatomical location shape glioma cell-intrinsic and -extrinsic features in light of the shared driver mutation. We show that stem-like oligodendroglial precursor-like cells, present across all clinico-anatomical groups, display varying levels of maturation dependent on location. We reveal a previously underappreciated relationship between mesenchymal cancer cell states and age, linked to age-dependent differences in the immune microenvironment. Further, we resolve the spatial organization of H3-K27M DMG cell populations and identify a mitotic oligodendroglial-lineage niche. Collectively, our study provides a powerful framework for rational modeling and therapeutic interventions.


Conflict of interest statement

M.G.F. is a consultant for Twentyeight-Seven Therapeutics and Blueprint Medicines. M.N. is Scientific Advisor for 10X Genomics. M.M. is a SAB member for Cygnal Therapeutics. M.L. Suvà is an equity holder, scientific cofounder and advisory board member of Immunitas Therapeutics. K.L.L. is the founder and equity holder of Travera and receives consulting fees from BMS, Integragen, Rarecyte and research support from Lilly, BMS and Amgen. J.S. is now (but not when contributing to this manuscript) an employee of 10X Genomics. The remaining authors declare no competing interests.

Figures

Fig. 1
Fig. 1. H3-K27M DMG cohort profiled by single-cell multi-omics.
a, Schematic of the workflow. b, Clinico-molecular cohort characteristics. The upper legend bars depict the single-cell profiling method by scRNA-seq (n = 18)/snRNA-seq (n = 25), snATAC-seq (n = 8) and/or single-cell in situ sequencing (n = 14). The lower row specifies the method of genetic characterization. Most frequently detected and previously reported co-mutations are shown in the middle for 43 of 50 tumors profiled by whole or targeted exome sequencing. Clinico-anatomical characteristics are shown by the bottom legend bars. c, UMAP of all cells profiled by scRNA-seq/snRNA-seq. The color legend highlights malignant, types of nonmalignant cells detected based on clustering, copy number profiles and expression of canonical marker genes. For this visualization, scRNA-seq/snRNA-seq data were integrated by the Harmony algorithm, while downstream analyses were performed separately on scRNA-seq and snRNA-seq data to control for technical biases. d, Copy number alteration (CNA) profiles inferred from scRNA-seq/snRNA-seq data. Cells are ordered by their original tumors as rows and are clustered by their pattern of CNAs across chromosomal locations (columns). Representative fresh spike-in nonmalignant cells lacking CNAs are shown on top.
Fig. 2
Fig. 2. Intratumoral transcriptional heterogeneity of H3-K27M DMGs.
a, UMAP of all fresh tumor cells, highlighting identified clusters. b, Marker genes (y axis) of identified fresh tumor cell clusters, grouped and annotated on the x axis. Dot sizes represent the percentage of cells expressing the gene in the given cluster, and the color scale shows scaled average relative expression. c, Heatmap representing the relative expression (color bar) of the top 30 marker genes (rows) for the tumor metaprograms identified by NMF across all fresh tumor cells (columns). d, Proportions (y axis) of fresh tumor-derived NMF metaprograms (color legend) in tumor cells for each fresh sample (x axis). e, Cell type-specific TF regulatory networks (regulon, x axis) derived by SCENIC, plotted against their normalized specificity score (y axis). f, Boxplots representing relative frequencies of metaprograms in all fresh and frozen tumors in adult (n = 10) versus pediatric (n = 23) age groups. The median is marked by the thick line within the boxplot, the first and third quartiles by the upper and lower limits, and the 1.5 times interquartile range by the whiskers. Three asterisks denote credible statistical changes as assessed by a Bayesian scCODA model with FDR < 0.05 and without multiple test corrections. g, Boxplots representing relative frequencies of metaprograms in all fresh and frozen tumors grouped by pontine (n = 19) versus thalamic (n = 14) locations. The median is marked by the thick line within the boxplot, the first and third quartiles by the upper and lower limits, and the 1.5 times interquartile range by the whiskers. Three asterisks denote credible statistical changes as assessed by a Bayesian scCODA model with FDR < 0.05 and without multiple test corrections. h, RNA in situ hybridization for MES-like (CD44) and macrophage (CD14) markers in two adult and two pediatric H3-K27M DMGs. Two to three slides were stained for each sample with 10–15 fields of view taken per slide. i, Two-dimensional representations of the OC-like versus AC-like (x axis) and OPC-like (y axis) scores for adult and pediatric H3-K27M DMGs, respectively.
Fig. 3
Fig. 3. Region-specific states of OPC-like cells.
a, Heatmap representing the relative expression (color scale) of the top 30 marker genes (rows) for the different OPC metaprograms across all fresh tumor cells (columns). b, Violin plots depicting log normalized absolute expressions of canonical OPC marker genes in OPC-like-1, OPC-like-2 and OPC-like-3 subpopulations. Expressions in AC-like cells (orange) are shown for comparison. c, Heatmap representing the relative expression (color scale) of canonical pre-OPC and OPC marker genes (rows) in tumor OPC-like-3, OPC-like-2 and OPC-like-1 populations (columns). d, Projection of OPC-like-1, OPC-like-2 and OPC-like-3 populations (x axis) onto normal pre-OPC and OPC (y axis) from a scRNA-seq dataset of the human hippocampus. Color scale presents expression scores of normal cell signatures in tumor cells, while dot sizes depict expression scores of tumor cell signatures in normal cells. e, Projection of OPC-like-1, OPC-like-2 and OPC-like-3 populations (x axis) onto normal pre-OPC, OPC and OAPC (HOPX+SPARCL1+ glial progenitor cell) (y axis) from a scRNA-seq dataset of the human developing cortex. Color scale presents expression scores of normal cell signatures in tumor cells, while dot sizes depict expression scores of tumor cell signatures in normal cells. f, Projection of OPC-like-1, OPC-like-2 and OPC-like-3 populations (x axis) onto different normal OPCs of varying maturation stages (y axis) from a scRNA-seq dataset of the neonatal mouse cortex. Color scale presents expression scores of normal cell signatures in tumor cells, while dot sizes depict expression scores of tumor cell signatures in normal cells. g, TF regulatory networks (regulon, x axis) derived by SCENIC for each tumor OPC-like subpopulation, plotted against their normalized specificity score (y axis). h, Dotplots representing the distribution (mean ±2 × s.e.m.) of the proportions of different OPC-like tumor states across all fresh tumors grouped by pontine (n = 11) and thalamic (n = 6) locations. Three asterisks denote credible statistical changes as assessed by a Bayesian scCODA model, with FDR < 0.05 and without multiple test corrections.
Fig. 4
Fig. 4. Characteristic chromatin profiles of H3-K27M DMG cell populations.
a, UMAP of all snATAC-seq derived tumor nuclei after batch effect correction, highlighting de novo assigned clusters. b, Dotplot representation of top marker genes with differential gene activities (color scale) and proportion of nuclei accessible (dot size) within snATAC-seq derived cell states. c, Heatmap showing normalized chromatin accessibility and gene expressions of 13,632 substantially linked CRE-gene pairs (left rows, chromatin accessibility; right rows, linked gene expressions). Rows were clustered using hierarchical clustering. For visualization, 5,000 rows were randomly selected. d, Barplot representing distribution of numbers of linked CREs per gene. Red dashed line denotes the top 5% threshold of numbers of linked CREs that define GPC. e, Ranking of genes (x axis) by numbers of linked CREs (y axis) highlighting genes with top 20 linked CREs in color. Genes differentially expressed in a tumor cell state or identified as a cell state-specific TF regulon by SCENIC are colored according to the legend. f, Venn diagram representing overlap of GPCs with H3-K27M DMG super-enhancer associated genes, identified by Nagaraja et al.. P value of a two-sided hypergeometric test is shown. g, Dotplot of integrative TF analysis representing the top cell state (columns)-specific TFs (rows). Average relative expression level assessed by scRNA-seq is depicted by dot size, and relative activity inferred by SCENIC analysis is presented by color scale. h,i, Integrative representation of gene loci of the h, OPC-like cell-specific SEZ6L gene, and i, AC-like cell-specific ITPKB gene. At the top, pseudobulk chromatin accessibility track plots are shown colored by cell type. In the middle row, bars depict the locus of putative CREs. In the bottom row, loops denote the correlation between chromatin accessibility of each peak and expression of its linked gene, representing putative CREs that are enriched for the OPC-like cell-specific SOX8 (h), AC-like cell-specific SOX9 (i), TF motifs, respectively.
Fig. 5
Fig. 5. The myeloid cell landscape of H3-K27M DMGs.
a, UMAP of TAMs analyzed by scRNA-seq, color scaled by expression scores for microglia and macrophage gene sets. b, UMAP of TAMs colored by classification as macrophage or microglia cell type. c, Violin plot depicting log normalized expression levels of representative microglia and macrophage marker genes across TAMs scored as either microglia or macrophage. d, Dotplots representing the distribution (mean ± 2 × s.e.m.) of assigned macrophage versus microglia proportions across adult and pediatric tumors (N = 16 biologically independent samples). Three asterisks denote credible statistical changes determined by a Bayesian scCODA model with FDR < 0.05 and without multiple test corrections. e, Violin plots of log normalized expression levels of OSM gene in adult and pediatric TAMs. Three asterisks denote P = 0.003 (two-sided Kolmogorov–Smirnov test). Three asterisks in light green represent comparisons between adult and pediatric tumors for macrophages. f, Violin plots of log normalized expression levels of OSMR gene in adult and pediatric tumor cells. Three asterisks denote P = 0 (two-sided Kolmogorov–Smirnov test). g, Violin plots of log normalized expression levels of MES-like marker genes in adult and pediatric TAMs. P values from different comparisons are shown (two-sided Kolmogorov–Smirnov tests; black: within age-group comparisons between macrophages and microglia; light green: adult versus pediatric macrophages; dark green: adult versus pediatric microglia). h, Heatmap representation of scaled relative expressions (color scale) of MES-like state-associated ligands and marker genes (rows) in a single-cell atlas of normal mice microglia and brain myeloid cells across different age groups (E14.5, P7, P60) (columns).
Fig. 6
Fig. 6. The single-cell spatial transcriptomic architecture of H3-K27M DMGs.
a, Schematic of HybISS experimental approach. Briefly, mRNA is amplified in situ by RT, and the product cDNA is hybridized with a custom complementary padlock probe. Next, RCA reaction is run to generate a blob of DNA that can then be barcoded with individualized gene bridge probes and fluorescently barcoded. After imaging, the sample is stripped of bridge probes, and the cycle is repeated five times with different fluorophores for decoding and identification of gene signals based on their decoding sequence. b, Representative image of malignant and nonmalignant cell type/state assignments in one primary human H3-K27M DMG section (UMPED65_A2; 1 experiment over the entire tumor section with N = 22,813 cells assigned), outlining the distribution of malignant and nonmalignant cell populations within the sample. c, Proportions (x axis) of scRNA-seq derived tumor cell states (color legend) identified by pciSeq across 16 human H3-K27M DMG samples (y axis). d, Violin plot representing the distribution of MES-like cell proportions in adult compared to pediatric H3-K27M DMGs (N = 7,004 MES-like cells across 16 biologically independent samples) profiled by spatial transcriptomics. Whiskers show minimum/maximum proportions. An asterisk denotes P = 0.024 (two-sided t-test). e, Heatmap representations of neighborhood enrichment analysis between malignant cell populations, identified at 50 μm, across all samples. The color scale denotes the probability of finding a cell when a second cell type is presently divided by the probability of finding the second cell type. f, Representative multiplexed IF CODEX images from three of four primary human H3-K27M DMGs, showing spatially distinct subpopulations of malignant (marker: H3-K27M) OPC-like (marker: PDGFRA), OC-like (marker: BCAS1), AC-like (marker: GFAP) and proliferating cells (marker: Ki67). For each tumor, one experiment was performed with ~70,000 to 1.2 million individual cells profiled per sample over the entire tumor section. g, Sample-wide scatter plot representing each cell population’s tendency to cluster with other cell populations (degree of centrality, y axis) or to cluster with themselves (clustering coefficient, x axis).
Fig. 7
Fig. 7. Schematic summary of the spatiotemporal context-specific composition of H3-K27M DMGs.
Comparisons are between pediatric versus adult patient groups (x axis) and pontine versus thalamic midline locations (y axis) and a representative model image of tumor cell composition is depicted, respectively. All tumor groups are abundant in OPC-like cells and also harbor more differentiated AC-like, OC-like, MES-like and nonmalignant microenvironmental cells, but lack tumor cells of the NPC/neuronal lineage, as delineated by single-cell multi-omics (color legend). MES-like cells increase with age, as indicated by the green arrow, which is associated with age-related changes in the tumor immune microenvironment; in particular, higher proportions of microglia in pediatric tumors as opposed to increased proportions of macrophages in adult tumors. Location specificity exists for varying maturation stages of OPC-like cells—pontine tumors harbor less mature pre-OPC-like cells, while thalamic tumors are enriched for more mature lineage-committed OPC-like cells, either as a result of region-specific cell-intrinsic features or due to location-related diversification driven through interactions within the local environmental niche.
Extended Data Fig. 1
Extended Data Fig. 1. Non-malignant cell populations.
UMAP projections highlighting non-malignant cell clusters by expression of canonical markers of (a) Tumor-associated myeloid cells. (b) T cells. (c) Oligodendrocytes. (d) Endothelial cells.
Extended Data Fig. 2
Extended Data Fig. 2. Intratumoral transcriptional heterogeneity of H3-K27M DMGs.
(a) UMAP of fresh tumor cells, highlighting original samples (color legend) after batch effect correction. (b) Pairwise Pearson correlations (color scale) between NMF factors derived from each fresh tumor sample (x-axis). Highly correlated NMF factors were combined as metaprograms. (c) Pairwise Pearson correlations (color scale) between metaprograms derived from fresh H3-K27M DMGs, GBM, IDH-mutant glioma. (d) Pairwise Pearson correlations (color scale) between metaprograms independently derived from fresh and frozen tumors. (e) Proportions (y-axis) of projected fresh tumor derived metaprograms (color legend), that were highly correlated to respective frozen metaprograms, and of fresh OPC-like-3, across frozen tumor nuclei (x-axis). Instead of fresh OPC-like-2, correlated frozen OPC-like-b was scored to minimize technical ariefacts (see methods). Nuclei with scores <0.2 are denoted as ‘score too low’. (f) UMAP of frozen tumor nuclei after batch effect correction, with color legend depicting annotation based on single-cell scores of all fresh metaprograms and frozen OPC-like-b (see methods). (g) Proportion of all cells/nuclei assigned as cycling vs. non-cycling (color legend) across metaprograms. (h) UMAP of location matched IDH-mutant midline tumors, highlighting independently derived metaprograms. (i) Boxplots depicting metaprogram proportions in all tumors compared by adult vs. pediatric age groups, controlled for pontine (left) or thalamic (right) locations (Thalamic: adult (N = 6), pediatric (N = 8); Pontine: adult (N = 4), pediatric (N = 15)). (j) Boxplots depicting metaprogram proportions in all tumors compared by pontine and thalamic locations, controlled for pediatric (left) or adult (right) age groups (Adult: thalamic (N = 6), pontine (N = 4); Pediatric: thalamic (N = 8), pontine (N = 15)). In (i) and (j) The median is marked by the thick line within the boxplot, the first and third quartiles by the upper and lower limits, and the 1.5x interquartile range by the whiskers. *** denotes credible statistical changes as assessed by a Bayesian scCODA model, with FDR < 0.05, without multiple test correction.
Extended Data Fig. 3
Extended Data Fig. 3. Region-specific states of OPC-like cells.
(a) Projection of fresh tumor-derived metaprograms (x-axis) onto scRNA-seq derived normal cell types (y-axis) of the human hippocampus. Color scale presents expression scores of normal cell signatures in tumor cells, while symbol sizes depict expression scores of tumor cell signatures in normal cells. Symbol shape denotes Pearson correlation of expressions, with circle denoting r > =0.5, and square denoting r < 0.5. (b) Projection of fresh tumor-derived metaprograms (x-axis) onto scRNA-seq derived normal cell types (y-axis) of the developing human cortex. Color scale presents expression scores of normal cell signatures in tumor cells, while symbol sizes depict expression scores of tumor cell signatures in normal cells. Symbol shape denotes Pearson correlation of expressions, with circle denoting r > =0.5, and square denoting r < 0. (c) Projection of fresh tumor-derived metaprograms (x-axis) onto scRNA-seq derived normal cell types (y-axis) of the neonatal mouse cortex. Color scale presents expression scores of normal cell signatures in tumor cells, while symbol sizes depict expression scores of tumor cell signatures in normal cells. Symbol shape denotes Pearson correlation of expressions, with circle denoting r > =0.5, and square denoting r < 0. (d) Diffusion map embedding of single OPC-like subpopulation transcriptomes (left) and pseudotime analysis by Slingshot where the color scale represents the relative pseudotime (right). (e) Heatmap representing Z-scored expression levels (color scale) of pre-OPC and OPC marker genes (rows) in tumor OPC-like subpopulations ordered along pseudotime (columns).
Extended Data Fig. 4
Extended Data Fig. 4. Characteristic chromatin profiles of H3-K27M DMG cell populations.
(a) UMAP of all nuclei profiled by snATAC-seq from 8 samples (color legend). (b) UMAP of all nuclei profiled by snATAC-seq, highlighting assignments as malignant or different nonmalignant cell types. (c) UMAP of all snATAC-seq derived tumor nuclei, highlighting sample of origin after batch effect correction. (d) Sample level clustering analyses and de novo cell type annotations (color legends). (e) Dotplot representation of gene activities (color scale) and proportion of nuclei accessible (dot size) in snATAC-seq profiles of AC-like-alt., AC-like and OPC-like cells (y-axis) for canonical marker genes of AC-like, OPC-like, NPC-like (as identified in Neftel et al., 2019), and glutamatergic (as described to be enriched in OPC-like cells by Venkatesh et al., 2019) tumor cells. (f) ScRNA-seq derived log transformed expression levels of synapse-associated genes differentially accessible in AC-like-alt. cells. (g) Cell state annotations of all snATAC-seq tumor nuclei based on scRNA-seq data following canonical correlation (CCA) and label transfer analyses. (h) UMAP of chromatin accessibility profiles of all OPC-like subpopulations (color legend). (i) & (j) Dotplot representation of gene activities (color scale) and proportion of nuclei accessible (dot size) in snATAC-seq profiles of different tumor OPC-like subpopulations (x-axis) for top differentially accessible marker genes (i) and TFs (j) derived from studies of normal pre-OPCs and OPCs. (k) Venn diagrams depicting the intersection of differentially accessible chromatin sites with CREs that are linked to GPCs for each cell type. p-values calculated from a two-sided hypergeometric test are shown.
Extended Data Fig. 5
Extended Data Fig. 5. The myeloid cell landscape of H3-K27M DMGs.
(a) Boxplot depicting TAM proportions in all tumor and normal cells profiled by scRNA-seq and grouped by adult and pediatric sample groups across N = 16 biologically independent samples. The median is marked by the thick line within the boxplot, the first and third quartiles by the upper and lower limits, and the 1.5x interquartile range by the whiskers. (b) Distributions (mean values + /− 2xSEM) of macrophage and microglia proportions within TAMs across N = 16 pontine and thalamic tumors. (c) & (e) Venn diagram depicting shared and specific OPC-like-to-myeloid (c) and myeloid-to-OPC-like (e) ligand-receptor interactions between different OPC-like subpopulations. (d) & (f) Ligand-receptor interactions assessed for each OPC-like subpopulation for OPC-like-to-myeloid (d) and myeloid-to-OPC-like (f) interactions. Color scale depicts probabilities of interaction, while dot size denotes Benjamini-Hochberg (BH)-corrected p-values from a two-sided permutation test.
Extended Data Fig. 6
Extended Data Fig. 6. The single-cell spatial transcriptomic architecture of H3-K27M DMGs.
(a) Representative HybISS gene maps for 16 H3-K27M tumors (1 experiment/tumor over the entire image section with 100-20,000 cells profiled/tumor). Scale bar corresponds to 100 µm in all panels. (b) Confusion matrix of pciSeq derived tumor cell state scores for all samples. The color scale represents the mean probability assigned to a cell when a specific cell state is predicted. Higher values indicate a more probable prediction. (c) Scatter plot representing numbers of malignant cells assigned to a cell state (color scale) for each sample (dot), as inferred from pciSeq based on 116 marker genes (y-axis) or on the 4 best markers (x-axis). The Pearson correlation coefficient between both marker sets is shown in red. (d) Sample-level proportions (x-axis) of malignant and non-malignant cells (color legend) across 16 tumors (y-axis) profiled by HybISS as assessed by anti-H3.3K27M IF. (e) Sample-level proportions (x-axis) of non-malignant cell types (color legend) assigned by HybISS for the 16 H3-K27M DMGs (y-axis). (f) Scatter plot representing numbers of malignant cells assigned to a specific cell state (color scale) for each sample profiled (dot), as inferred from pciSeq based on 116 marker genes (y-axis) or on selected IF markers (PDGFRA, BCAS1, GFAP, CD44/CD63) (x-axis). The Pearson correlation coefficient between both marker sets is shown in red. (g) & (h) Representative multiplexed IF (CODEX) images, showing spatially distinct subpopulations of malignant (marker: H3-K27M) OPC-like (marker: PDGFRA), OC-like (marker: BCAS1), AC-like (marker: GFAP), and proliferating cells (marker: Ki67) in (g), and of MES-like (marker: CD44/CD63) and myeloid cells (marker: IBA1) in (h). For each tumor, one experiment was performed with ~70,000-1.2 million individual cells profiled per sample over the entire tissue section. (i) Neighborhood enrichment analysis between all malignant and non-malignant cell populations, identified at 50 μm. The color scale denotes the probability of finding a cell when a second cell type is present divided by the probability of finding the second cell type.

References

    1. Schwartzentruber J, et al. Driver mutations in histone H3.3 and chromatin remodelling genes in paediatric glioblastoma. Nature. 2012;482:226–231. doi: 10.1038/nature10833. - DOI - PubMed
    1. Wu G, et al. Somatic histone H3 alterations in pediatric diffuse intrinsic pontine gliomas and non-brainstem glioblastomas. Nat. Genet. 2012;44:251–253. doi: 10.1038/ng.1102. - DOI - PMC - PubMed
    1. Khuong-Quang DA, et al. K27M mutation in histone H3.3 defines clinically and biologically distinct subgroups of pediatric diffuse intrinsic pontine gliomas. Acta Neuropathol. 2012;124:439–447. doi: 10.1007/s00401-012-0998-0. - DOI - PMC - PubMed
    1. Sturm D, et al. Hotspot mutations in H3F3A and IDH1 define distinct epigenetic and biological subgroups of glioblastoma. Cancer Cell. 2012;22:425–437. doi: 10.1016/j.ccr.2012.08.024. - DOI - PubMed
    1. Mackay A, et al. Integrated molecular meta-analysis of 1,000 pediatric high-grade and diffuse intrinsic pontine glioma. Cancer Cell. 2017;32:520–537. doi: 10.1016/j.ccell.2017.08.017. - DOI - PMC - PubMed

Publication types