. 2022 Dec;54(12):1865-1880.
doi: 10.1038/s41588-022-01205-w. Epub 2022 Dec 5.

K27M in canonical and noncanonical H3 variants occurs in distinct oligodendroglial cell lineages in brain midline gliomas

Affiliations

K27M in canonical and noncanonical H3 variants occurs in distinct oligodendroglial cell lineages in brain midline gliomas

Selin Jessa et al. Nat Genet. 2022 Dec.

Abstract

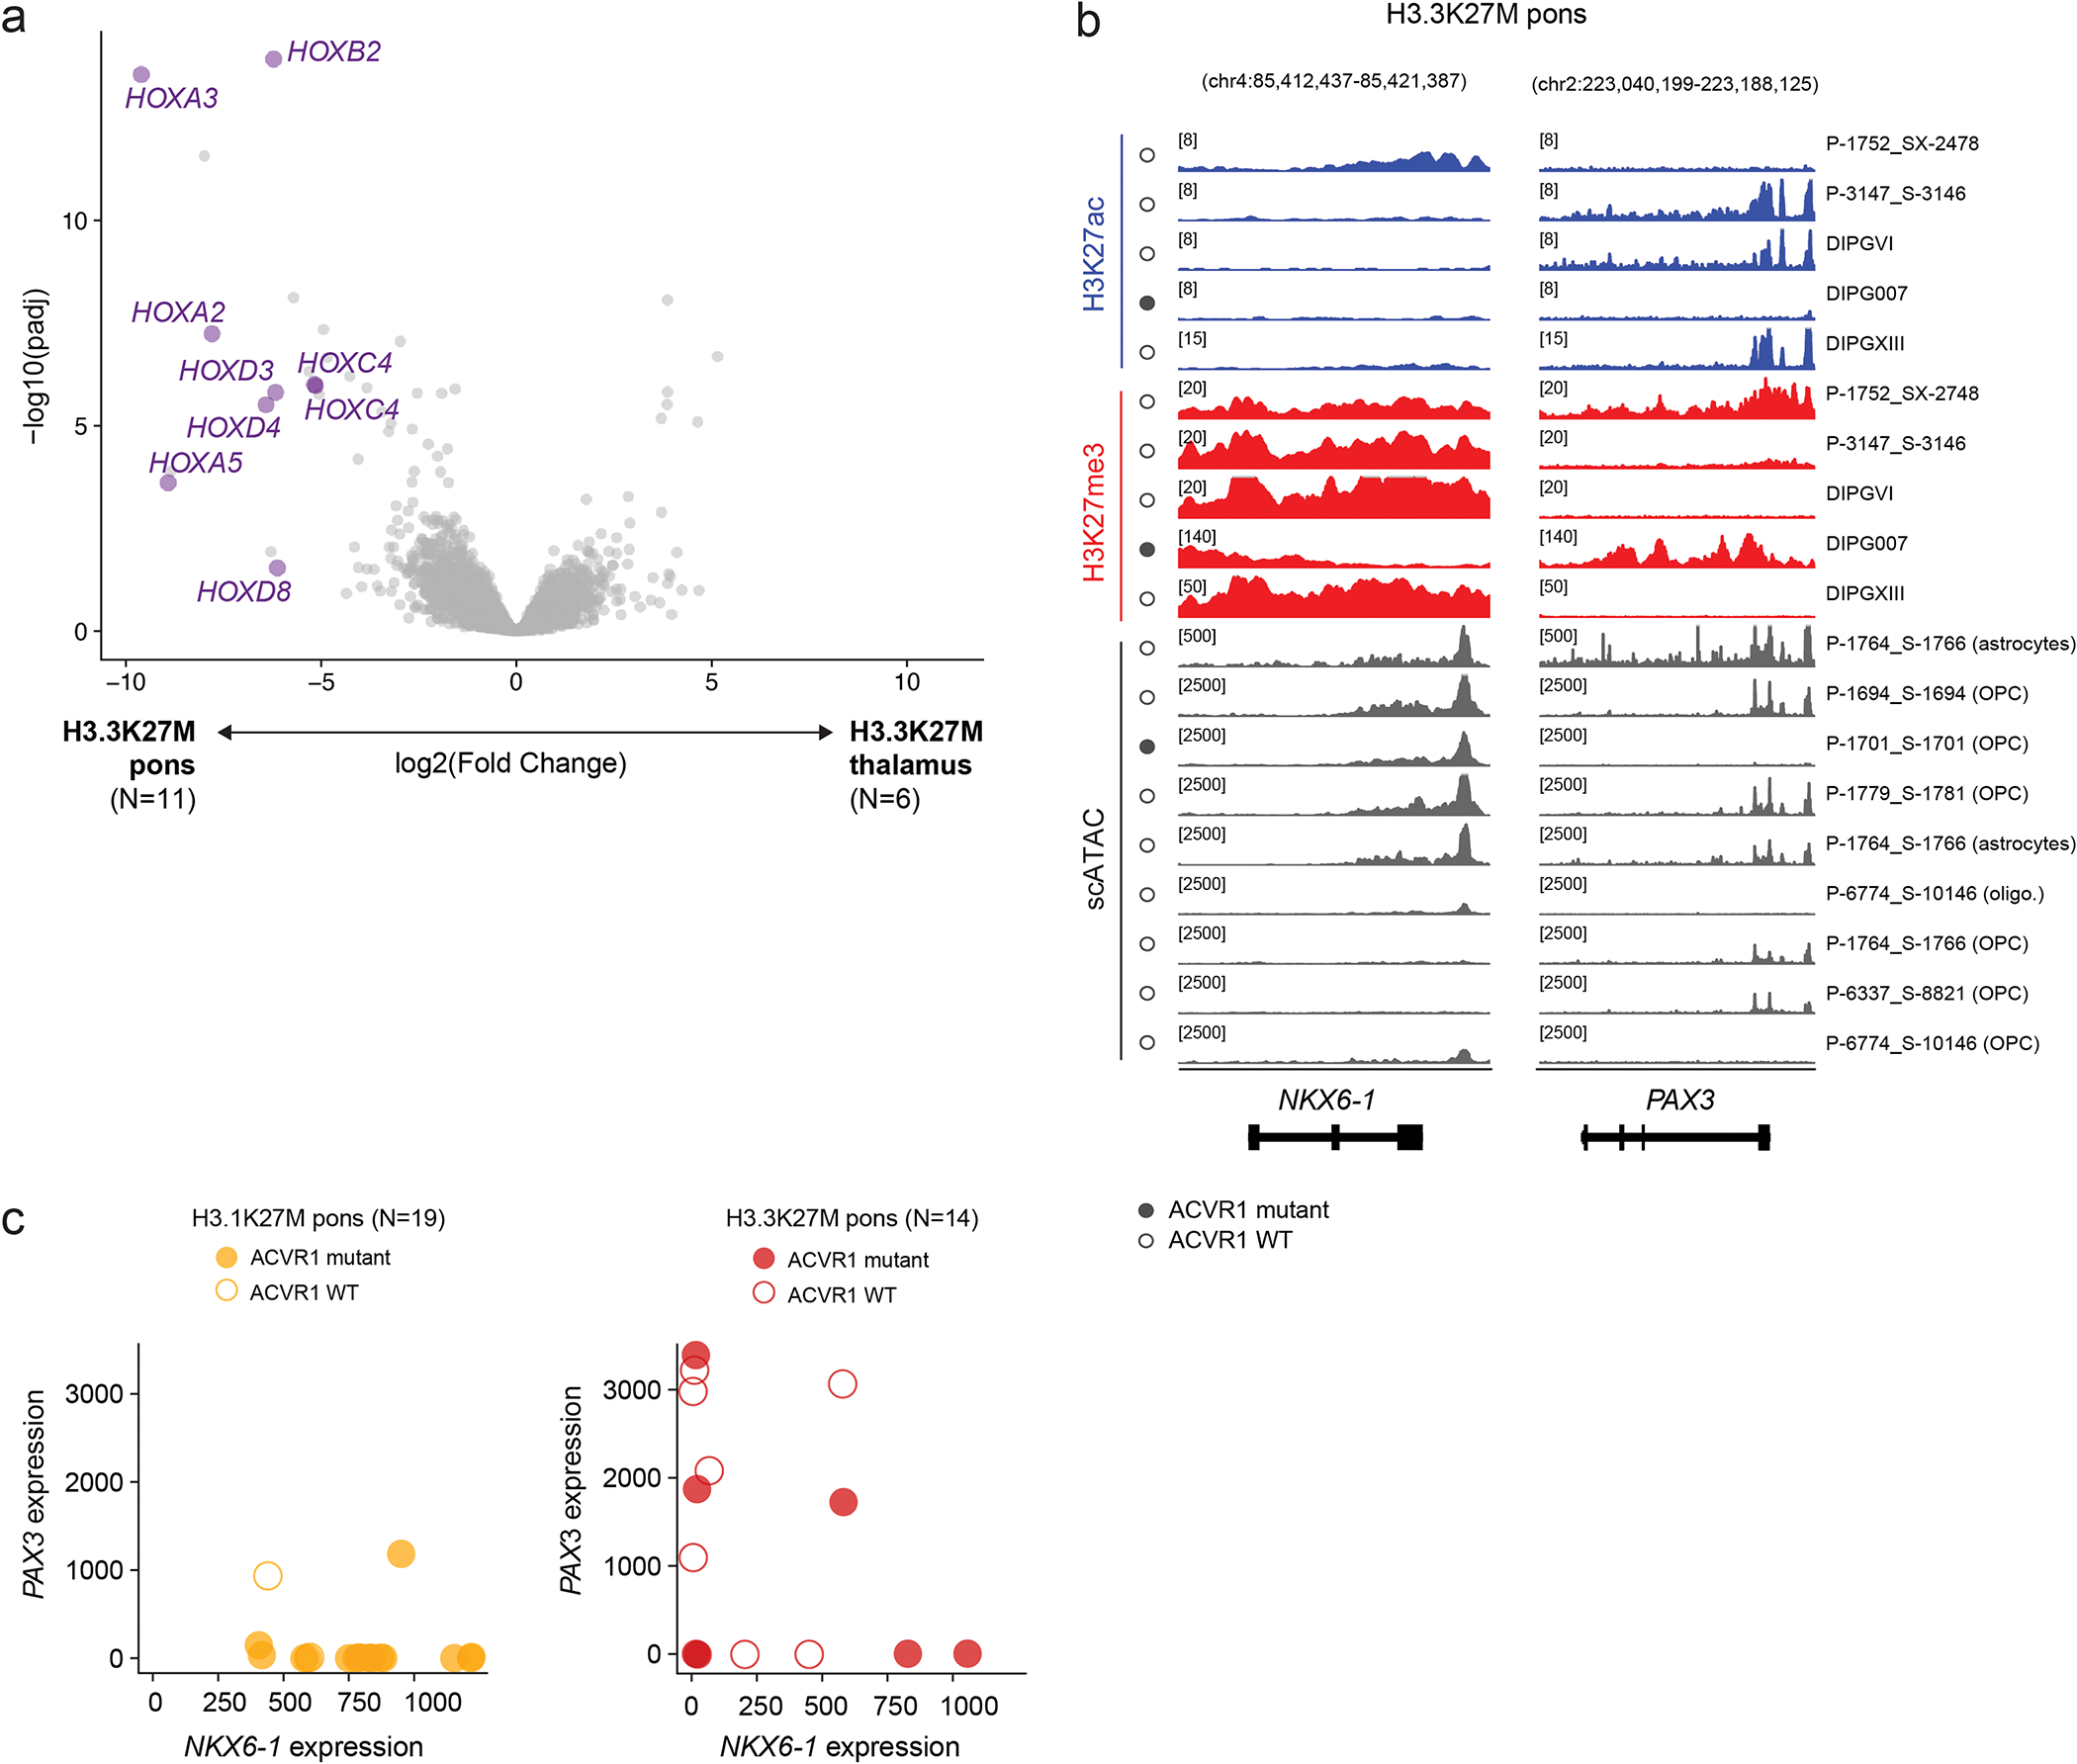
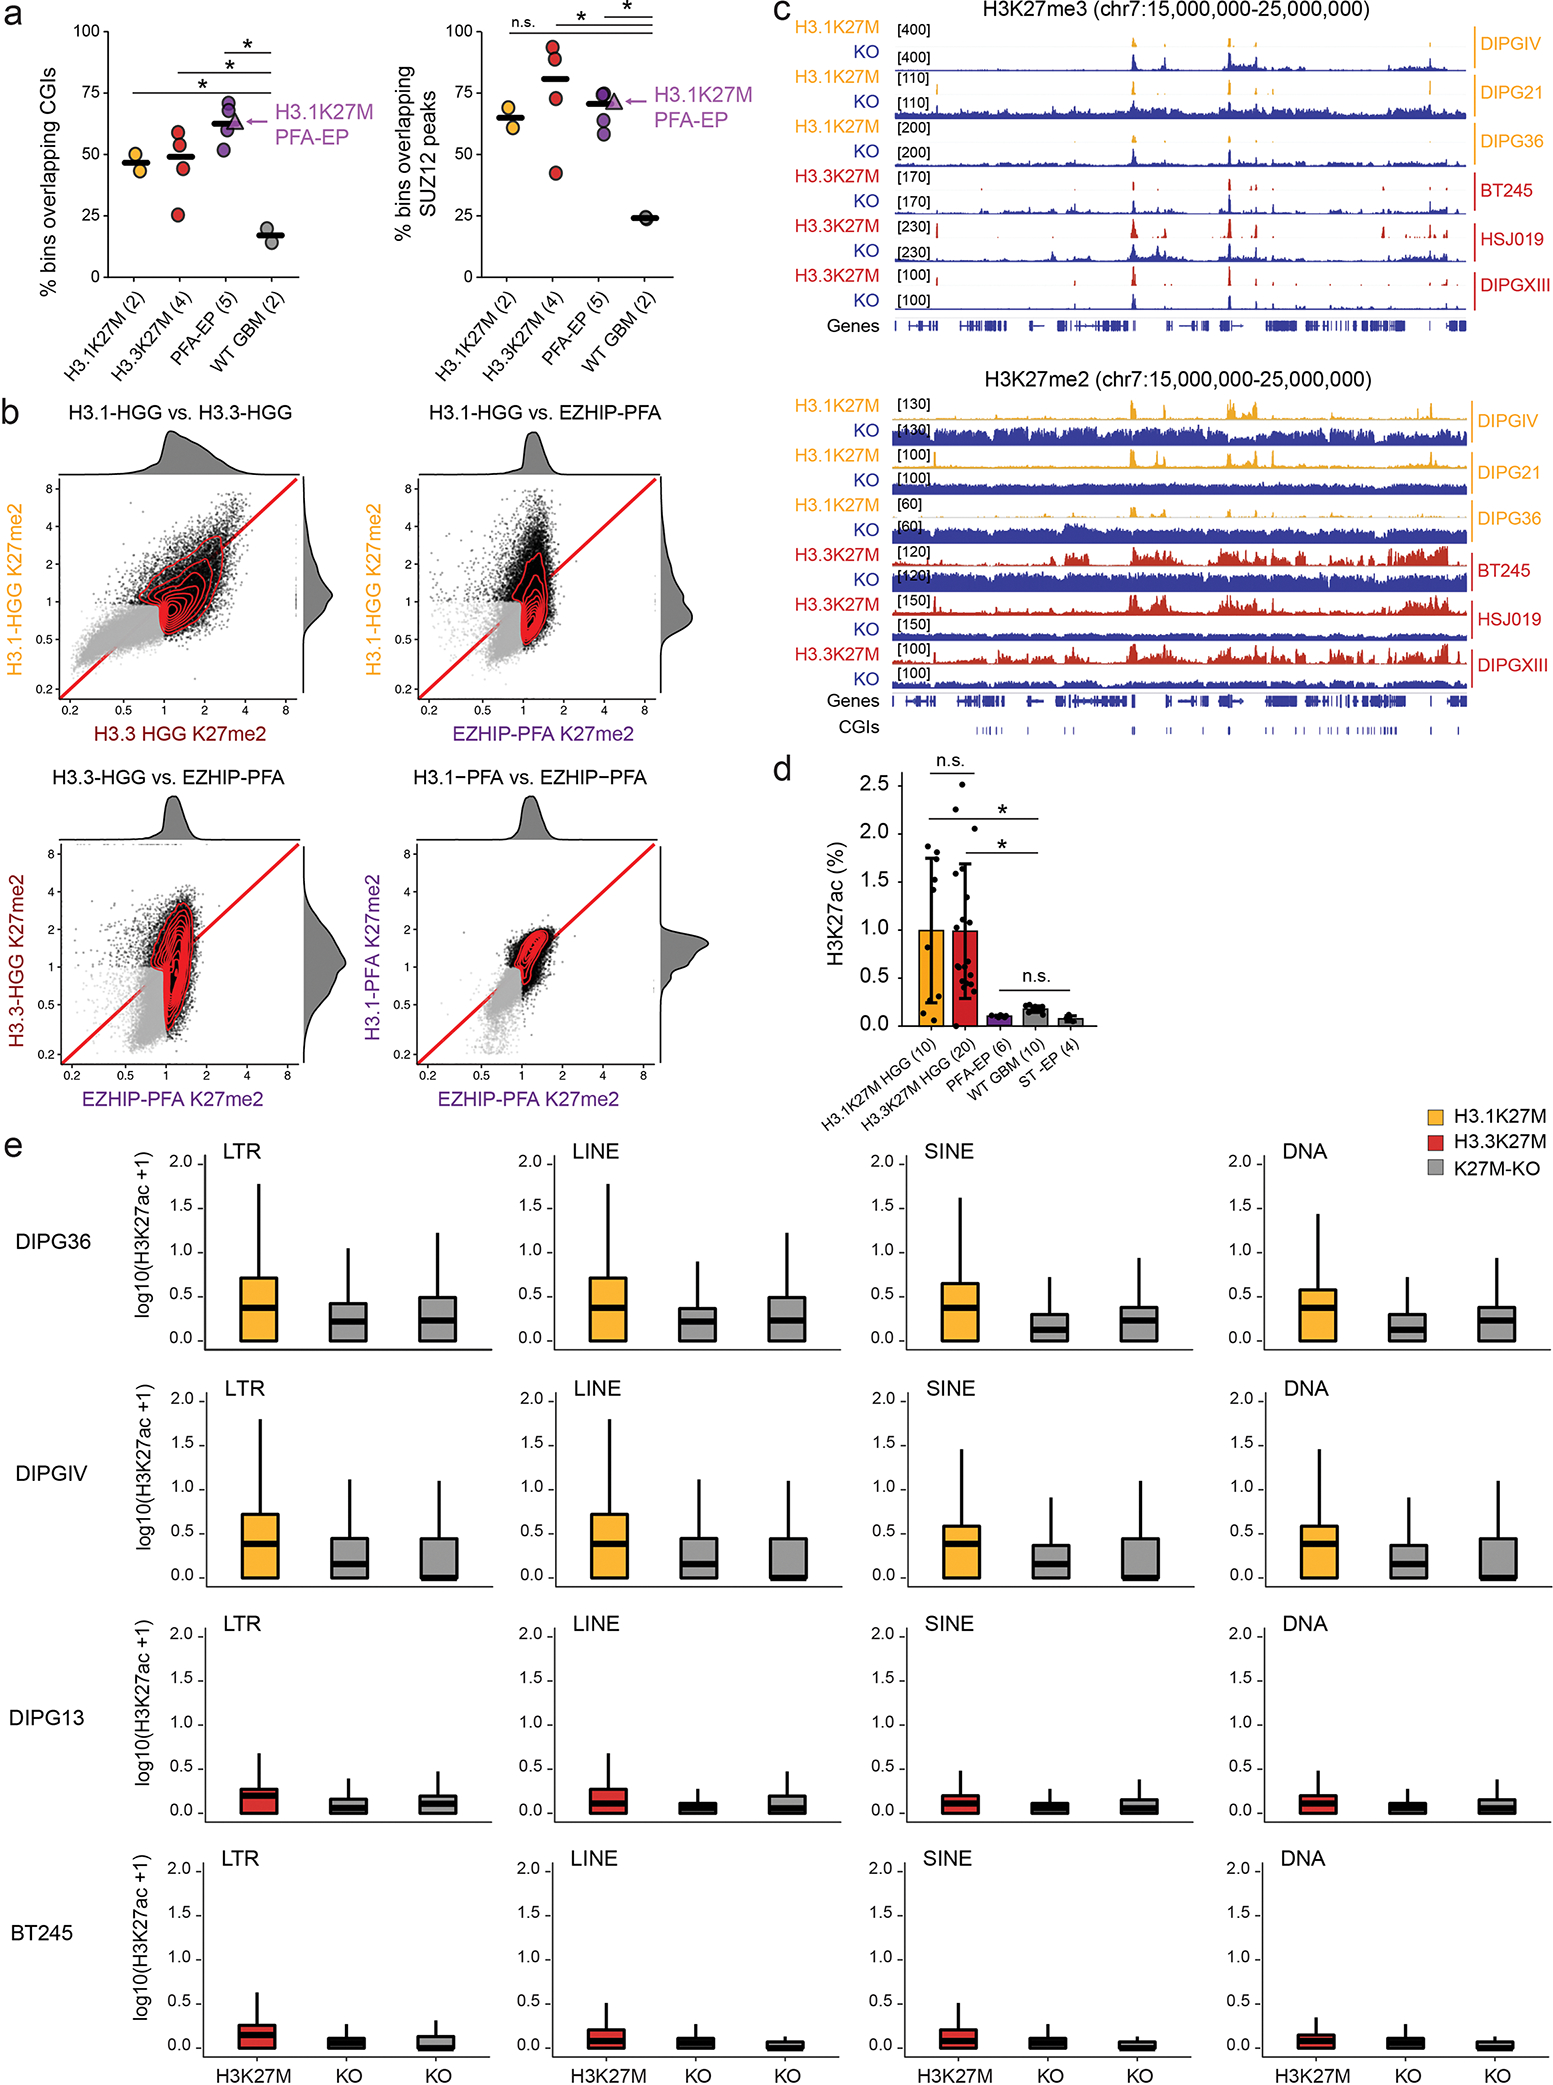
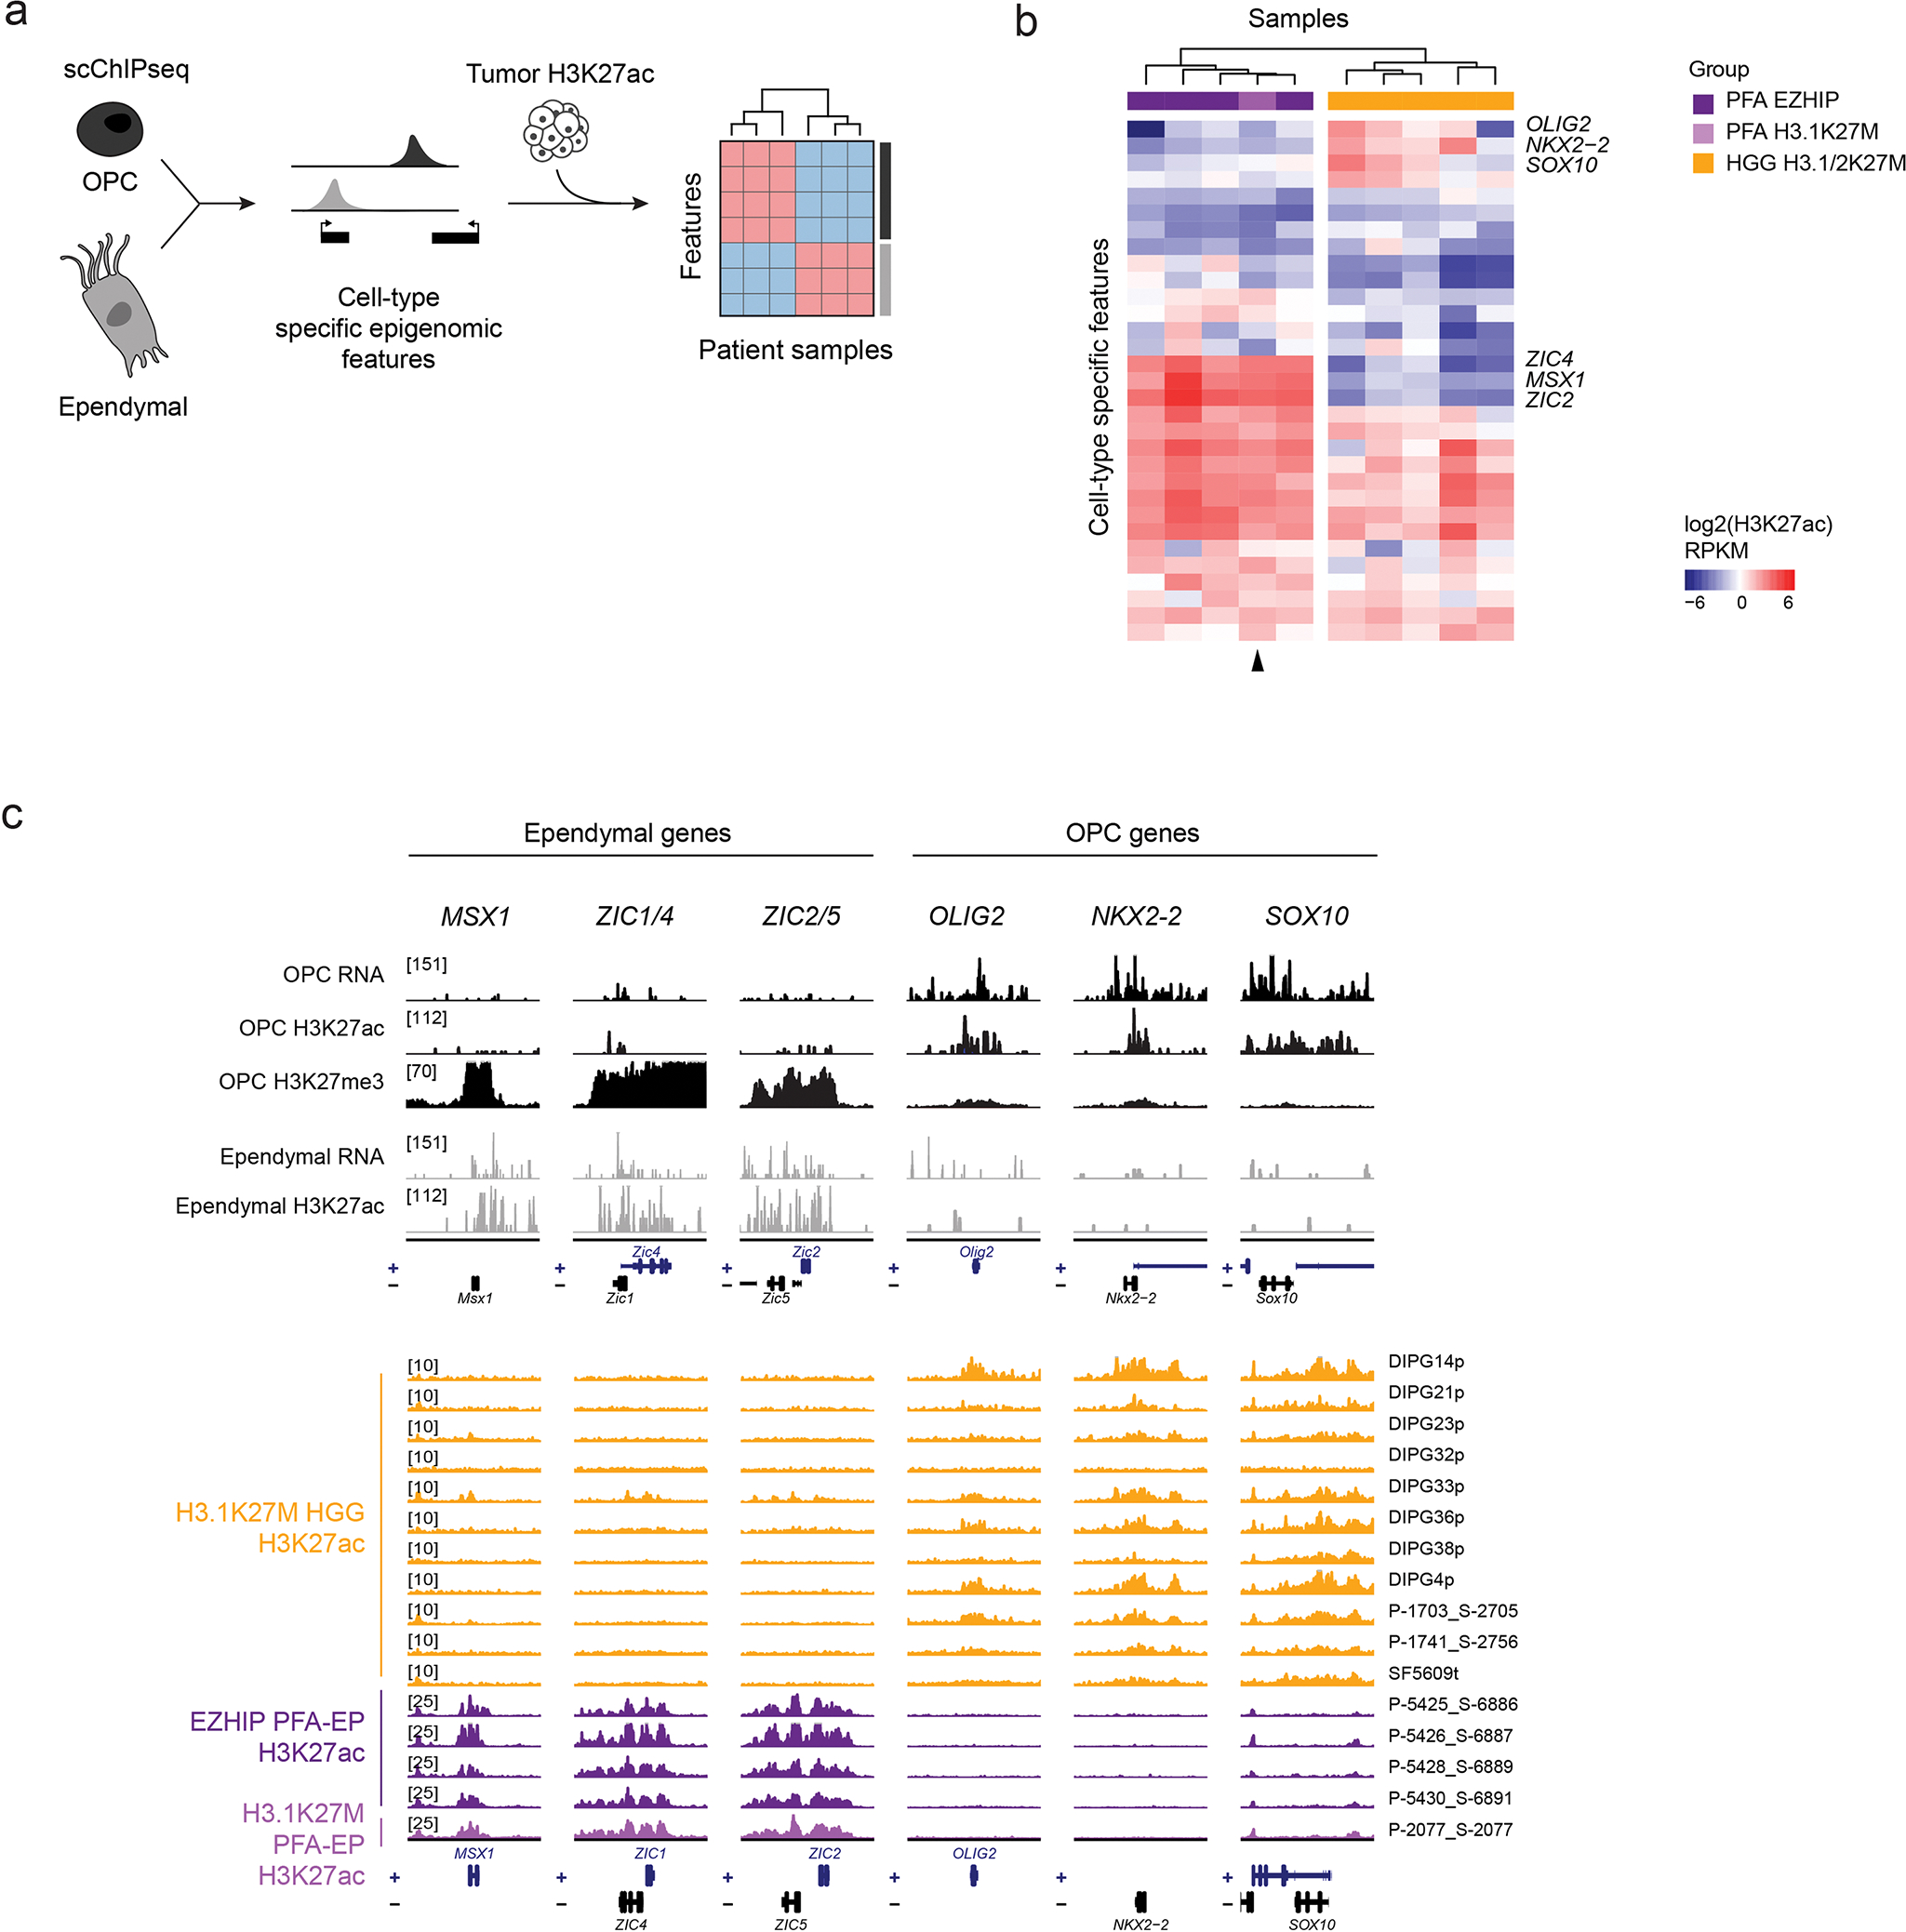
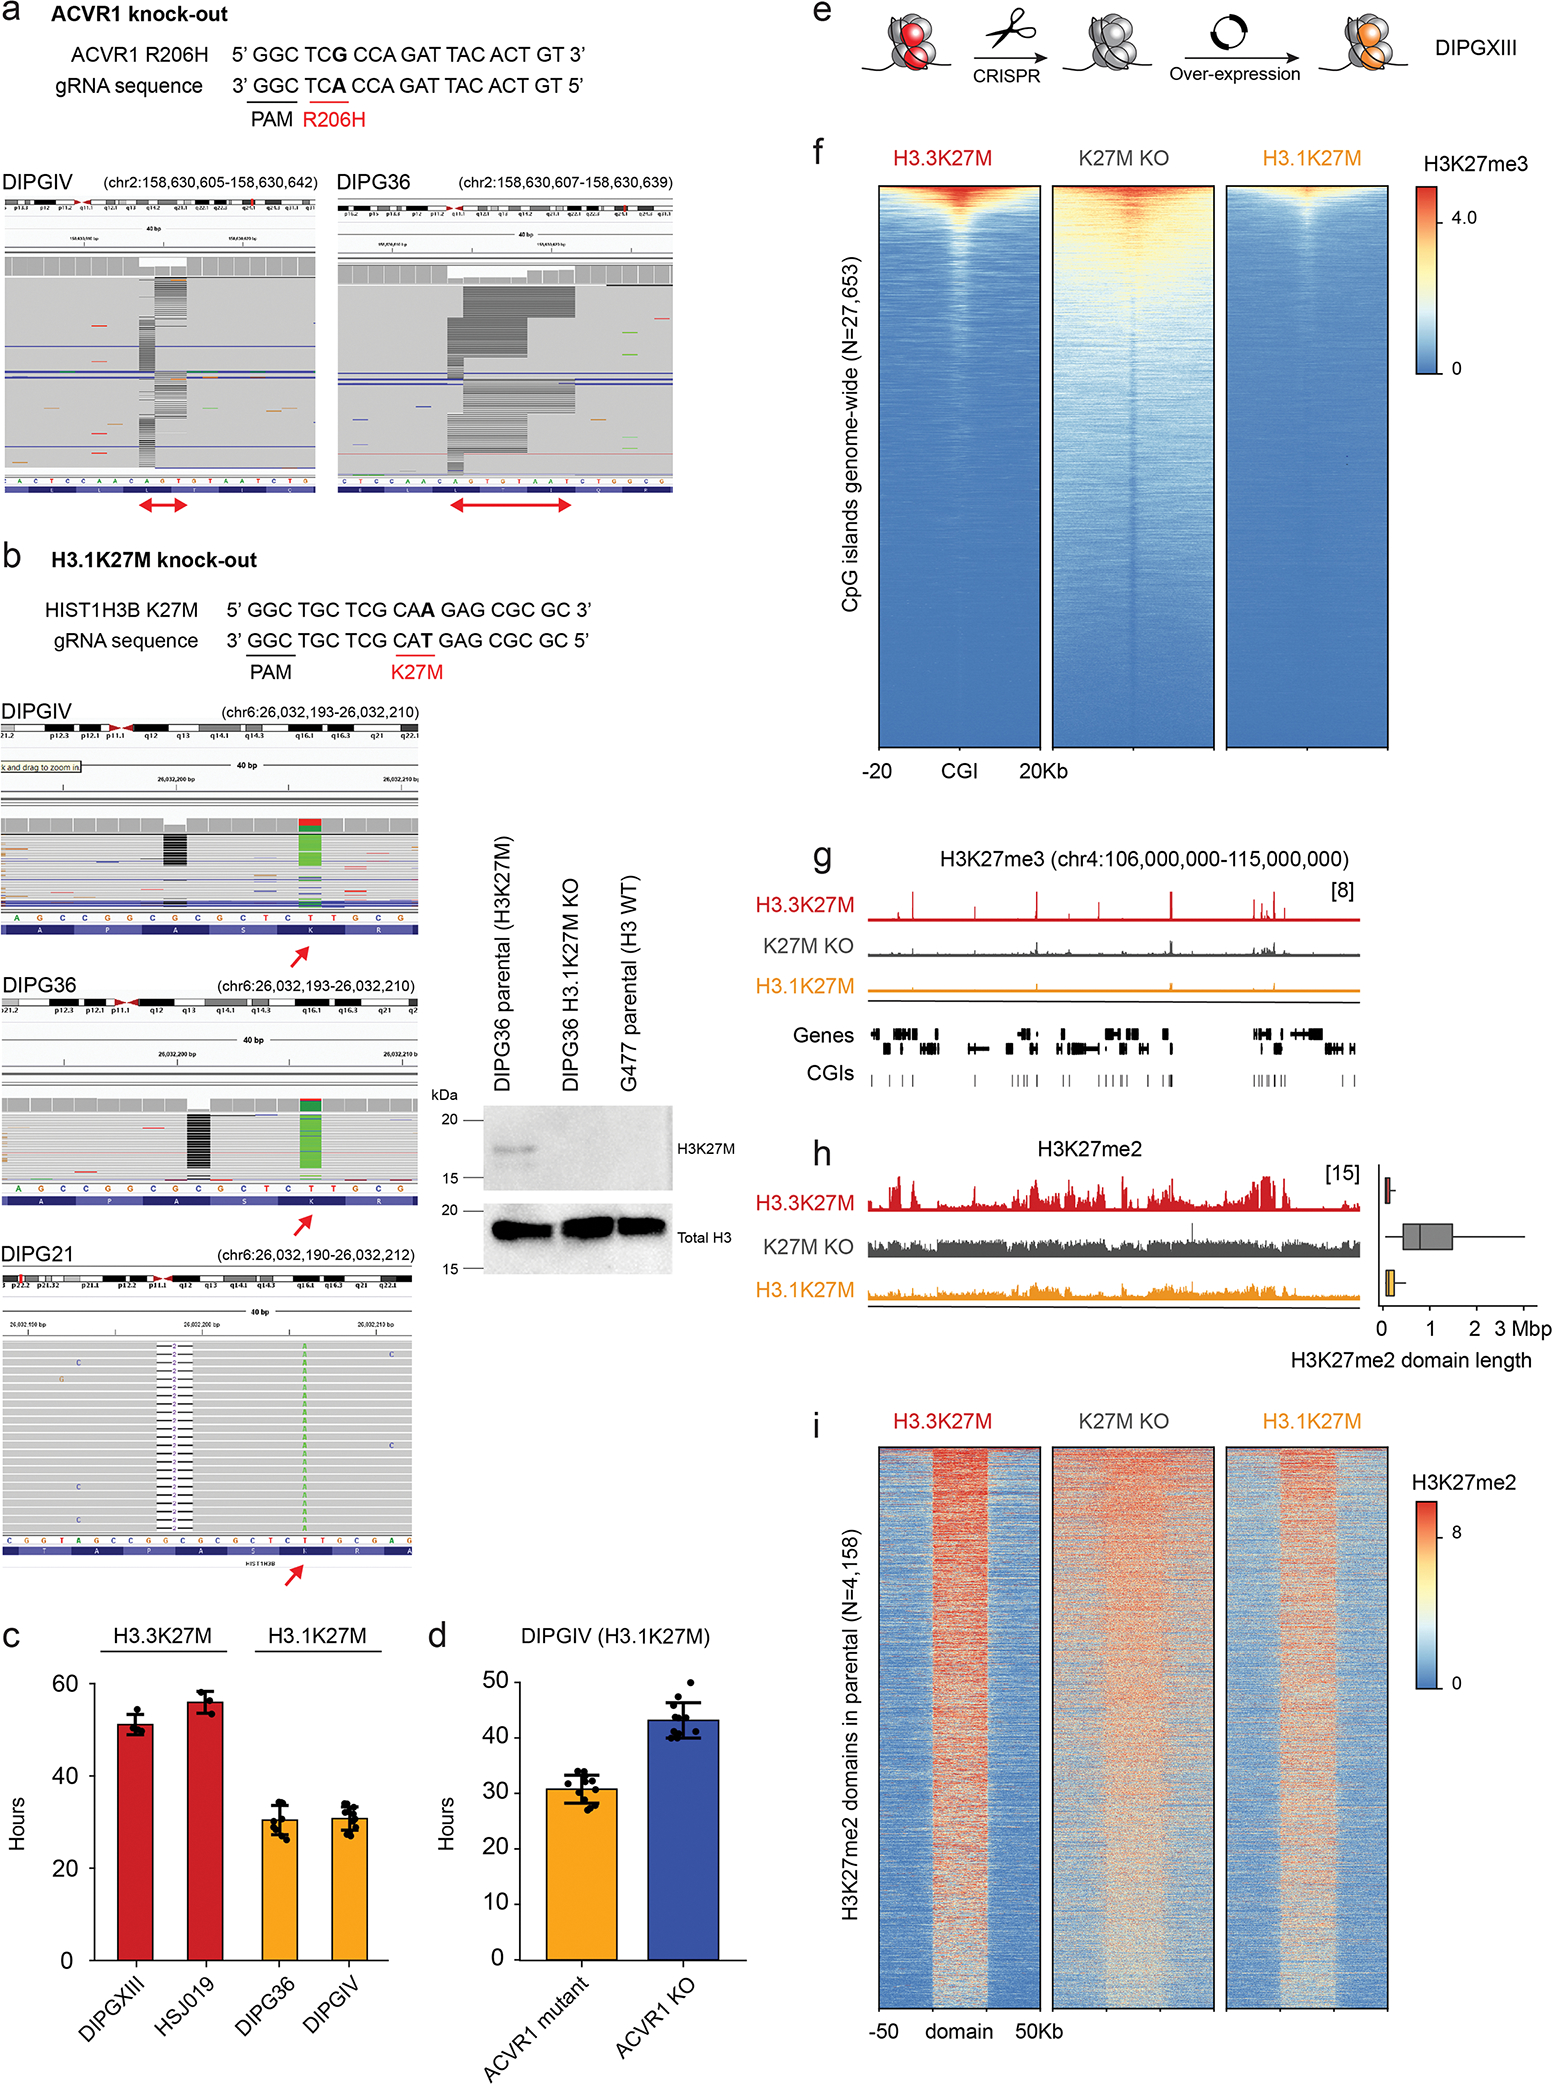
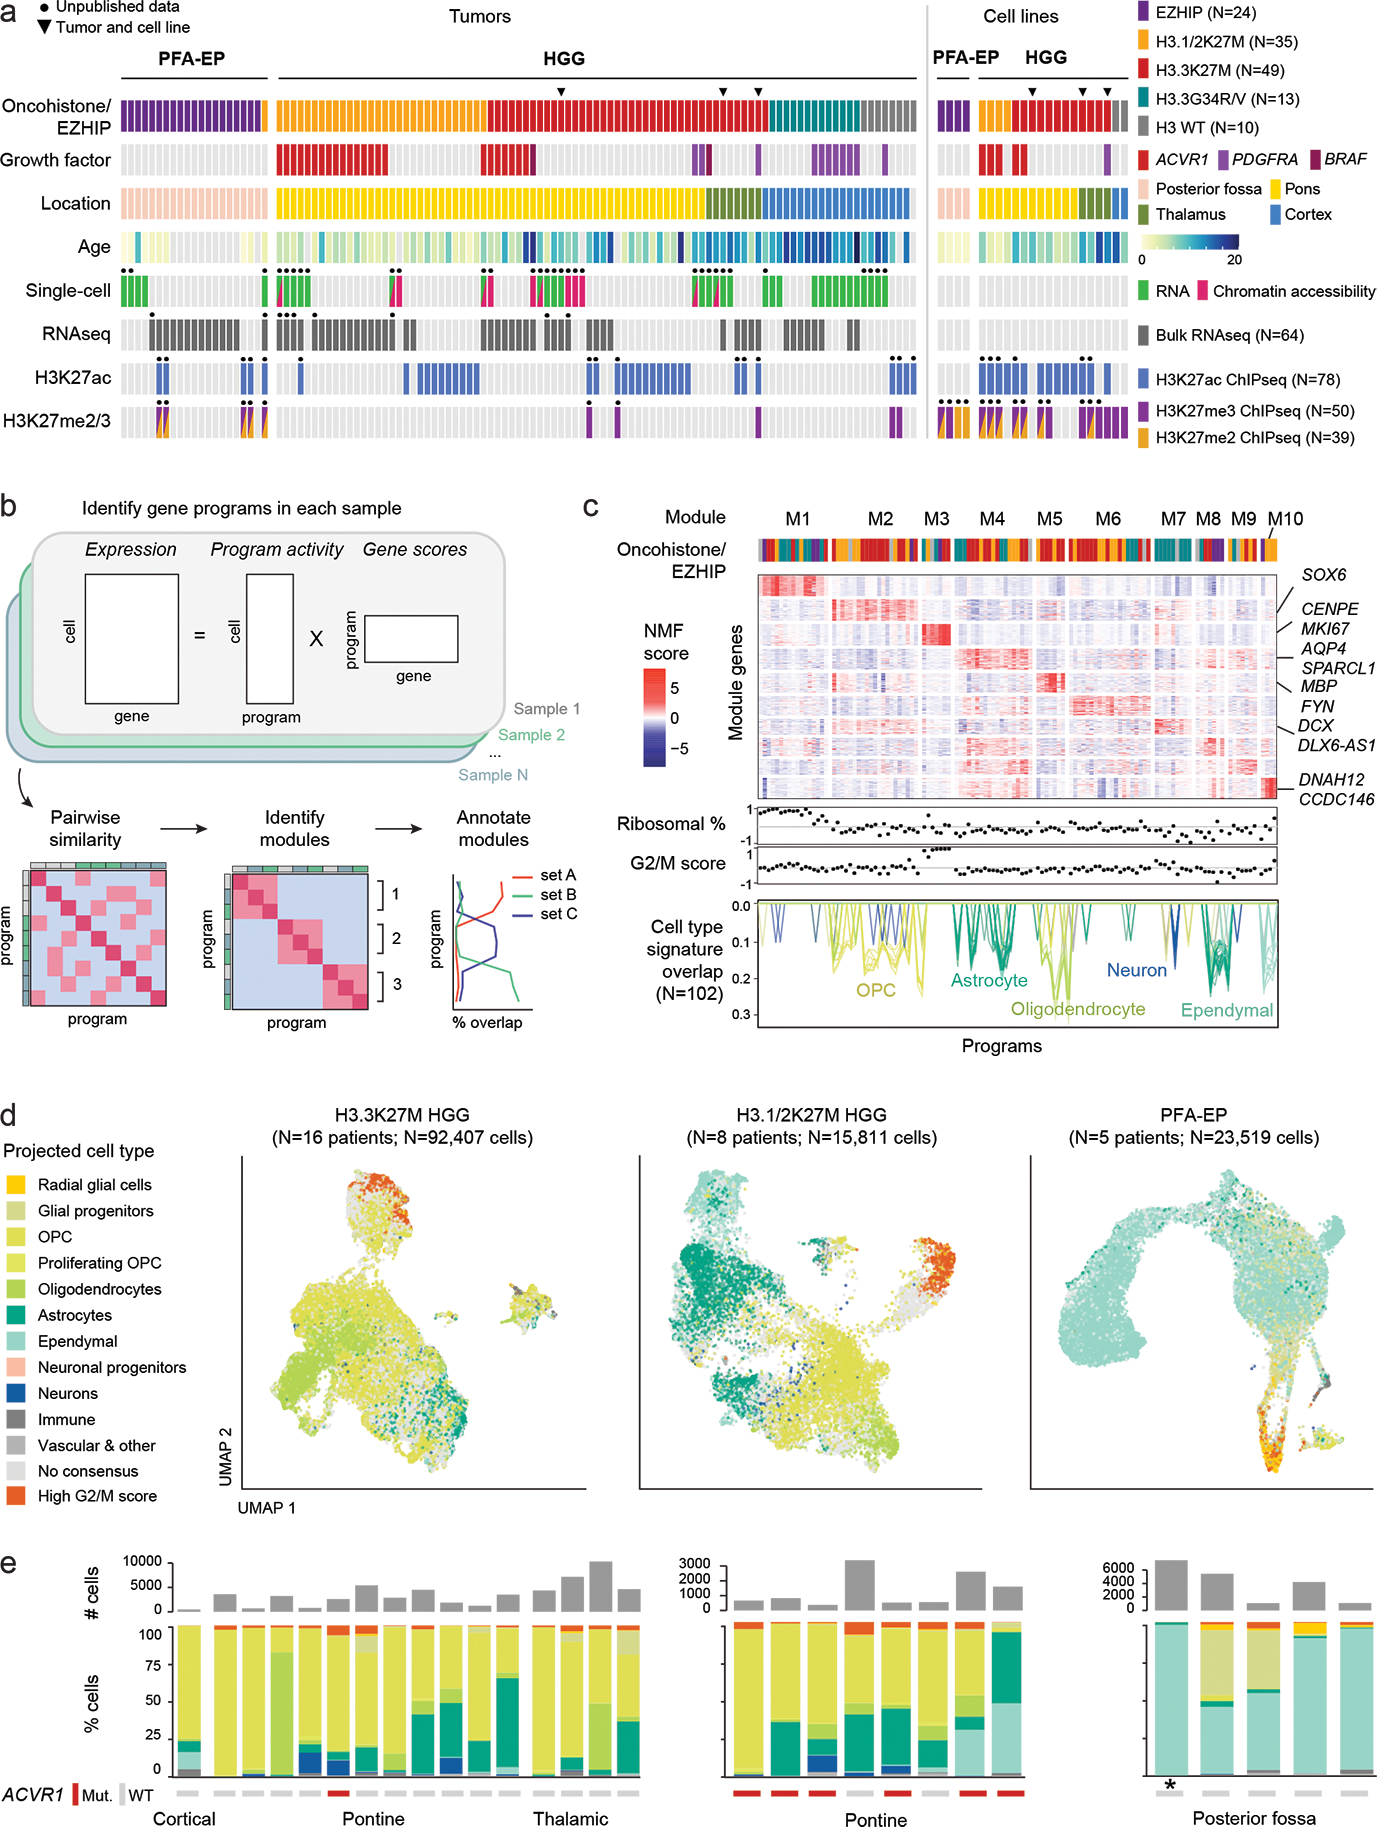
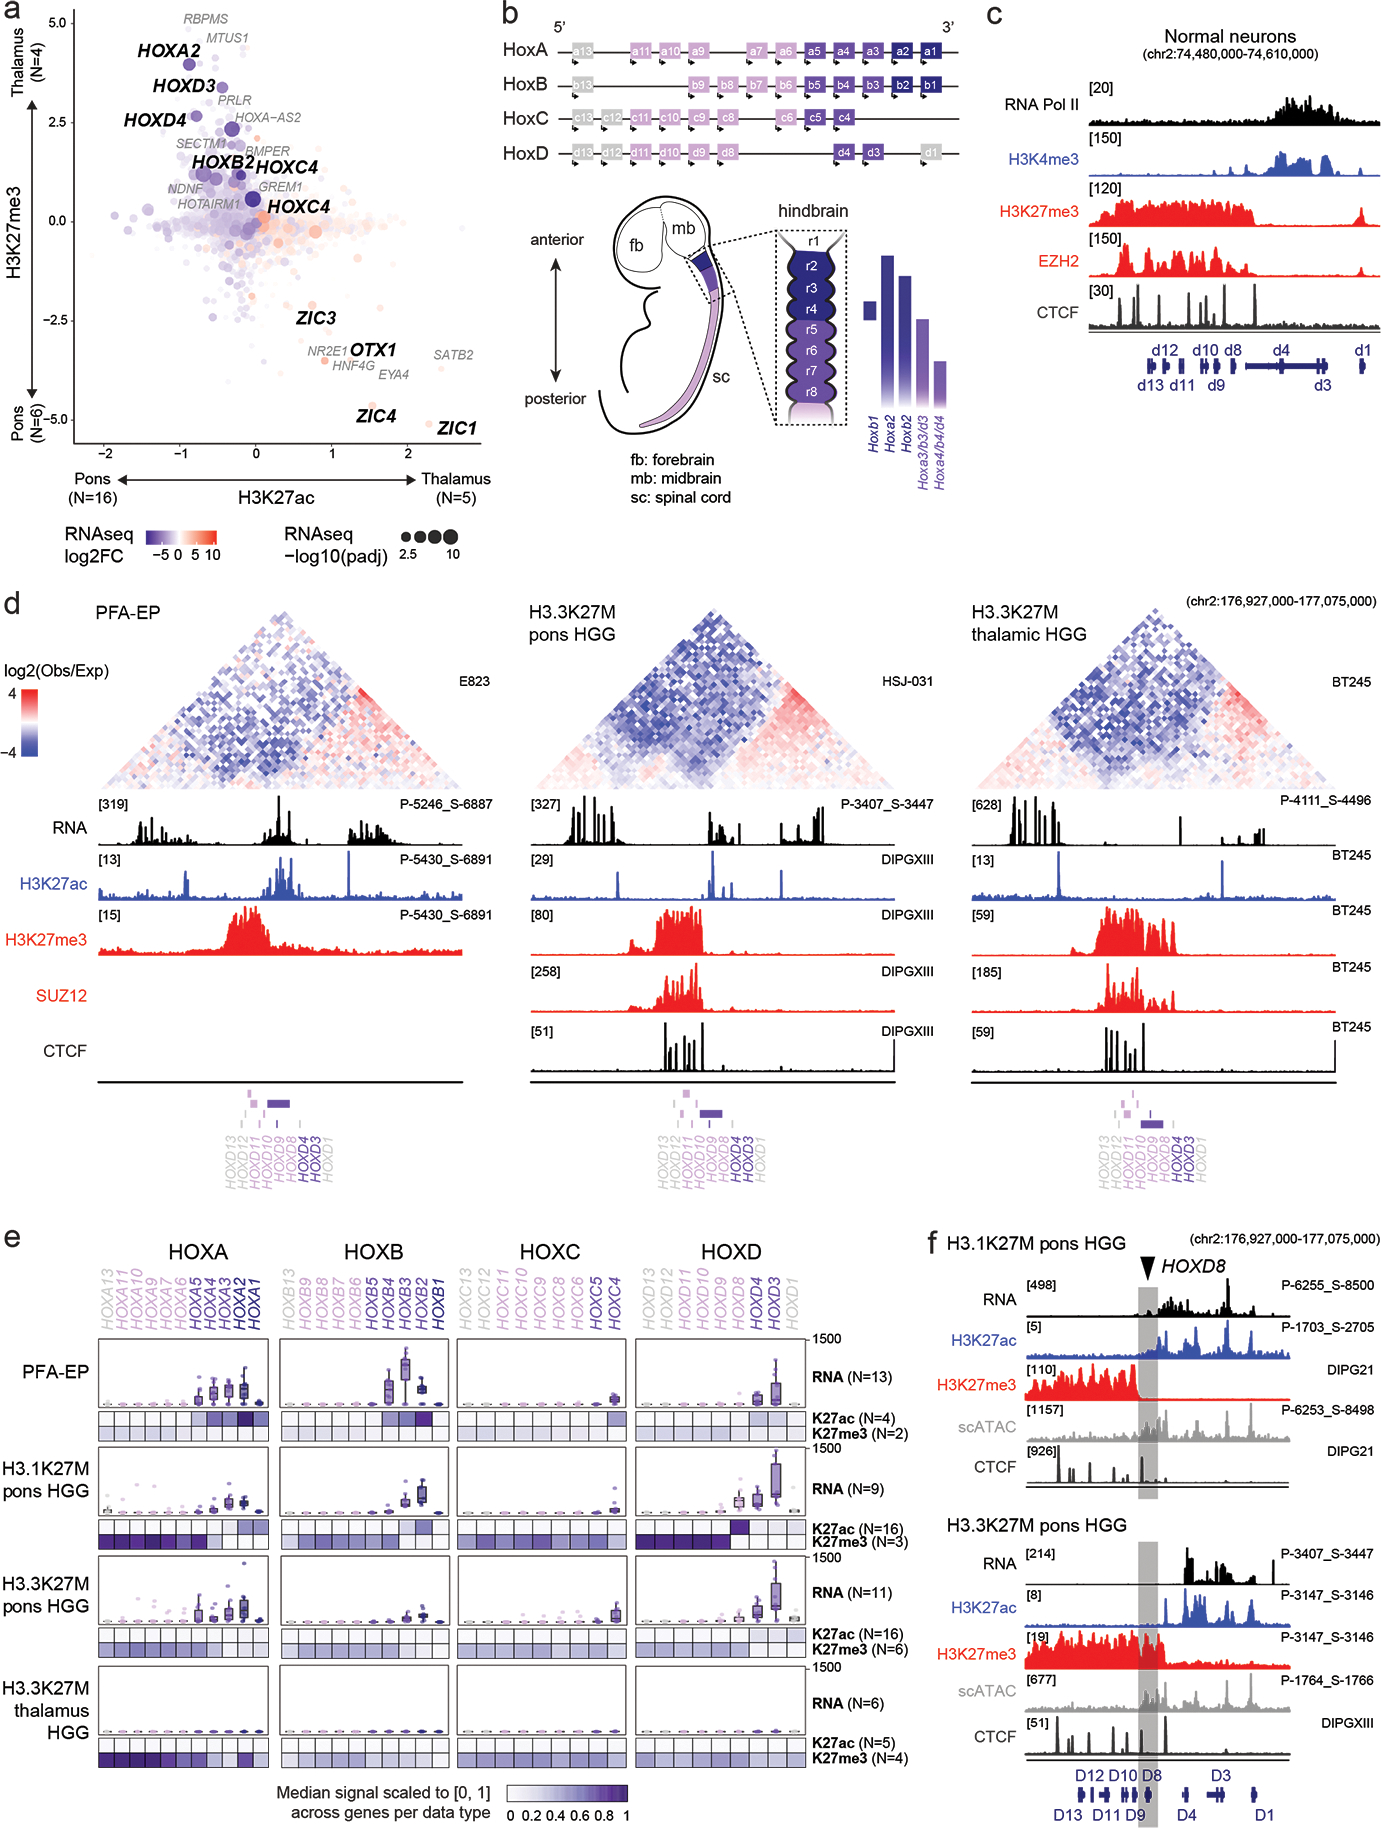
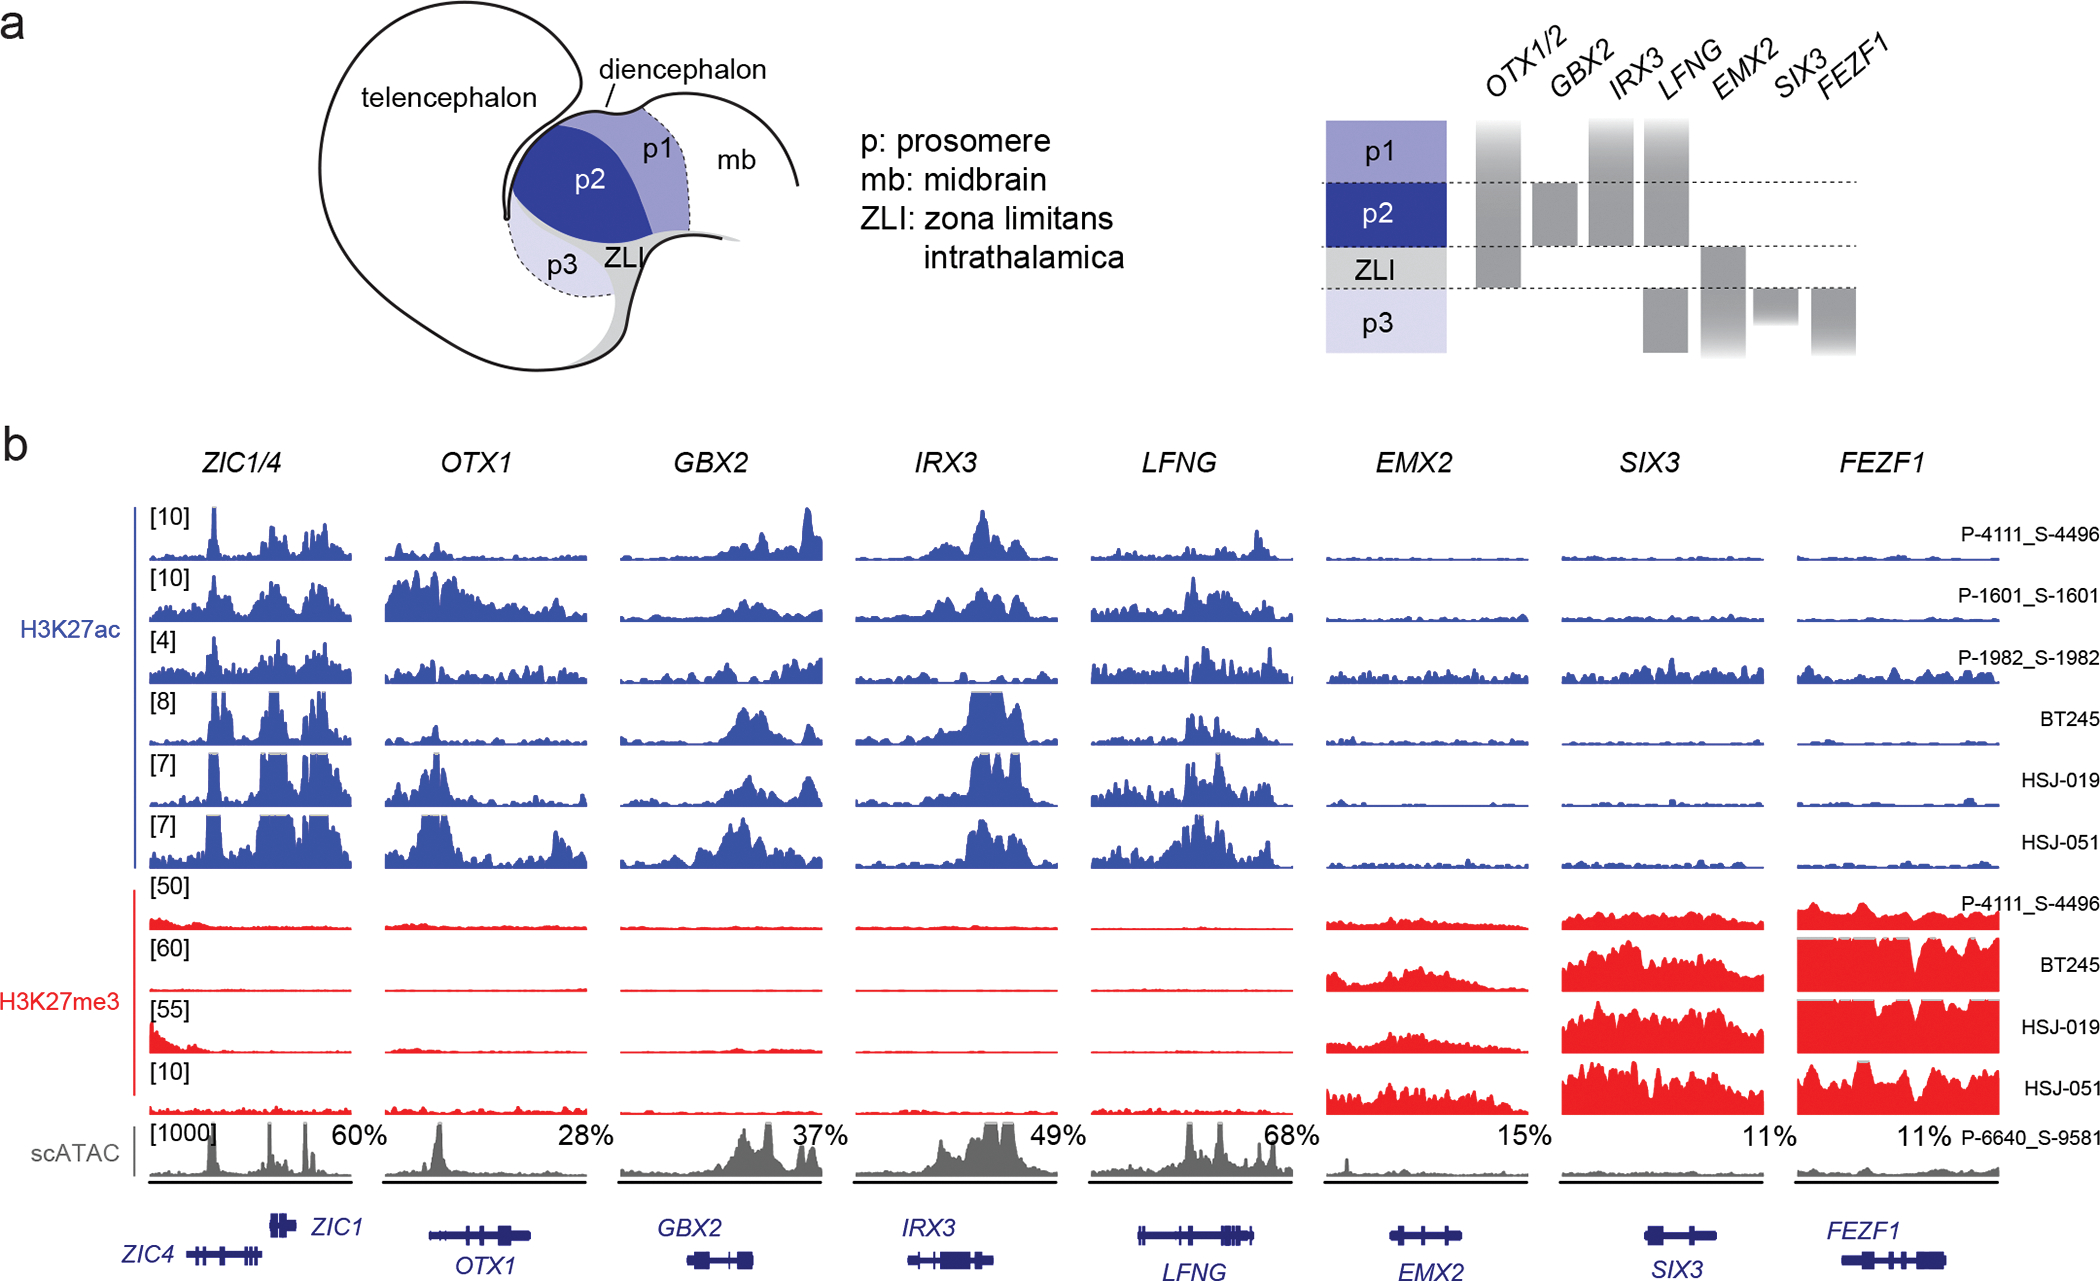
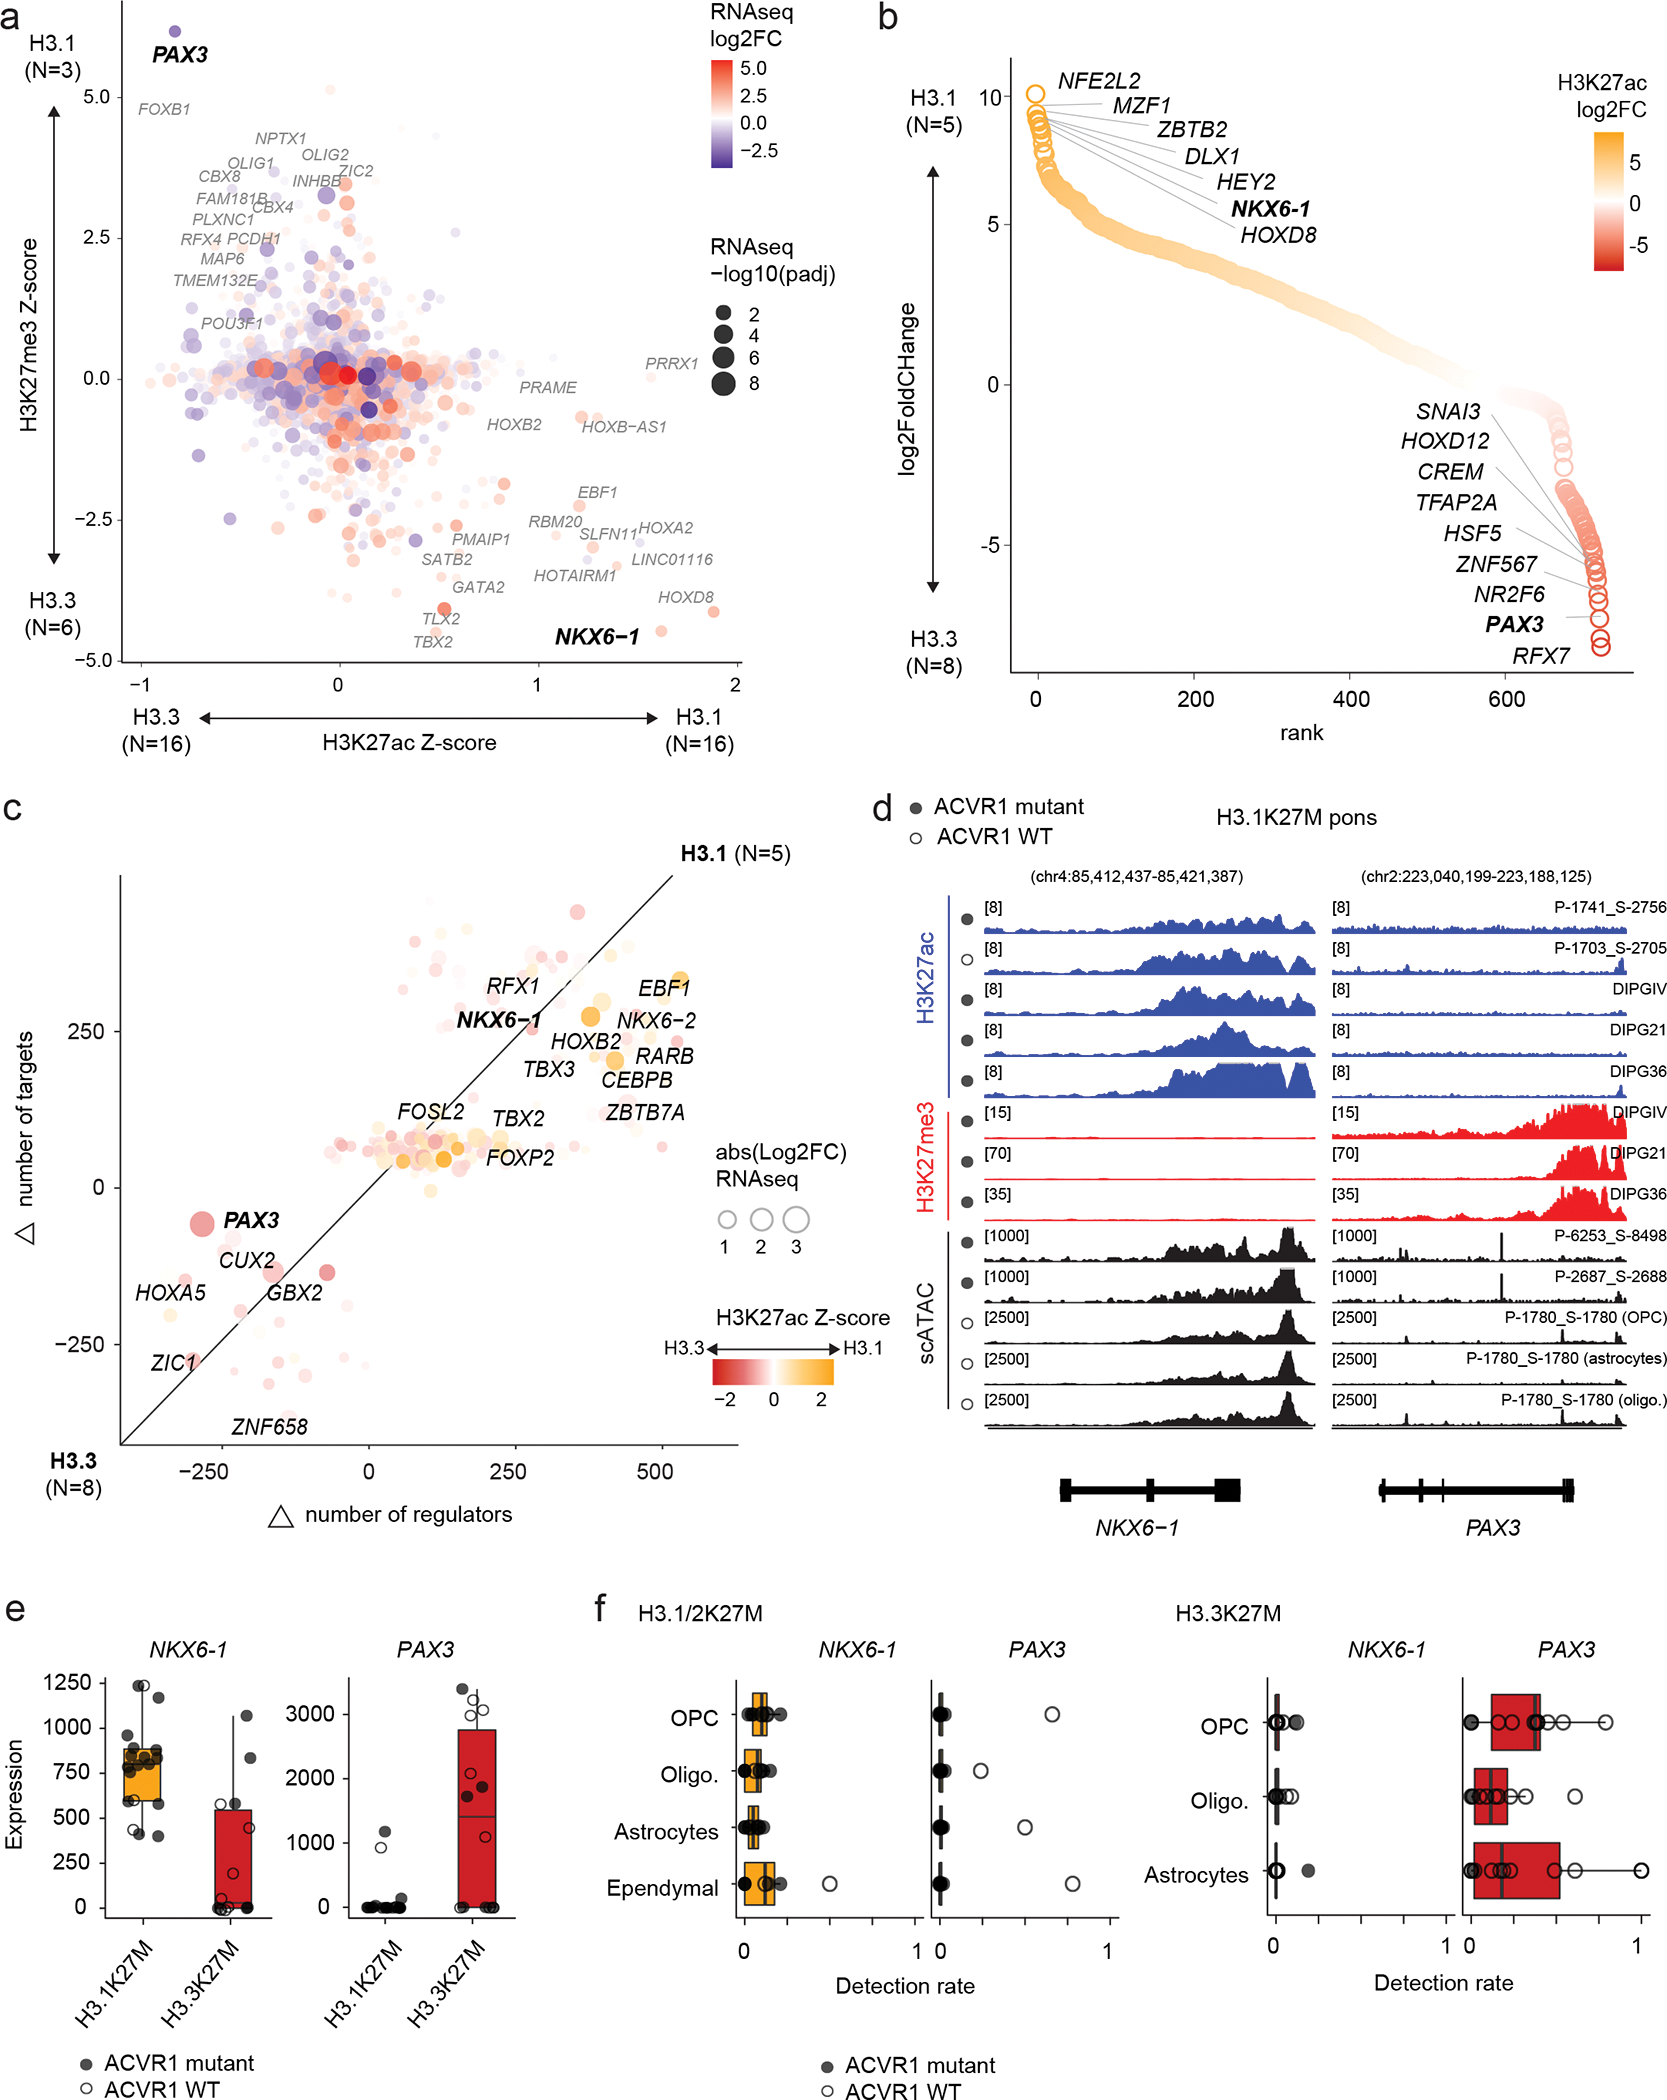
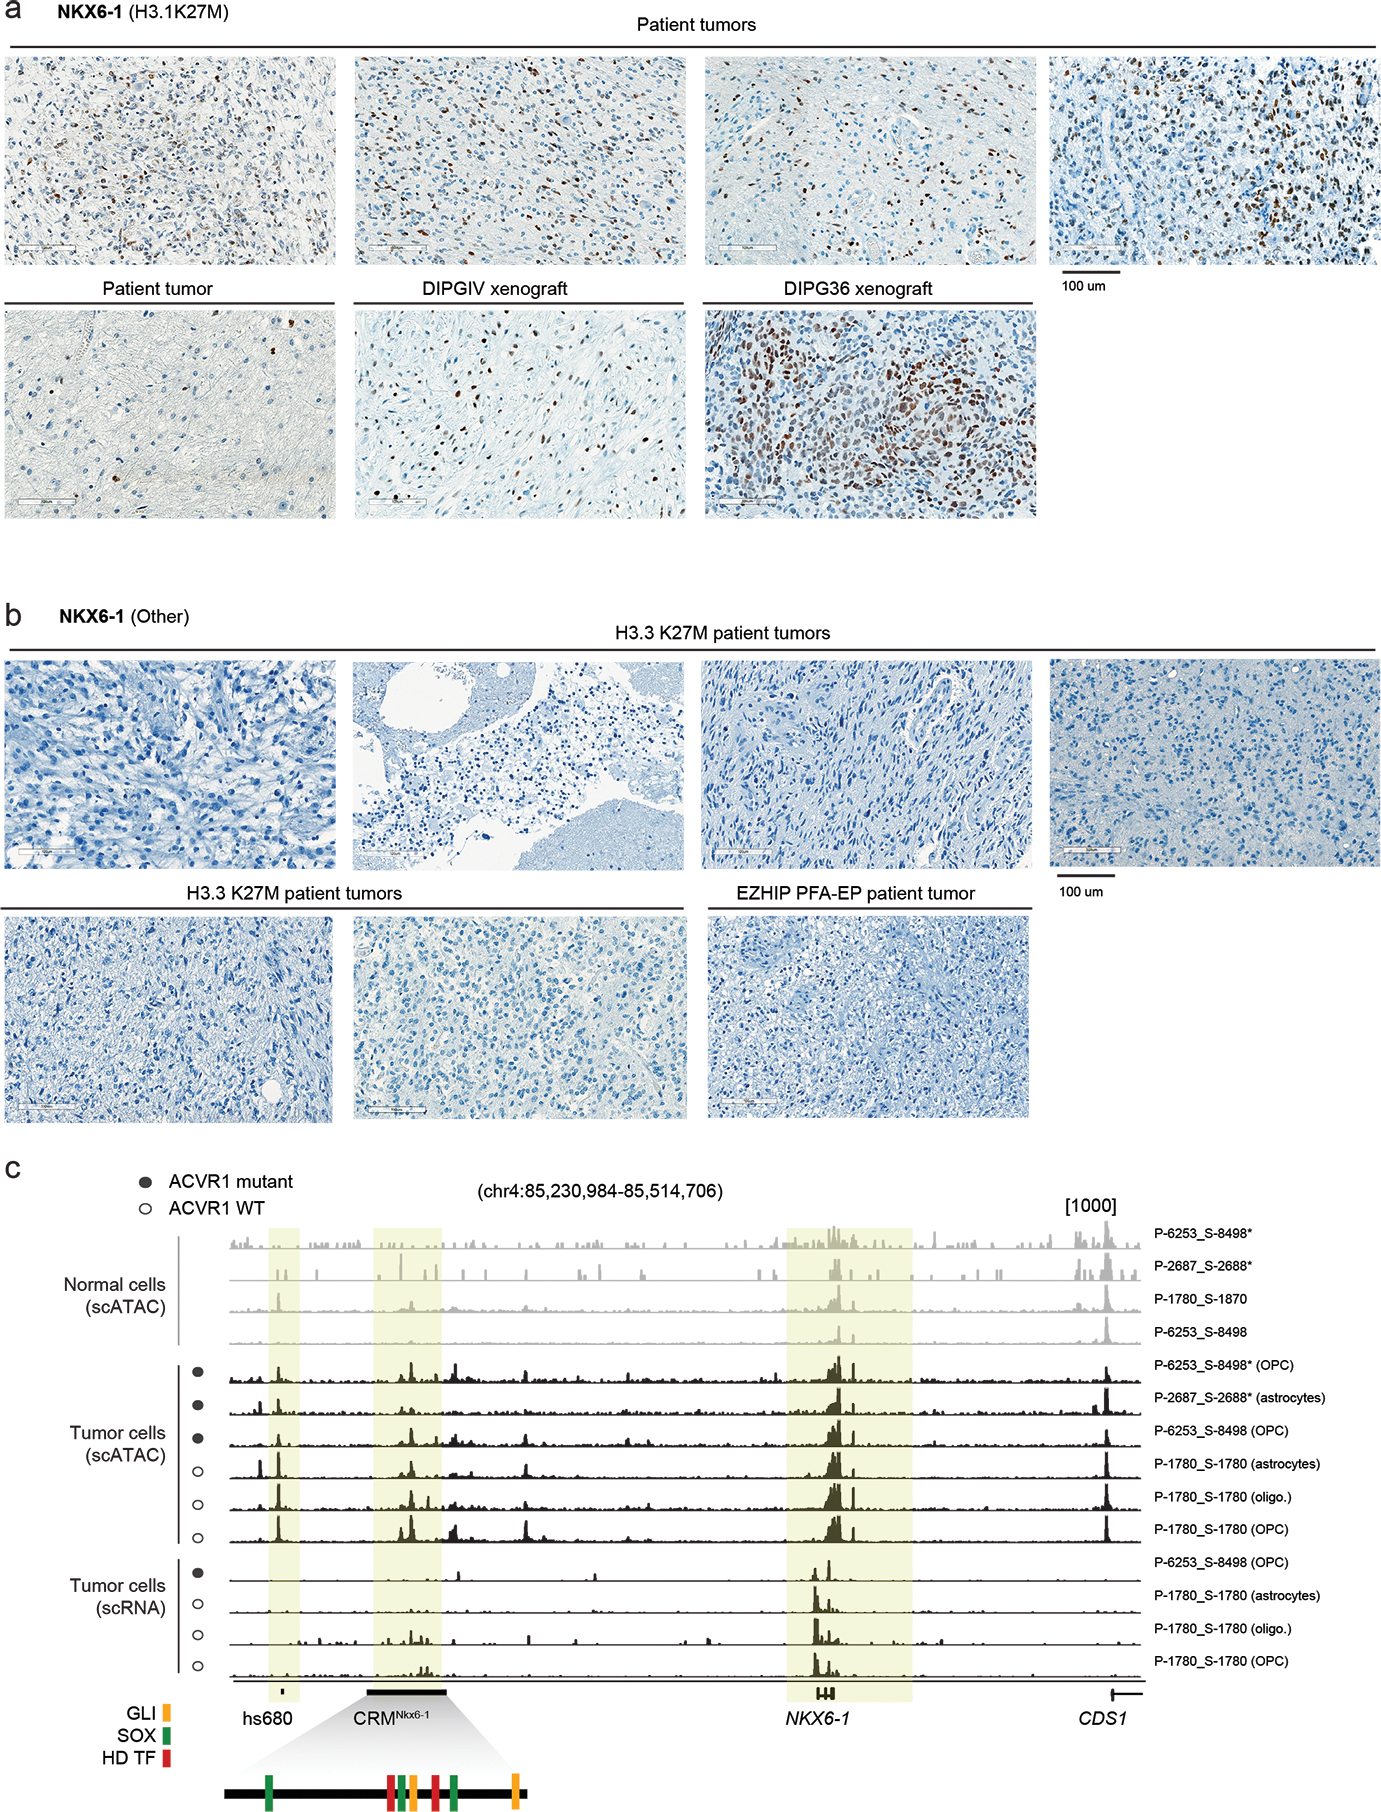
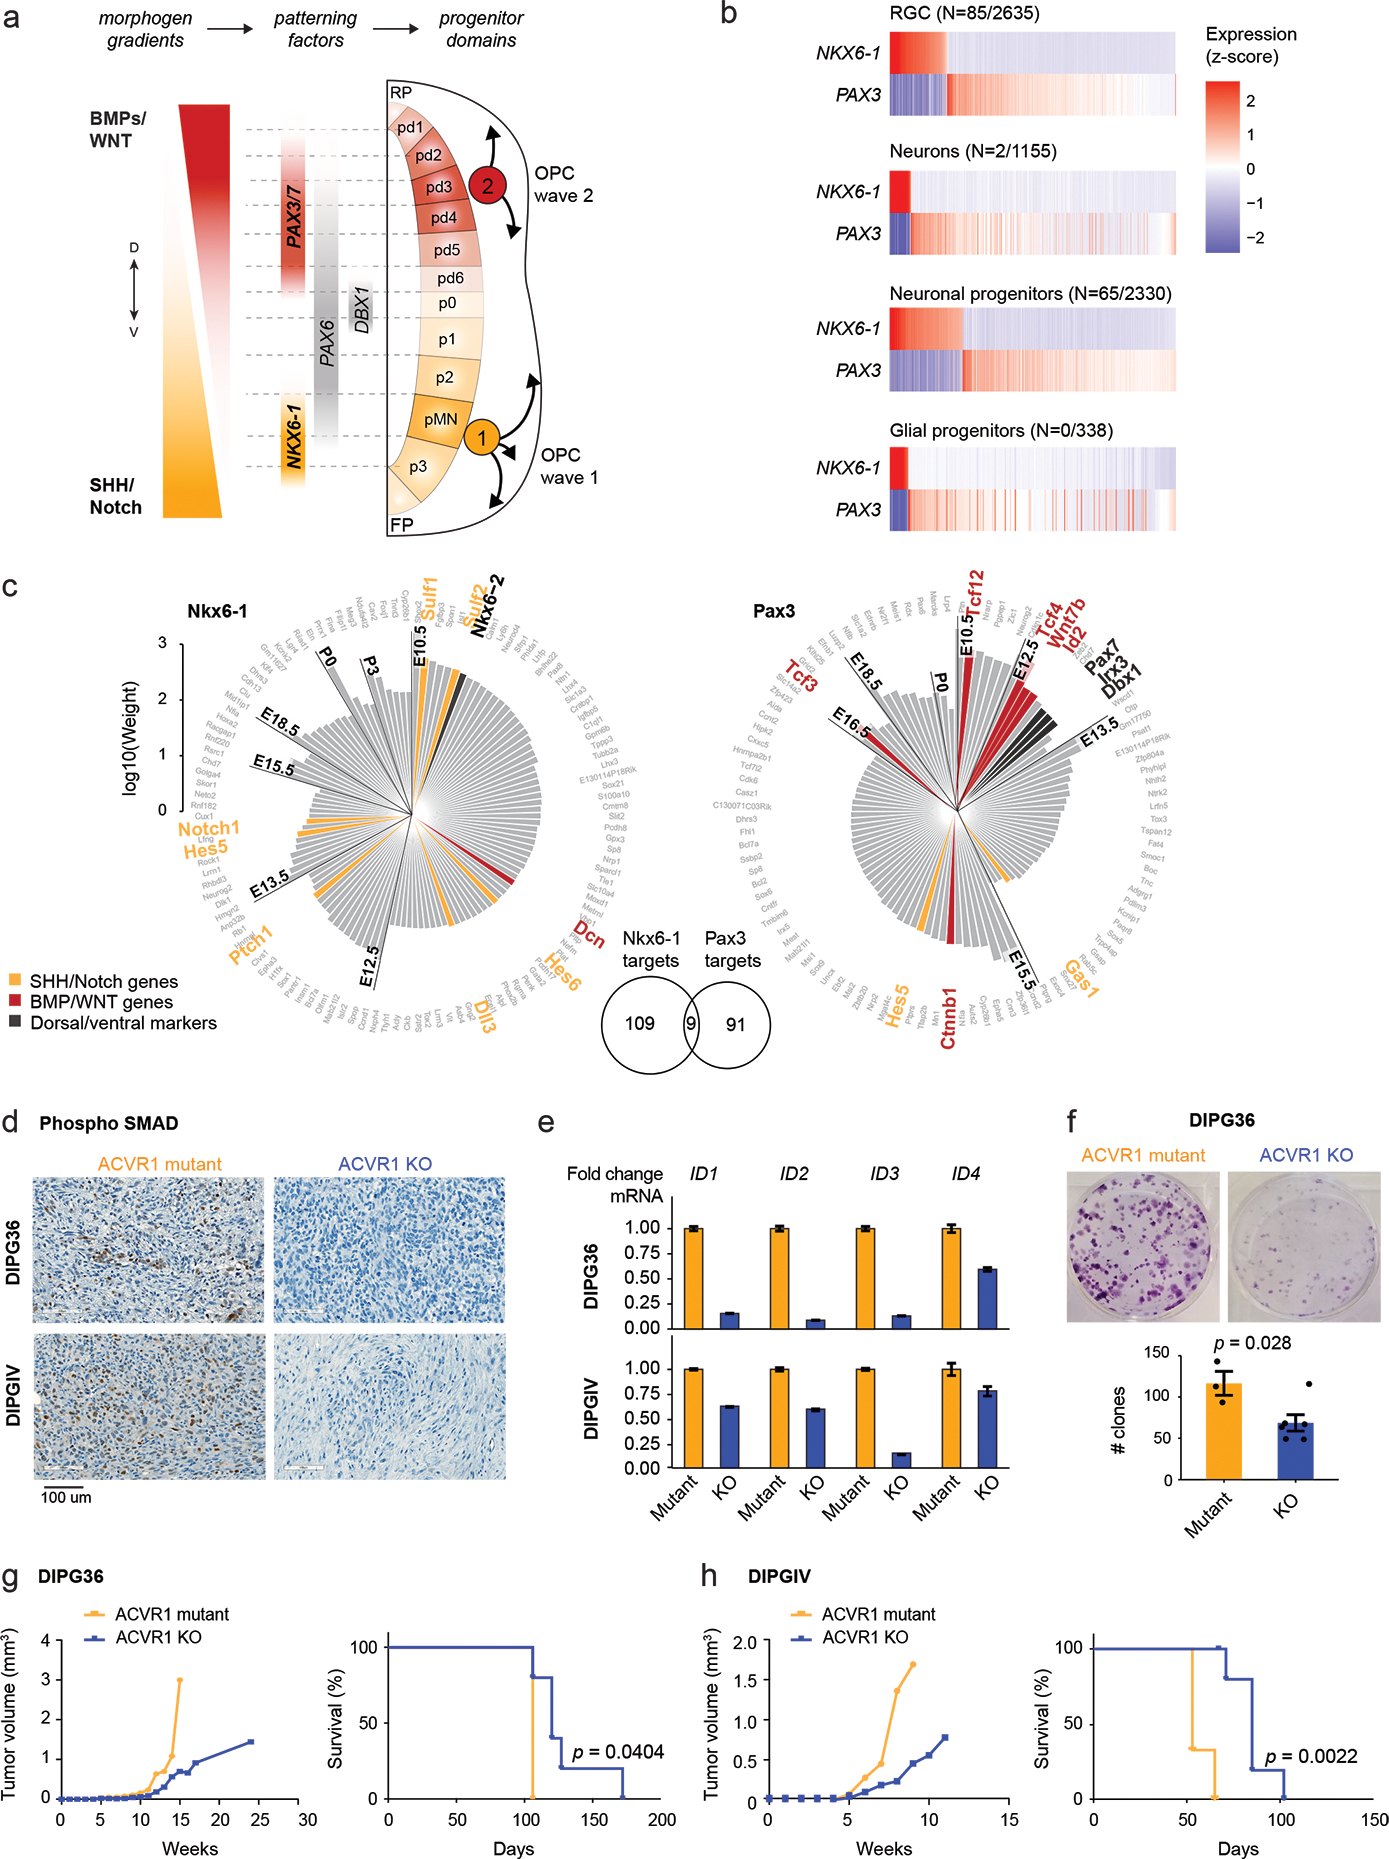
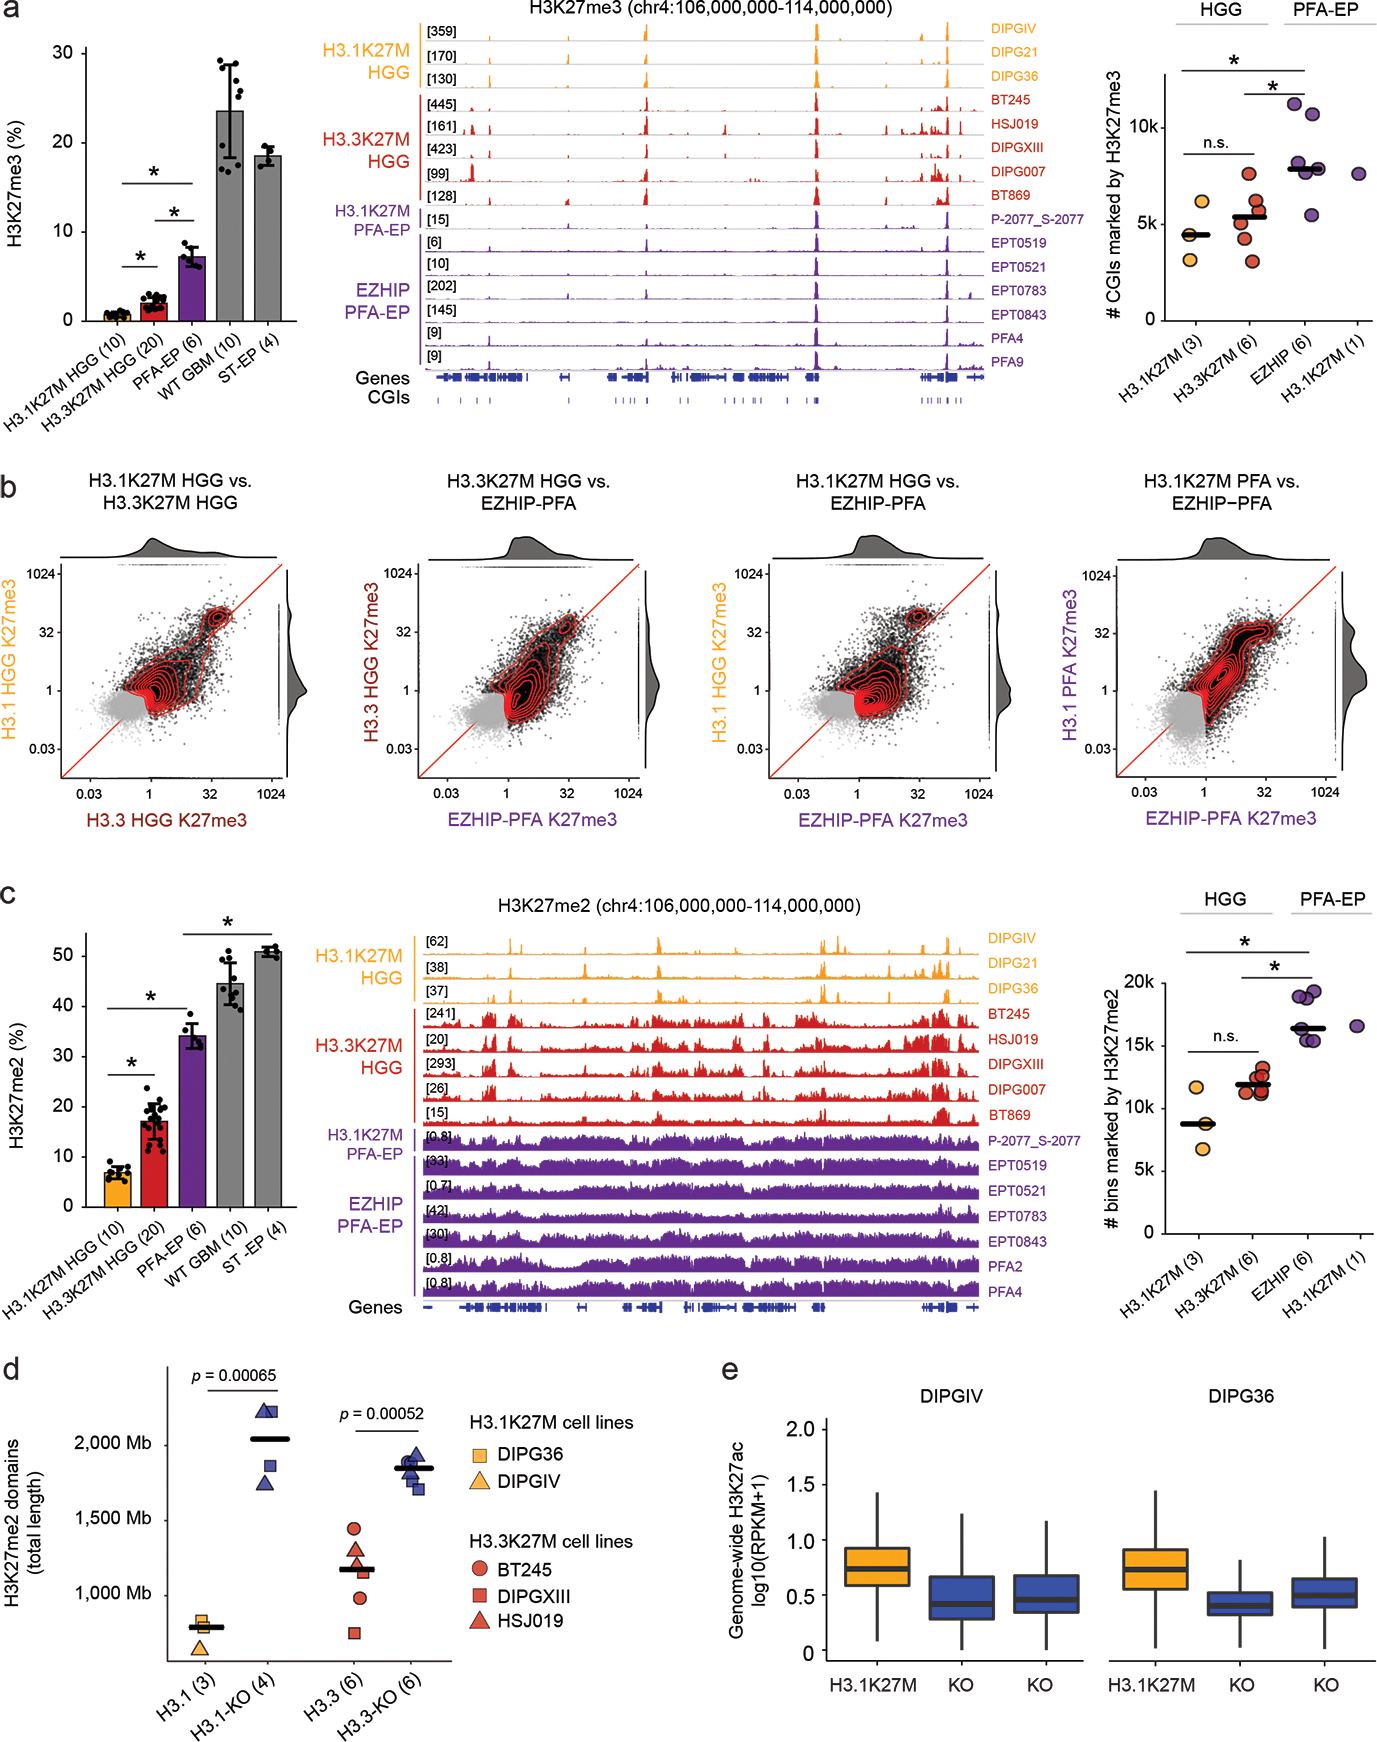
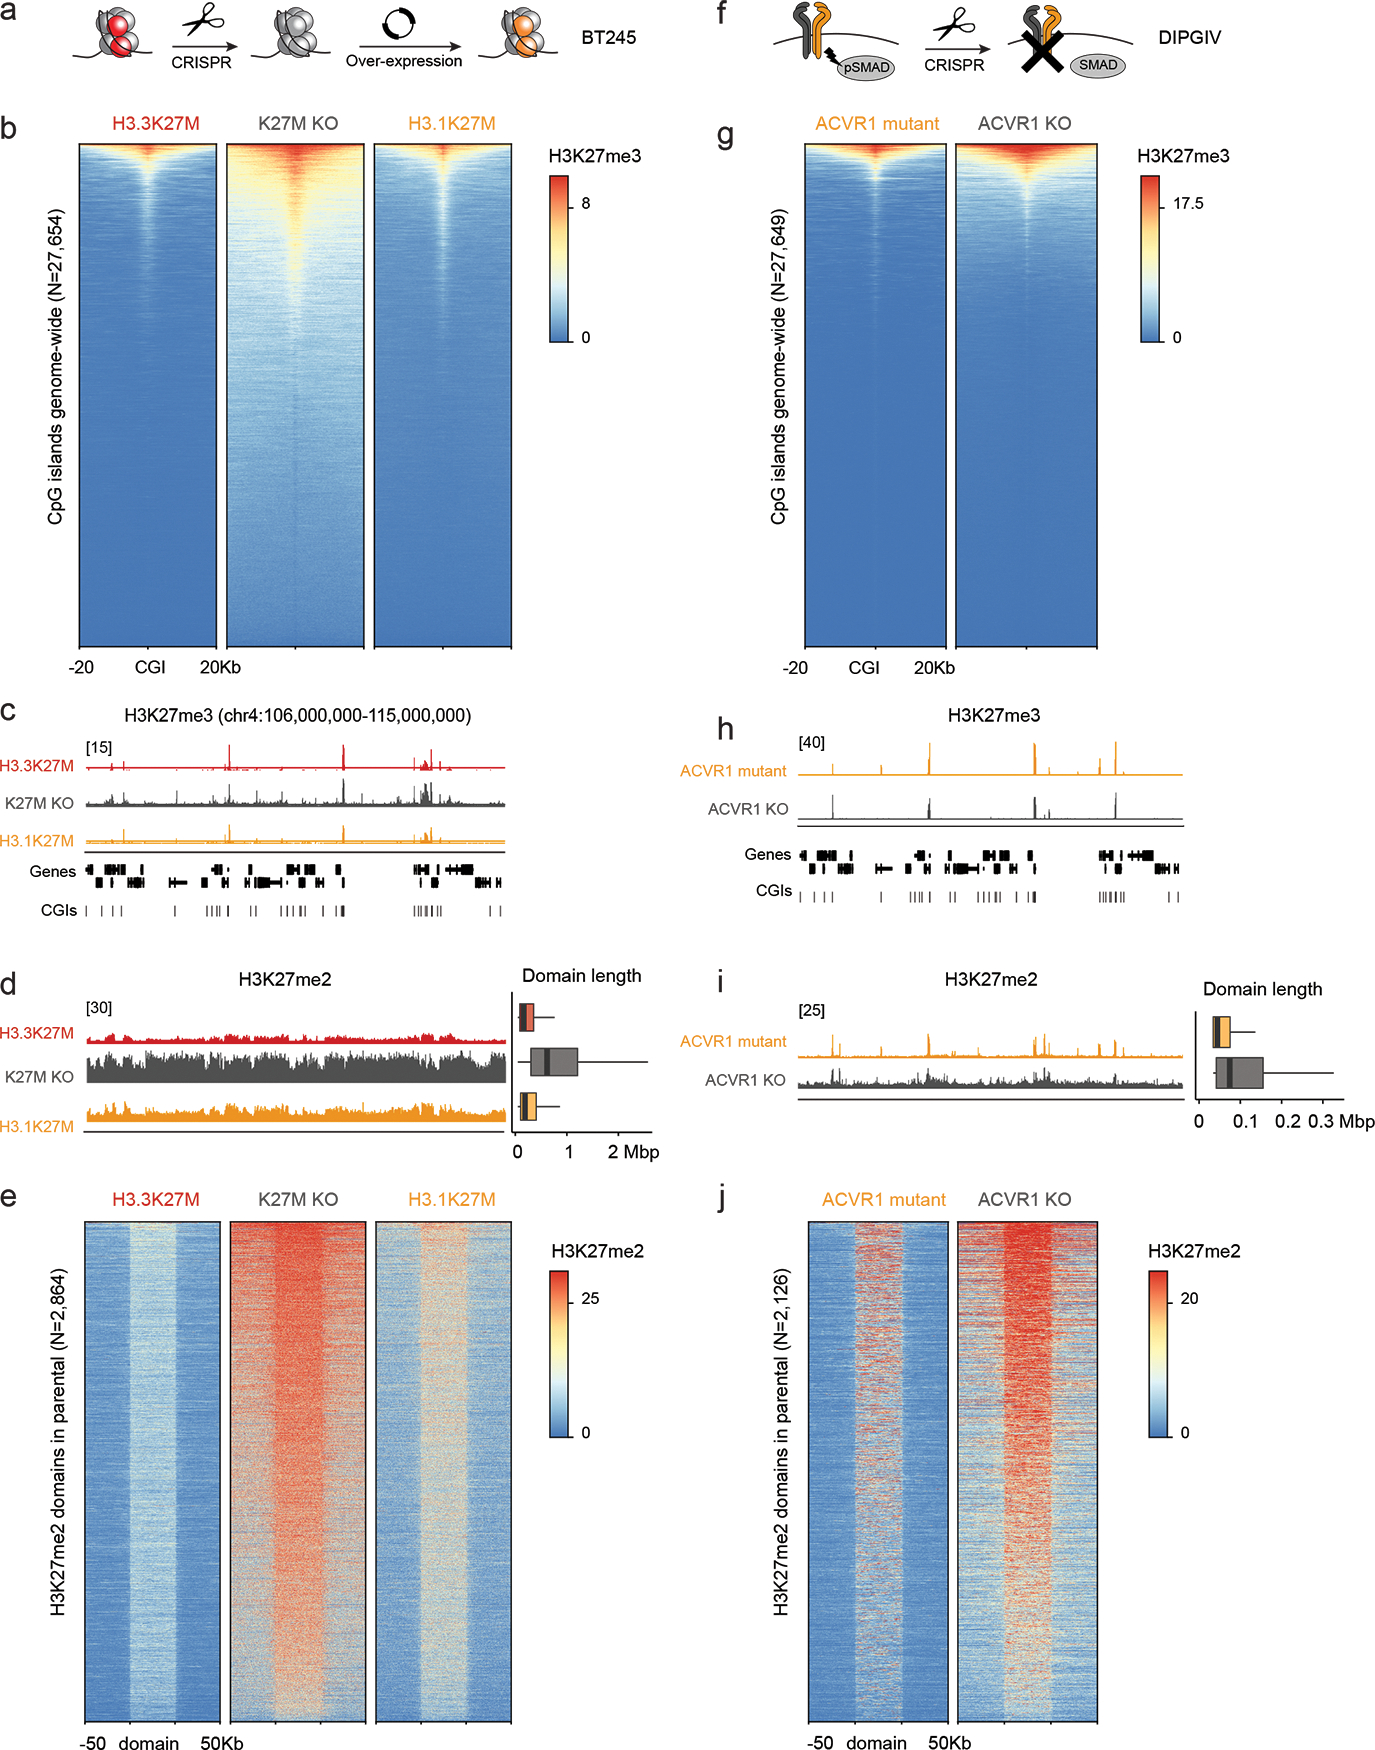
Canonical (H3.1/H3.2) and noncanonical (H3.3) histone 3 K27M-mutant gliomas have unique spatiotemporal distributions, partner alterations and molecular profiles. The contribution of the cell of origin to these differences has been challenging to uncouple from the oncogenic reprogramming induced by the mutation. Here, we perform an integrated analysis of 116 tumors, including single-cell transcriptome and chromatin accessibility, 3D chromatin architecture and epigenomic profiles, and show that K27M-mutant gliomas faithfully maintain chromatin configuration at developmental genes consistent with anatomically distinct oligodendrocyte precursor cells (OPCs). H3.3K27M thalamic gliomas map to prosomere 2-derived lineages. In turn, H3.1K27M ACVR1-mutant pontine gliomas uniformly mirror early ventral NKX6-1+/SHH-dependent brainstem OPCs, whereas H3.3K27M gliomas frequently resemble dorsal PAX3+/BMP-dependent progenitors. Our data suggest a context-specific vulnerability in H3.1K27M-mutant SHH-dependent ventral OPCs, which rely on acquisition of ACVR1 mutations to drive aberrant BMP signaling required for oncogenesis. The unifying action of K27M mutations is to restrict H3K27me3 at PRC2 landing sites, whereas other epigenetic changes are mainly contingent on the cell of origin chromatin state and cycling rate.


Conflict of interest statement

Competing Interests Statement

S.P. is a member of the advisory board for Bayer, Novartis and AstraZeneca and has received speaker fees from Bayer and Esai, outside of the submitted work. All other authors declare no competing interests.

Figures

Extended Data Fig. 1
Extended Data Fig. 1. Overview of expanded scRNAseq mouse developmental reference
a. Schematic of developing mouse brain, sagittal view, indicating regions and timepoints included in the single-cell reference atlas. Red: data generated in this study; black: data from Jessa et al, Nature Genetics, 2019. b. Number of cells captured in each time point and brain region after quality control and filtering. c. Overview of single-cell populations from the mouse pons. Dendrogram constructed based on pairwise Spearman correlations between mean expression profiles in each cluster. Cell class and time point are annotated. d. Overview of single-cell populations from the mouse forebrain. Dendrogram constructed based on pairwise Spearman correlations between mean expression profiles in each cluster. Cell class and time point are annotated.
Extended Data Fig. 2
Extended Data Fig. 2. Unique cell type hierarchies in H3.1 and H3.3K27M HGGs
a. Similarity matrix between all Non-negative Matrix Factorization (NMF) programs assigned to modules. Heatmap represents the pairwise overlap (in number of genes) between programs. b. Annotation of NMF programs. Top: Correlation between each program and QC or biological metrics in each cell. One module (M11) that was explained by technical factors (mitochondrial content and coverage), was consequently removed from further analyses. Bottom: overlap between each program and developmental or MSigDB reference signatures, one line per signature. Only significant overlaps (p-value < 0.001) are shown, and number of significant overlaps is shown in parentheses. c. Top 15 genes associated with each module. Module-associated genes were selected by identifying the most frequent program-associated genes for all programs contained in the module. d. UMAP for H3.3K27M thalamic HGG (malignant cells only), with cells coloured by consensus projected cell type based on the normal mouse brain reference (left), or the normal human fetal thalamus reference (right). Cells are colored as in Figure 1d. e. Confusion matrix comparing projected cell types for H3.3K27M thalamic HGG based on mouse or human reference. Proportions were computed row-wise and represent the fraction of cells from each mouse label which were assigned to each human label. Bubbles are scaled to the number of cells with each combination of labels.
Extended Data Fig. 3
Extended Data Fig. 3. Some H3.1K27M pontine gliomas harbour a malignant ependymal-like component
a-b. UMAP plots for two individual H3.1K27M pontine gliomas containing ependymal-like cells. Only malignant cells are shown. Cells are colored by consensus projected cell type. c-d. Heatmaps of copy-number signal computed for each individual sample using InferCNV. Row annotations correspond to cell type projections, indicating whether they are projected to ependymal cells (left, red), and the overall projected cell class, with colors as in (a) and normal cells colored in gray. Cells lacking a consensus projection were excluded. e-f. UMAP plots as in (a-b), with cells coloured by expression of FOXJ1 (ependymal transcription factor), DNAH12 (ciliary gene), and single-cell gene set enrichment (ssGSEA) score of candidate FOXJ1 targets in the early postnatal mouse brain. List of FOXJ1 targets was obtained from Jacquet et al, Development, 2009. g. NMF programs from Figure 1c, displaying only the overlap between program-associated genes with ependymal gene signatures, and filtering out all other developmental signatures. Top column annotation shows the driver alteration of the sample in which each program was identified. A second annotation highlighting H3.1/2K27M tumors is included for clarity. Module 10, significantly overlapping ependymal signatures, is enriched for programs from this tumor entity. h-i. Activity of the ependymal-related module 10 in individual samples. Top: UMAP plots as in (a-b), cells are coloured by the NMF activity score of the module 10 program from each sample. Bottom: heatmap of NMF score of module 10 program-associated genes; names for selected informative genes are indicated.
Extended Data Fig. 4
Extended Data Fig. 4. H3.1K27M, ACVR1-mutant pontine gliomas arise from an NKX6-1+ ventral brainstem progenitor
a. Volcano plot of differentially expressed genes between H3.3K27M pons and H3.3K27M thalamus HGG. HOX genes are indicated in purple. Only genes with mean normalized expression > 100 are included. b. Epigenomic state at NKX6-1 and PAX3 in representative H3.3K27M pons HGG primary tumors and cell lines. For scATACseq data, each track represents RPKM-normalized aggregated accessibility for one malignant single-cell population. c. Co-expression of NKX6-1 and PAX3 in bulk RNAseq data for pons HGG with each K27M histone variant.
Extended Data Fig. 5
Extended Data Fig. 5. Assessment of NKX6-1 in brain tumors and normal tissues
a. Immunohistochemistry staining of NKX6-1 protein in normal pancreas tissue as positive control. Arrowhead in left panel indicates region shown at higher magnification in right panel. b-d. Immunohistochemistry staining of NKX6-1 protein in Histone 3 WT, H3.3G34R, and H3.3K27M high-grade glioma patient tumors. e. Antibody staining of NKX6-1 in human tissues from the Human Protein Atlas. Detection levels for each cell type are indicated below, “-” indicates that NKX6-1 was not detected. Image credit: Human Protein Atlas. Images available from http://v21.proteinatlas.org (links provided in Supplementary Table 19). f. Left: In situ hybridization (ISH) in E13.5 mouse brain from the Allen Brain Atlas (© 2008 Allen Institute for Brain Science. Allen Developing Mouse Brain Atlas. Available from: developingmouse.brain-map.org). Right: quantification of ISH expression levels. g. Left: In situ hybridization (ISH) in P56 mouse brain from the Allen Brain Atlas (© 2004 Allen Institute for Brain Science. Allen Mouse Brain Atlas. Available from mouse.brain-map.org). Right: quantification of ISH expression levels. h. Bulk expression levels of NKX6-1 in adult human tissues from GTEx. Sample sizes for brain tissues are indicated.
Extended Data Fig. 6
Extended Data Fig. 6. Nkx6-1/Pax3 expression is mutually exclusive in the normal brain
a. Expression of NKX6-1 and Pax3 in cell types of the normal developing mouse pons reference, showing their expression is largely mutually exclusive. The number of cells where both NKX6-1 and Pax3 are detected out of the total number of NKX6-1+ or Pax3+ cells of the cell type is indicated in parentheses. b. Expression of NKX6-1 target genes with high cell type specificity in ependymal cells. Dendrogram represents cell clusters in the single-cell mouse pons reference, as in Figure S1. c. Cell type-specificity score for inferred targets of NKX6-1 and Pax3 in the normal mouse pons. For a given gene, score represents the difference between the highest detection rate of the gene in any single-cell cluster in the normal mouse reference, and the detection rate of the gene in all other cells in the same sample (see Methods).
Extended Data Fig. 7
Extended Data Fig. 7. H3K27M and EZHIP converge to restrict H3K27me3 to PRC2 nucleation sites
a. Percentage of H3K27me3-marked 10kb bins overlapping CGIs or SUZ12 peaks in cell lines and tumors. Number of biologically independent samples per group is indicated in parentheses. H3K27me3 was quantified in 10kb bins genome-wide and the top 1% bins with highest H3K27me3 in each sample were intersected with CGIs/SUZ12 peaks. For SUZ12, the union of peaks called from SUZ12 ChIPseq in BT245 and DIPGXIII were obtained from Harutyunyan et al, Nature Communications, 2019. Crossbar indicates the median. P-values: left panel (H3.1K27M vs WT GBM, p = 0.024; H3.3K27M vs WT GBM, p = 0.026; PFA-EP vs WT GBM, 0.00099); right panel (H3.1K27M vs WT GBM, p = 0.063; H3.3K27M vs WT GBM, p = 0.023; PFA-EP vs WT GBM, p = 0.0016); n.s., not significant; Welch two-sample t-test. b. Scatterplots of H3K27me2 signal over 100kb bins genome-wide in pairwise group comparisons. X- and Y- axes represent log2 mean RPKM value per group, normalized by input. Marked bins (mean RPKM > 1 in at least one of the groups in each comparison) are shown in black, while unmarked bins are shown in gray. Joint density and marginal distributions are calculated over marked bins only. Red line indicates the diagonal. RPKM values of H3K27me2 were divided by the respective input sample RPKM and averaged for all samples in the same mutation group using a geometric mean. c. H3K27me3 (top) and H3K27me2 (bottom) ChIP-seq enrichment tracks, in representative K27M-mutant and isogenic CRISPR-KO cell lines. d. Mass spectrometry data of H3K27ac in cell. Number of biologically independent samples per group is indicated in parentheses. Error bars represent mean +/− SD. P-values: H3.1K27M vs WT GBM, 0.0074; H3.3K27M vs WT GBM: 5.3×10⁻⁵; n.s., not significant; Welch two-sample t-test. e. Enrichment of H3K27ac over different repeat element families in HGG cell lines and isogenic K27M-KO counterparts.
Extended Data Fig. 8
Extended Data Fig. 8. Cell-of-origin chromatin state contributes to the tumor epigenome
a. Schematic of analysis. Single-cell epigenomic data for normal mouse OPCs and ependymal cells was obtained from Zhu et al, Nature Biotechnology, 2021, and used to extract cell type-specific epigenomic features. Tumors were clustered based on H3K27ac levels at promoters of these genes. b. Hierarchical clustering of H3.1K27M HGG, H3.1K27M PFA-EP, and EZHIP PFA-EP based on OPC and ependymal-specific epigenomic features. Select features are indicated. c. Top: RNA and single-cell epigenomic data for normal mouse OPCs and ependymal cells at ependymal & OPC genes. Bottom: H3K27ac ChIPseq tracks for H3.1K27M HGG, H3.1K27M PFA-EP, and EZHIP PFA-EP at the same genes as in the top panel. Chromosome coordinates are indicated in Supplementary Table 15.
Extended Data Fig. 9
Extended Data Fig. 9. Uncoupling the effect of histone variants from cell-of-origin chromatin state and cycling rate
a. Validation of CRISPR removal of ACVR1 in H3.1K27M ACVR1-mutant cell lines by MiSeq (multiple deletions on both alleles (complete KO)). b. Validation of CRISPR removal of H3K27M in H3.1K27M cell lines DIPGIV and DIPG36 (1bp deletion on K27M allele (frameshift)) and DIPG21 (2bp deletion on K27M allele) by MiSeq and Western Blot. For Western Blot, G477, an H3.1WT HGG patient-derived cell line, was used as control. CRISPR removal of H3K27M in H3.3K27M cell lines has been reported previously for BT245 and DIPGXIII in Krug et al, Cancer Cell, 2019; and for HSJ019 in Harutyunyan et al, Cell Reports, 2020. c. Doubling time of H3.3K27M and H3.1K27M HGG cell lines (DIPGXIII, N=4 biological replicates; HSJ019, N=3; DIPG36, N=9; DIPGIV, N=12). Error bars represent mean +/− SD. d. Doubling time of H3.1K27M cell line DIPGIV in ACVR1 mutant and ACVR1-KO conditions. Error bars represent mean +/− SD. e. Schematic of experimental design. f. Heatmap showing distribution of Rx-normalized ChIPseq signal for H3K27me3 in DIPGXIII at CpG islands (CGIs), flanked by 20kbp on either side. g. Rx-normalized H3K27me3 tracks in each condition at a representative genomic region. Y-axis limit is indicated in brackets and identical for all tracks. h. Left: Rx-normalized H3K27me2 tracks in each condition at the same region as in (g). Y-axis limit is indicated in brackets and identical for all tracks. Right: genome-wide distribution of H3K27me2 domain length in each condition (H3.3K27M, N=16,630 domains; K27M-KO, N=3388; H3.1K27M, N=11,568). i. Heatmap showing distribution of Rx-normalized ChIPseq signal for H3K27me2 in DIPGXIII H3K27me2 domains across the genome in each condition. Domains are scaled to 50kb, and flanked by 50kb on either side. The maximum of the color scale is set to the 90th percentile value across all data points.
Figure 1.
Figure 1.. Unique cell type hierarchies in H3.1 and H3.3K27M HGGs
a. Patient tumors (N=116 tumors from 112 patients) and patient-derived cell lines (N=22) included in this study. Black dots indicate that this study provides unpublished data for at least one sample for the corresponding assay/sample. Chromatin accessibility: 10x ATAC or 10x Multiome (ATAC & RNA). HGG: high-grade glioma; PFA-EP: posterior fossa ependymoma. b. Workflow for unsupervised identification of recurrent gene programs in malignant cells using consensus Non-negative Matrix Factorization (cNMF). c. Top: heatmap of NMF scores for all module-associated genes, across all programs. Column annotation shows the driver alteration of the sample in which each program was identified, colored as in (a). Middle: Correlation between each program and ribosomal content in each cell, and G2/M cell cycle score in each cell. Bottom: overlap between each program and developmental reference signatures, one line per signature. Only significant overlaps (empirical p-value < 0.001; see Methods and Supplementary Table 10) are shown, with number of significant overlaps indicated in parentheses. d. UMAP for malignant cells of each tumor type. Projected cell types were obtained by mapping each individual tumor cell to a normal developmental brain reference, using a consensus of automated cell type prediction methods. Cells without a consensus label but with high G2/M cell cycle phase score are shown in orange. e. Top: number of malignant cells per sample, for each tumor type as in (d). Bottom: quantification of consensus cell type projections among malignant cells. ACVR1 mutation status and tumor location are indicated below. Asterisk (*) denotes the single H3.1K27M-mutant sample among PFA-EP tumors.
Figure 2.
Figure 2.. Chromatin architecture of HOX clusters implicates distinct progenitor domain origins
a. Promoter-associated H3K27ac and H3K27me3 over all expressed genes. Axes represent enrichment of each mark in H3.3K27M thalamic vs H3.3K27M pons HGG (Z-score, see Methods and Data Availability). Log2FC: log2 fold-change; padj: adjusted p-value (negative binomial Wald test, Benjamini-Hochberg correction). b. Top: Schematic of organization of HOX clusters along the linear genome. Bottom: Schematic of HOX expression patterns in the developing embryo (left) and specifically in the hindbrain (right). c. Epigenomic state at HoxD cluster in mESC-derived cervical motor neurons, data from Narendra et al, Science, 2015). Y-axis limits are indicated in brackets. d. Top: Hi-C heatmaps depicting chromatin conformation structure at the HOXD cluster in tumors (PFA-EP) or cell lines (H3.3K27M HGG). Heatmaps represent the log2 ratio of observed vs expected chromatin interactions, at 10kb resolution. Bottom: tracks for bulk RNAseq and H3K27ac, H3K27me3, SUZ12, and CTCF ChIPseq data for representative samples. Y-axis limits are indicated in brackets. Sample IDs are indicated at right. e. Bulk RNAseq levels, promoter H3K27ac, and promoter H3K27me3 at each HOX gene in each tumor type. Heatmaps represent median RPKM in samples of each tumor type; for each data type (H3K27ac and H3K27me3), this median value is scaled to [0,1] across all HOX genes. Sample sizes for each tumor/data type are indicated in parentheses. f. Epigenomic state at HOXD cluster for representative H3.1K27M pons and H3.3K27M pons HGG, indicating a distinct boundary between active and inactive chromatin states. For scATACseq data, each track represents RPKM-normalized aggregated accessibility for a tumor single-cell population. Y-axis limits are indicated in brackets.
Figure 3.
Figure 3.. H3.3K27M thalamic gliomas arise from the thalamus proper
a. Schematic of the developing diencephalon, indicating three embryonal segments (prosomeres, p1–3) and patterning genes that mark each prosomere. b. H3K27ac and H3K27me3 ChIPseq data and scATACseq for H3.3K27M thalamic HGG primary tumors and cell lines, showing activation of genes marking p2 (the thalamus proper), but silencing of genes marking p3 (the pre-thalamus). Y-axis limit for each sample is indicated in brackets. For scATACseq data, each track represents RPKM-normalized aggregated accessibility for one tumor single-cell population; the percentage of malignant cells where chromatin accessibility in the region was detected (>1 fragment) is indicated for each gene. Chromosome coordinates are indicated in Supplementary Table 15.
Figure 4.
Figure 4.. H3.1K27M ACVR1-mutant gliomas mirror a SHH-specified NKX6-1+ progenitor
a. Promoter-associated H3K27ac and H3K27me3 over all expressed genes. Axes represent enrichment of each mark in H3.1K27M pons vs H3.3K27M pons HGG (Z-score, see Methods and Data Availability). Log2FC: log2 fold-change; padj: adjusted p-value (negative binomial Wald test, Benjamini-Hochberg correction). b. Differential enhancer analysis, based on H3K27ac peaks, between H3.1 and H3.3K27M pons HGG. Enhancers are ranked by log2 fold-change of H3K27ac as in (a). c. Differences in core regulatory circuitry (CRC) between H3.1K27M pons and H3.3K27M pons HGG. X-axis represents differences in number of genes regulating each transcription factor (TF), and y-axis represents differences in number of targets of each TF. d. Epigenomic state at NKX6-1 and PAX3 in representative H3.1K27M pons tumors and cell lines. For scATACseq data, each track represents RPKM-normalized aggregated accessibility for one malignant single-cell population. Y-axis limits are indicated in brackets. e. Bulk RNAseq expression levels of NKX6-1 and PAX3 for all pons tumors, by histone 3 variant (H3.1K27M, N=19 patients; H3.3K27M, N=14). f. Detection levels of NKX6-1 and PAX3 in malignant cells for all pons tumors in the scRNAseq cohort, stratified by projected cell type, for each histone 3 variant (H3.1K27M, N=8 patients; H3.3K27M, N=16). Cells without a consensus projection and cell types comprising less than 5% of the dataset for each tumor type were excluded.
Figure 5.
Figure 5.. NKX6-1 is activated in H3.1K27M HGG
a. Immunohistochemistry staining of NKX6-1 in H3.1K27M HGG samples including patient tumors (N=5) and xenografts derived from the H3.1K27M patient-derived cell lines DIPGIV and DIPG36. b. Immunohistochemistry for NKX6-1 protein in H3.3K27M HGG patient tumors (N=7). c. Single-cell chromatin accessibility and RNA tracks for H3.1K27M pons HGG at the NKX6-1 locus. Each track represents RPKM-normalized aggregated accessibility/expression for one single-cell population. Normal cells and malignant cells are indicated. Asterisk (*) denotes tracks from scATAC data, all others are from scMultiome data. VISTA enhancer hs680 and NKX6-1 cis-regulatory module (CRMNkx6-1) are indicated. Schematic of CRMNkx6-1 indicates binding sites for SHH effector GLI transcription factors, SOX transcription factors, and homeodomain transcription factors, identified by Oosterveen et al, Developmental Cell, 2012.
Figure 6.
Figure 6.. ACVR1 mutations confer oncogenic BMP signalling in H3.1K27M HGG
a. Schematic of coronal section of the developing hindbrain/neural tube, depicting ventral (V; NKX6-1+) and dorsal (D; PAX3+) waves of oligodendrocyte generation during development. RP, roof plate. pd, dorsal progenitor domain. p, ventral progenitor domain. pMN, progenitor of motor neurons domain. FP, floor plate. b. Scaled scRNAseq expression (Z-score across cells) of NKX6-1 and PAX3 in cell types of the normal human fetal hindbrain (N=79,428 cells, 11 donors), showing their expression is largely mutually exclusive. The number of cells where both NKX6-1 and PAX3 are detected out of the total number NKX6-1+ or PAX3+ cells of the cell type is indicated in parentheses. c. Targets of NKX6-1 and Pax3 extracted from gene regulatory networks inferred from scRNAseq data of E10-P6 mouse pons. Each bar represents one target, and the height of the bar represents the edge weight between the TF and the target. Targets are plotted clockwise from top, in order of the earliest time point at which they are detected as a target. d. Immunohistochemistry staining of phosphorylated SMAD in mouse xenografts from the H3.1K27M DIPG cell lines DIPG36 and DIPGIV. Left: ACVR1 mutant line, right: isogenic cell line with CRISPR-based removal of ACVR1. e. ddPCR for ID genes in DIPG36 and DIPGIV ACVR1 mutant and ACVR1 KO lines. Data are represented as the fold change +/− SD, based on N=3 technical replicates per cell line per condition. f. Clone-formation assay for DIPG36 (ACVR1 mutant) and isogenic ACVR1 KO lines (ACVR1 mutant, N=3 biological replicates; ACVR1 KO, N=6; p-value = 0.028, 2-tailed t-test). Error bars represent mean values +/− SEM. g-h. Tumor volume evolution and survival of mouse xenograft cohorts generated from DIPG36 (ACVR1 mutant, N=3 mice; ACVR1 KO, N=5 mice; p-value = 0.0404, log-rank test) and DIPGIV (ACVR1 mutant, N=3 mice; ACVR1 KO, N=6 mice; p-value = 0.0022, log-rank test).
Figure 7.
Figure 7.. H3K27M and EZHIP converge to restrict H3K27me3 to PRC2 nucleation sites
a. Profiling of H3K27me3. Left: Mass spectrometry data of H3K27me3 in cell lines. Number of biologically independent samples per group is indicated in parentheses. WT GBM: H3 wild-type glioblastoma. ST-EP: EZHIP wild-type supratentorial ependymoma. Error bars: mean +/− SD. P-values (Welch two-sample t-test): H3.1K27M vs H3.3K27M, p = 5.3×10⁻⁸; H3.1K27M vs PFA-EP, p = 1.6×10⁻⁵; H3.3K27M vs PFA-EP, p = 2.6×10⁻⁵. Middle: H3K27me3 ChIP-seq enrichment tracks over representative genomic region. Right: Number of H3K27me3-marked CGIs genome-wide. Crossbar indicates the median. P-values (Welch two-sample t-test): H3.1K27M vs. EZHIP PFA, p = 0.022; H3.1K27M vs. H3.3K27M, p = 0.55; H3.3K27M vs EZHIP PFA, p = 0.010. b. Scatterplots of H3K27me3 signal over CGIs genome-wide in pairwise group comparisons. X- and Y- axes represent log2 mean RPKM value per group, normalized by input. Marked CGIs (mean RPKM > 1 in at least one groups in each comparison) are shown in black, while unmarked CGIs are shown in gray. Joint density and marginal distributions are calculated over marked CGIs only. Red line indicates the diagonal. c. Profiling of H3K27me2. Left and middle panels: as in (a). P-values (Welch two-sample t-test): H3.1K27M HGG vs H3.3K27M HGG: p = 8.4×10⁻¹²; H3.1K27M vs PFA-EP: p = 1.0×10⁻⁷; PFA-EP vs ST-EP: p = 1.6×10⁻⁶. Right panel: Number of H3K27me2-marked 100kb-bins genome-wide. Crossbar indicates the median. P-values (Welch two-sample t-test without correction): H3.1K27M vs. EZHIP PFA, p = 0.014; H3.1K27M vs. H3.3K27M, p = 0.17; H3.3K27M vs EZHIP PFA, p = 1.8×10⁻⁵. d. Total length of genome covered by H3K27me2 domains in K27M-mutant cell lines and isogenic K27M-KO lines. Domains were identified using a segmentation algorithm (see Methods). Crossbar indicates the median. P-values (Welch two-sample t-test without correction): H3.1K27M vs KO, p = 0.00065; H3.3K27M vs KO; p = 0.00052. e. Distribution of H3K27ac in 1Mb bins genome-wide in isogenic H3.1K27M HGG cell lines DIPGIV and DIPG36.
Figure 8.
Figure 8.. Uncoupling the effect of histone variants from cell-of-origin chromatin state and cycling rate
a. Schematic of experimental design. b. Heatmap showing distribution of Rx-normalized ChIPseq signal for H3K27me3 in BT245 at CpG islands (CGIs), flanked by 20kb on either side. c. Rx-normalized H3K27me3 tracks in each condition at a representative genomic region. Y-axis limit is indicated in brackets and identical for all tracks. d. Left: Rx-normalized H3K27me2 tracks in each condition at the same region as in (c). Y-axis limit is indicated in brackets and identical for all tracks. Right: genome-wide distribution of H3K27me2 domain length in each condition (H3.3K27M, N=8436 domains; K27M KO, N=3782; H3.1K27M, N=8200). e. Heatmap showing distribution of Rx-normalized ChIPseq signal for H3K27me2 in BT245 at H3K27me2 domains across the genome in each condition. Domains are scaled to 50kb and flanked by 50kb on either side. The maximum of the color scale is set to the 90th percentile value across all data points. f. Schematic of experimental design. g-j. Analysis of H3K27me3/2 in DIPGIV ACVR1 mutant and KO conditions as in (b-e). For genome-wide distribution of H3K27me2 domains length (ACVR1 mutant, N=11,736 domains; ACVR1 KO, N=10,614).

References

    1. Krug B, Harutyunyan AS, Deshmukh S & Jabado N Polycomb repressive complex 2 in the driver’s seat of childhood and young adult brain tumours. Trends Cell Biol. (2021) doi:10.1016/j.tcb.2021.05.006. - DOI - PMC - PubMed
    1. Khuong-Quang D-A et al. K27M mutation in histone H3.3 defines clinically and biologically distinct subgroups of pediatric diffuse intrinsic pontine gliomas. Acta Neuropathol. 124, 439–447 (2012). - PMC - PubMed
    1. Schwartzentruber J et al. Driver mutations in histone H3.3 and chromatin remodelling genes in paediatric glioblastoma. Nature 482, 226–231 (2012). - PubMed
    1. Pajtler KW et al. Molecular heterogeneity and CXorf67 alterations in posterior fossa group A (PFA) ependymomas. Acta Neuropathol. 136, 211–226 (2018). - PMC - PubMed
    1. Wu G et al. Somatic histone H3 alterations in pediatric diffuse intrinsic pontine gliomas and non-brainstem glioblastomas. Nat. Genet. 44, 251–253 (2012). - PMC - PubMed

Methods-only references

    1. Stuart T et al. Comprehensive Integration of Single-Cell Data. Cell 177, 1888–1902.e21 (2019). - PMC - PubMed
    1. McInnes L & Healy J UMAP: Uniform Manifold Approximation and Projection for Dimension Reduction. arXiv [stat.ML] (2018).
    1. Waltman L & van Eck NJ A smart local moving algorithm for large-scale modularity-based community detection. The European Physical Journal B 86, 71 (2013).
    1. Nagy C et al. Single-nucleus transcriptomics of the prefrontal cortex in major depressive disorder implicates oligodendrocyte precursor cells and excitatory neurons. Nat. Neurosci. 23, 771–781 (2020). - PubMed
    1. Tirosh I et al. Dissecting the multicellular ecosystem of metastatic melanoma by single-cell RNA-seq. Science 352, 189–196 (2016). - PMC - PubMed

Publication types