. 2022 Dec;54(12):1907-1918.
doi: 10.1038/s41588-022-01232-7. Epub 2022 Dec 5.

Cohesin and CTCF control the dynamics of chromosome folding

Affiliations

Cohesin and CTCF control the dynamics of chromosome folding

Pia Mach et al. Nat Genet. 2022 Dec.

Abstract

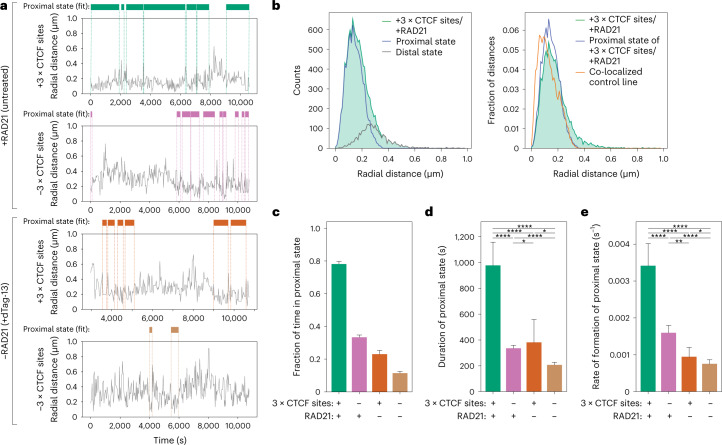
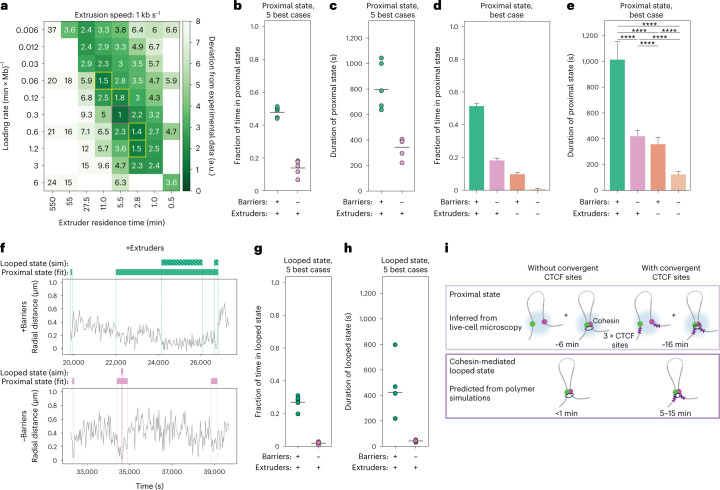
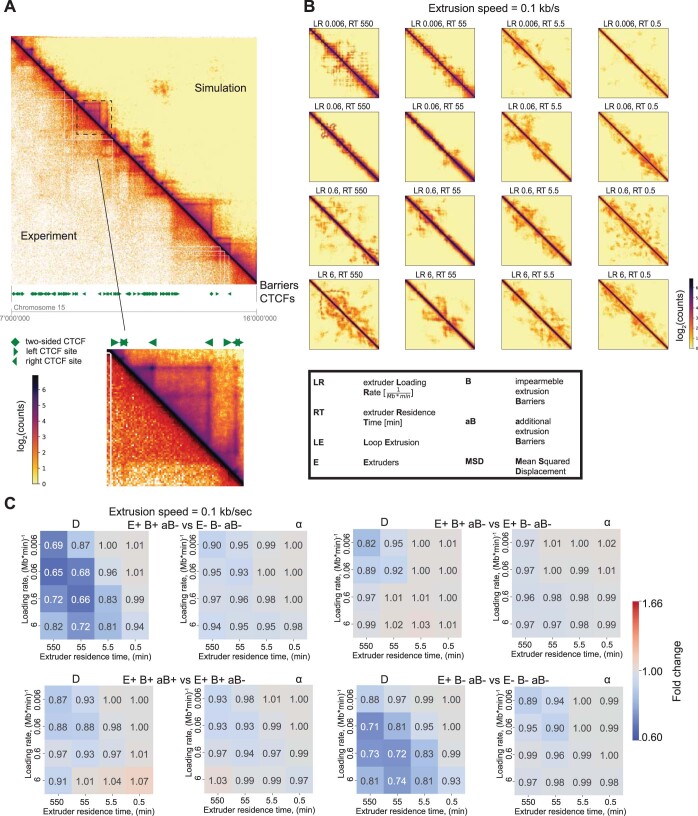
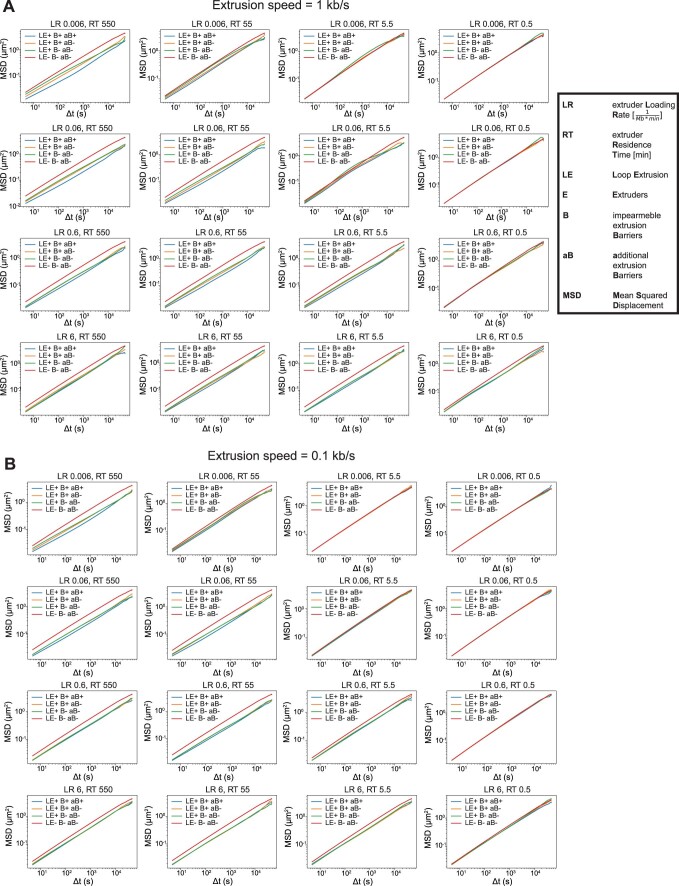
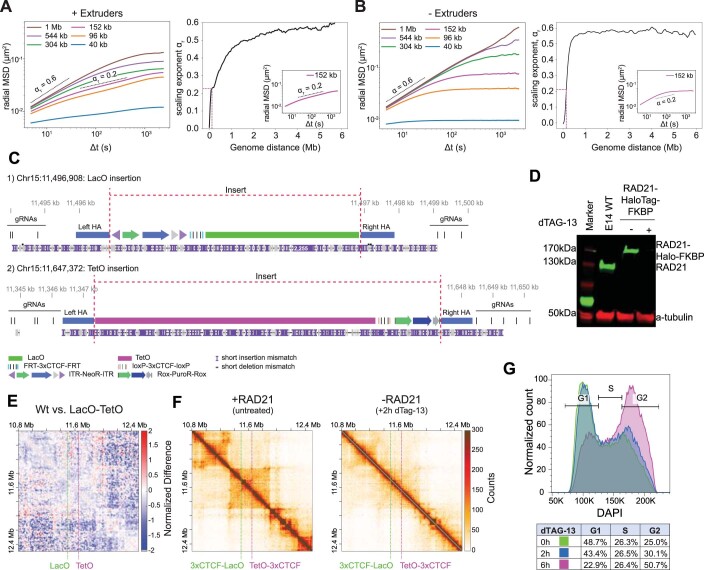
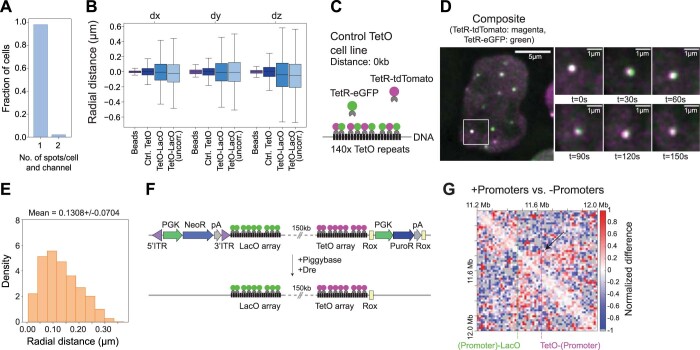
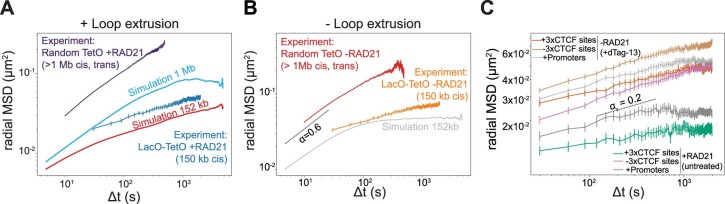
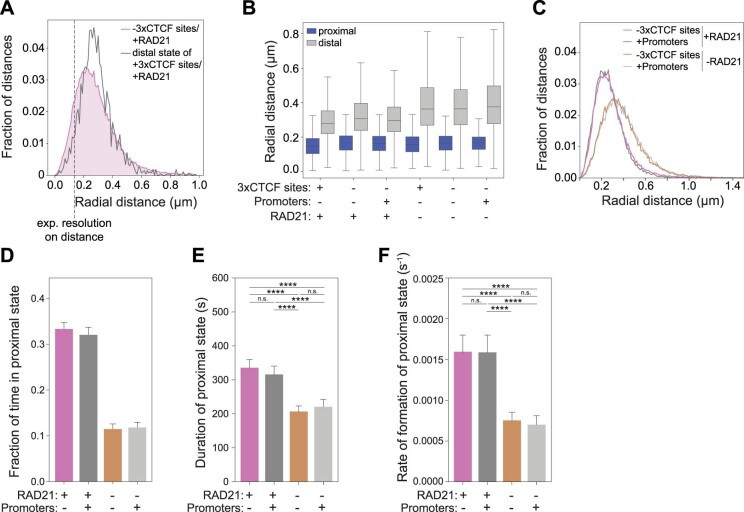
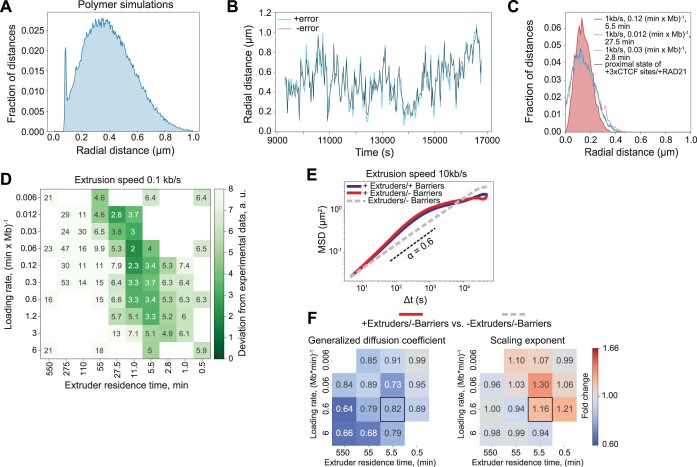
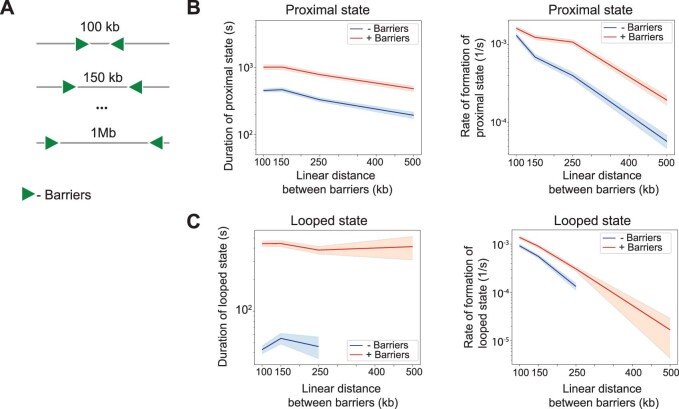
In mammals, interactions between sequences within topologically associating domains enable control of gene expression across large genomic distances. Yet it is unknown how frequently such contacts occur, how long they last and how they depend on the dynamics of chromosome folding and loop extrusion activity of cohesin. By imaging chromosomal locations at high spatial and temporal resolution in living cells, we show that interactions within topologically associating domains are transient and occur frequently during the course of a cell cycle. Interactions become more frequent and longer in the presence of convergent CTCF sites, resulting in suppression of variability in chromosome folding across time. Supported by physical models of chromosome dynamics, our data suggest that CTCF-anchored loops last around 10 min. Our results show that long-range transcriptional regulation might rely on transient physical proximity, and that cohesin and CTCF stabilize highly dynamic chromosome structures, facilitating selected subsets of chromosomal interactions.


Conflict of interest statement

All authors declare no competing interests.

Figures

Fig. 1
Fig. 1. Cohesin slows down chromosome dynamics in living cells.
a, Clonal mESC lines containing random TetO arrays flanked by 3 × CTCF motifs and expressing TetR-tdTomato. Constructs were integrated using piggyBac transposition in mESCs allowing auxin-inducible degradation of GFP-tagged RAD21, WAPL or CTCF. ITR, inverted terminal repeats. b, Representative images of RAD21-AID-eGFP cells containing 3 × CTCF-TetO imaged before or after 90 min of auxin treatment (exposure time eGFP and tdTomato: 50 ms, deconvolved, maximum intensity projection, bicubic interpolation, n = 3 replicates). c, Left, time series of TetR-tdTomato signal over 30 min (maximum intensity projection, time interval dt = 10 s, color-coded for intensity changes over time). Right, magnification with overlay of TetR-tdTomato signal with reconstructed trajectories of individual TetO arrays. d, Left, cell motion is approximated as the average roto-translational motion of TetO signals within the same nucleus. Right, MSD averaged over trajectories within one nucleus (mean ± s.e.m.) before (cyan, n = 77) and after (blue, n = 77) cell motion and localization error correction. Green, radial MSD of pairs of operator arrays within the same nucleus (mean ± s.e.m., n = 491 pairs). e, Left, MSD (mean ± s.e.m.) in mESC lines before (blue, 310 cells, 13,537 trajectories) or after (red, 271 cells, 11,082 trajectories) Cre-mediated removal of 3 × CTCF sites. Three replicates per cell line and three lines per condition were analyzed and merged here and in all following MSD graphs. P values (two-sided Student’s t-test) for all panels shown in Extended Data Fig. 2e. Right, schematic representation of Cre-mediated removal of CTCF sites. f, Left, same as in e but in mESC lines with 3 × CTCF-TetO arrays, before (blue, 323 cells, 9,829 trajectories) or after (red, 365 cells, 12,495 trajectories) CTCF degradation (6 h of auxin treatment). Right, schematic representation of auxin-induced CTCF degradation. g, MSD (mean ± s.e.m.) of 3 × CTCF-TetO insertions before (blue, 310 cells, 13,537 trajectories) or after (red, 240 cells, 8,788 trajectories) RAD21 degradation (90 min of auxin). h, MSD (mean ± s.e.m.) of 3 × CTCF-TetO before (blue, 336 cells, 6,687 trajectories) or after (red, 350 cells, 6,717 trajectories) WAPL degradation (24 h of auxin). i, Fold changes in generalized diffusion coefficients (D) and scaling exponents (α) in untreated cells compared with cells where degradation of CTCF, RAD21 and WAPL or removal of CTCF motifs (3 × CTCF) occurred. Source data
Fig. 2
Fig. 2. Loop extrusion generally slows down polymer motion.
a, Representative snapshots of conformations and simulated contact maps for a polymer model with excluded volume and increasingly complex models with loop extruders, extrusion barriers sampled from CTCF motifs within 9 Mb on chromosome 15 (Chr15:7–16 Mb) and additional randomly distributed extrusion barriers. For the system with additional barriers, the contact map is presented aside with magnification of the contact map of the system without additional barriers to highlight the differences. b, Simulated contact maps (with loop extrusion and extrusion barriers) for polymers with two extrusion speeds (1 kb s−1 and 0.1 kb s−1) and different combinations of extruder loading rates and residence times. The resulting linear densities of extruders (number per Mb) are shown in the bottom left corner of each contact map. c, Effect of extruders. MSDs of polymers with (red line) or without (gray dashed line) loop extruders in the absence of extrusion barriers (loading rate 0.6 (Mb × min)−1 and residence time 5.5 min, corresponds to black square in panel d). Black dashed curve represents α = 0.6 as an eye guide. d, Effect of extruders. Ratios of generalized diffusion coefficients and anomalous exponents between the two conditions shown in panel c. Black square, set of parameters whose corresponding MSDs are shown in panel c. e, MSDs of polymers with (blue line) or without (gray dashed line) both extruders and barriers. Same parameters as in panel c. f, Same as panel d for cases illustrated in panel e. g, MSDs of polymers with loop extruders in the presence (blue) or absence (red) of extrusion barriers. Same parameters as in panels c and e. h, Same as panels d and f but for cases illustrated in panel g. i, MSDs of polymers either with (light blue) or without (red) additional randomly inserted extrusion barriers. Same parameters as in panels c, e, g. j, Same as panels d, f and h but for cases illustrated in panel i. Source data
Fig. 3
Fig. 3. Convergent CTCF sites further constrain polymer dynamics.
a, Simulated contact maps of a region spanning the equivalent of 800 kb for a polymer chain without loop extrusion, with loop extruders and with convergent extrusion barriers separated by the equivalent of 152 kb. b, Radial MSD of the two monomers separated by the equivalent of 152 kb in the three conditions from panel a. Dashed line is an exponent of 0.2 as a guide to the eye (αr indicates the slope of radial MSDs). Loop extrusion parameters as in Fig. 2c. c, Representative examples of distances between the two monomers in simulations with or without loop extrusion and extrusion barriers. The flat stretch in the trajectory with extrusion and barriers corresponds to a loop anchored by the two barriers. Source data
Fig. 4
Fig. 4. Cohesin and CTCF reduce variability in chromosome folding dynamics.
a, Top, insertion of TetO and LacO arrays separated by 150 kb within a ‘neutral’ TAD on chromosome 15 in mESCs. Flanking 3 × CTCF sites can be excised by Cre and Flp recombinases. Arrays are visualized by binding of LacI**-eGFP and TetR-tdTomato, respectively. Bottom, tiled Capture-C map (6.4-kb resolution) and genomic datasets in mESCs in a region in 2.6 Mb surrounding the engineered TAD. Capture-C was performed in cells where arrays were flanked by 3 × CTCF sites. Dashed lines, positions of LacO and TetO insertions. b, Capture-C maps in mESC lines with (left) or without (middle) 3 × CTCF sites flanking TetO and LacO arrays, and differential map (right, +3 × CTCF versus −3 × CTCF, Methods) highlighting interactions formed between convergent 3 × CTCF sites (arrows). c, Top, representative fluorescence microscopy images of mESCs with 3 × CTCF-LacO and TetO-3 × CTCF insertions. Bottom, magnified view with time series overlay of LacI**-eGFP and TetR-tdTomato signals (exposure time 50 ms, deconvolved, maximum intensity projection, bicubic interpolation). d, Representative trajectories of TetO-LacO radial distances with or without convergent 3 × CTCF sites, either before or after degradation of RAD21 (2 h of dTag-13) (dt = 30 s). e, Distribution of TetO-LacO radial distances in the four experimental conditions (+3 × CTCF sites/+RAD21: n = 152 cells, 4 pooled replicates; −3 × CTCF sites/+RAD21: n = 214 cells, 4 pooled replicates; +3 × CTCF sites/−RAD21: n = 248 cells, 7 pooled replicates; −3 × CTCF sites/−RAD21: n = 277 cells, 6 pooled replicates). f, Distributions of variance over mean within single trajectories across the four experimental conditions (no. of cells as in panel e). Boxes, lower and upper quartiles (Q1 and Q3, respectively). Whiskers denote 1.5 × interquartile region (IQR) below Q1 and above Q3. P values are calculated using two-sided Kolmogorov–Smirnov test. NS, not significant; **P < 0.01; ****P < 0.0001. Exact P values can be found in Supplementary Table 2. Outliers are not shown. g, Distribution of jump step size (changes in TetO-LacO radial distance) across increasing time intervals for the four experimental conditions (no. of cells as in panel e). Boxes, lower and upper quartiles (Q1 and Q3, respectively). Whiskers, 1.5 × IQR below Q1 and above Q3. Outliers are not shown. Source data
Fig. 5
Fig. 5. Cohesin and CTCF control contact dynamics inside a TAD.
a, Representative trajectories of radial distance (gray) and occurrences of the proximal state called by HMM (colored bars). The HMM was fitted on data with convergent 3 × CTCF sites and RAD21 (top left) to find the proximal state which was then imposed on the other three samples. b, Left, radial distance distribution in cells with convergent 3 × CTCF sites and RAD21 overlaid with those of proximal and distal states called by HMM on the same sample. Right, same as in the left panel but normalized and with the additional display of the distance distribution from a control cell line where TetO and LacO signals perfectly co-localize. c, Fraction of time spent in the proximal state called by HMM in the four experimental conditions (no. of replicates as indicated in Fig. 4e). Shown are averages across experimental conditions; error bars represent bootstrapped (n = 10,000) standard deviations. d, Average durations of proximal states (mean ± 95% confidence interval (CI), n = 680 (−3 × CTCF/+RAD21); n = 287 (+3 × CTCF/+RAD21); n = 268 (−3 × CTCF/−RAD21); n = 114 (+3 × CTCF/−RAD21)). P values (two-sided Kolmogorov–Smirnov): *P < 0.05; **P < 0.01; ***P < 0.001; ****P < 0.0001. Exact P values can be found in Supplementary Table 2. e, Average rates of contact formation—time elapsed between the end of a proximal state and the beginning of the next (mean ± 95% CI, n = 726 (−3 × CTCF/+RAD21); n = 323 (+3 × CTCF/+RAD21); n = 268 (−3 × CTCF/−RAD21); n = 138 (+3 × CTCF/−RAD21)). P values as in panel d. Source data
Fig. 6
Fig. 6. Estimation of frequency and duration of cohesin-mediated CTCF loops.
a, Levels of agreement between simulations and experimental data as a function of loop extrusion parameters (here shown with extrusion speed 1 kb s−1). The score represents the deviations of the distance, duration and fraction of time spent in the proximal state with those experimentally observed in the presence of RAD21 with or without 3 × CTCF sites (Methods). Magenta square, parameter set maximizing the agreement with experimental values. Yellow squares, four additional second-best parameter sets. b, Fraction of time spent in the proximal state called by HMM on simulations with the five best-matching parameters (magenta and yellow squares in panel a for +Extruder case, Methods). c, Average duration (mean ± 95% CI) of proximal state called by HMM on simulations with the five best-matching parameters. d, Fraction of time spent in the proximal state called by HMM on simulations (over n = 15,880 time points) for the best-matching parameter set in the presence of extruders (+) or low levels (−) of extruders, either with or without extrusion barriers. Shown are averages across experimental conditions; error bars represent bootstrapped (n = 10,000) standard deviations. e, Average duration of the proximal state (mean ± 95% CI, over n = 15,880 time points) either in the presence of extruders (+) or low levels of extruders (−), either with or without extrusion barriers. Two-sided Kolmogorov–Smirnov P values can be found in Supplementary Table 2. f, Representative trajectories of radial distances (gray), contact states called by HMM (full bar) and looped states in the underlying polymer conformations (striped bars) from +Extruders/+Barriers (top) and +Extruders/−Barriers simulations (bottom) with best-matching parameters (magenta square in panel a). g, Fraction of time spent in the looped state based on simulations with the five best-matching parameters. h, Average duration of the looped state based on simulations with the five best-matching parameters (mean ± 95% CI). i, Scheme summarizing the durations of proximal and looped states in the presence and absence of 3 × CTCF sites. a.u., arbitrary unit; sim, simulation. Source data
Extended Data Fig. 1
Extended Data Fig. 1. Chromosome structure is altered upon degradation of factors involved in loop extrusion.
A. Western Blots showing degradation of RAD21, WAPL and CTCF upon 1.5 h, 24 h and 6 h, respectively. Loading control: α-tubulin, n = 1–2 replicates for each cell line. B. Left: Average enrichment in Hi-C read counts at CTCF sites based on Hi-C data in RAD21-AID-eGFP cells either untreated (left), treated for 1.5 h (middle) or 4 h (right) with auxin. Right: Differences in enrichment at CTCF peaks. Peaks were called on Hi-C data from untreated cells. C. Flow cytometry analysis of fixed cells stained with DAPI showing cell-cycle stage distributions of RAD21-AID-eGFP mESC cultured with serum, LIF and 2i, either before (green) or after 1.5 h (blue) and 6 h (red) auxin treatment. D. Integration site numbers in two clones of RAD21-AID-eGFP lines with and without 3xCTCF sites. E. Distribution of integration sites from lines shown in panel D that belong to A and B compartments called on distance-normalized Hi-C map (same as panel B). F. Integration sites distances from the closest endogenous CTCF site. Boxplot: lower and upper quartiles (Q1 and Q3, respectively); whiskers: 1.5x interquartile region (IQR) below Q1 and above Q3. n = 15 and 19 insertions for -3xCTCF-TetO clones 1 and 2, respectively, n = 14 and 19 insertions for +3xCTCF-TetO clones 1 and 2, respectively. G. Example of genotyping PCR upon removal of 3xCTCF sites in a RAD21-AID-eGFP +3xCTCF-TetO clonal line. PCR1 amplifies the entire 3xCTCF cassette and product size changes from 470 bp to 147 bp if the cassettes are successfully removed. PCR2 amplifies half of the 3xCTCF cassette and no product is expected if 3xCTCF cassettes were removed from all insertion sites; otherwise a PCR band of 303 bp is expected. H. Representative 4C-seq profiles from insertions on chromosomes 6 and 9 using TetO as a viewpoint showing that 3xCTCF-TetOs lead to the formation of ectopic contacts (dashed red lines) with nearby endogenous CTCF sites in the presence of RAD21. Contacts are lost upon deletion of 3xCTCF cassette (−3xCTCF-TetO) and upon degradation of RAD21 (−RAD21). Source data
Extended Data Fig. 2
Extended Data Fig. 2. Chromosome dynamics is modulated by degradation of factors involved in loop extrusion.
A. Mean Square Displacement (MSD) of trajectories from TetO insertions within the same cell (MSD, mean ± s.e.m., n = 45 tracks) before (cyan) and after applying cell motion (light blue, n = 45 tracks) and localisation error correction (dark blue, n = 45 tracks). B. Scaling exponents (α) and generalized diffusion coefficients (D) across all conditions and cell lines were fitted by pooling all three biological replicates. Shown are the numbers for the best fit ± error of the fit. C. MSD (mean ± s.e.m.) plots for a single clonal cell line (biological replicate) when looking at removal of 3xCTCF sites (top row) next to the array or degrading all CTCF (bottom row). D. MSD (mean ± s.e.m.) in the cell lines (n = 3 replicates per clonal cell line, three cell lines) where the 3xCTCF cassette was excised. Shown are the MSDs for cells either depleted of RAD21 for 90 min (red, 266 cells, 9,020 trajectories analyzed) or not (blue, 271 cells, 11,082 trajectories analyzed). Global depletion of RAD21 increases mobility. p-values in panel E. E. Distributions of α and D fitted based on single trajectory MSD and significance test for differences in generalized diffusion coefficients (D) and scaling exponents (α). The p-value is calculated using Student t-test (two-sided) (see Methods). F. Same as in C for a single clonal cell line (biological replicate) with integrations with 3xCTCF-TetO (top row) or without 3xCTCF-TetO (bottom row) when degrading RAD21. Global depletion of RAD21 increases mobility. G. Same as in D in the cell lines that contain integrations of 3xCTCF-TetO and the Tir1 protein, but do not contain any AID-tag for targeted degradation. MSDs for cells either treated with auxin for 90 min (red, 97 cells, 2,155 trajectories analyzed) or not (blue, 111 cells, 3,711 trajectories analyzed). No significant changes were detected. p-values in panel E. Source data
Extended Data Fig. 3
Extended Data Fig. 3. Simulations of chromosome dynamics and effects of loop extrusion.
A. Visual comparison of experimental Hi-C contact map with contact maps of simulations at extrusion speed 1 kb/s, extruder loading rate 0.06 (Mb x min)−1 and residence time 5.5 min. B. Contact maps for the polymer simulations at extrusion speed 0.1 kb/s and barriers from the range 7–16 Mb of chromosome 15. Acronyms used in this figure are indicated in the black box on the right. C. Pairwise comparison for conditions indicated in the title of each pair of heatmaps. Pair of heatmaps contains ratios of generalized diffusion coefficients (D) and scaling exponent (α), and represents fold change between the conditions.
Extended Data Fig. 4
Extended Data Fig. 4. MSDs of systems for two extruder speeds.
A. MSDs for all 16 conditions for each set of loop extrusion parameters and extrusion speed of 1 kb/s. B. Same as A but for the extrusion speed of 0.1 kb/s. Source data
Extended Data Fig. 5
Extended Data Fig. 5. Characterization of TetO and LacO array integrations.
A. Left panel: radial MSD of distances between multiple pairs of monomers separated by distances equivalent to 40 kb - 1 Mb for a polymer with loop extrusion but no barriers. Dashed scaling exponents α = 0.2 and α = 0.6 serve as an eye guide. Right panel: Slopes of radial MSD curves for two loci separated by varying linear distances, estimated from linear fitting between 5 and 60 seconds. Inset: detail of radial MSD and fit for monomers separated by 152 kb. B. Left panel: radial MSD of multiple pairs of monomers separated by various distances (40 kb-1 Mb). Simulations were performed for the polymer without extruders and barriers. Values were averaged with a sliding window without considering the first and last 200 monomers (1.6 Mb). Dashed scaling exponent α = 0.6 serves as an eye guide. Right panel: Distance dependency of the scaling exponent (α) on the genomic distance between loci. C. Integrated Genomic Viewer (IGV) snapshot showing an example of a Nanopore sequencing read mapped to a modified mouse genome including the respective insertions. Reads that spanned from a guide RNA (gRNA) binding site upstream of the left homology arm (left HA) to a gRNA binding site downstream the right homology arm (right HA) confirmed single insertion of the transgene. D. Western Blots showing the targeted degradation of RAD21 after 2 h of treatment with 500 nM dTAG-13. Loading control: anti-tubulin, n = 2 replicates. E. Differential map at 6.4 kb resolution for the structural differences between a E14 wild-type (WT) and the E14 cell line containing LacO and TetO insertions (see Methods). Dashed lines indicate the insertion sites. No structural changes are detected upon integration of the operator arrays. F. Capture-C maps at 6.4 kb resolution in the region on chr15 (10.8 Mb-12.5 Mb) in the untreated cells (left) and in cells treated with 500 nM dTag-13 (left) showing that RAD21 degradation leads to loss of chromosome structure. G. Flow cytometry analysis of fixed cells stained with DAPI to show cell cycle stage distribution of E14 RAD21-HaloTag-FKBP cells. Source data
Extended Data Fig. 6
Extended Data Fig. 6. Correction of chromatic aberrations and characterization of mESC lines with promoters flanking TetO and LacO arrays.
A. Bar plot showing the number of detected spots per cell per channel for 1,400 manually annotated images subsampled from the images series. In 3% of the images 2 spots per cell are detected indicating the presence of sister-chromatids. B. Distribution of pairwise distances in each dimension for co-localized signals measured on beads (n = 2,226 timepoints) or on the control TetO cell line (n = 69,453 timepoints), as well as for chromatic-aberration corrected and uncorrected images from TetO-LacO cell lines (in the presence of cohesin and 3xCTCF sites, n = 848,955 timepoints). Boxplot: boxes denote lower and upper quartiles (Q1 and Q3, respectively); whiskers denote 1.5x the interquartile region (IQR) below Q1 and above Q3. C. Schematic representation of the ‘Control TetO’ cell line that contains multiple TetO array integrations as well as stable integrations of TetR-eGFP and TetR-tdTomato. This allows labeling of each TetO array with two separate fluorophores. D. Representative images of the ‘Control TetO’ cell line. The time series shows a zoomed version of the region indicated by the white square. E. Radial distance distribution of the ‘Control TetO’ cell line as defined in panel C and D showing that the resolution on the 3D distance is ~130 nm. F. Schematic representation of cell line containing 3-phosphoglycerate kinase (PGK) promoters driving the expression of resistance gene directly adjacent to the operator arrays. The expression cassettes can be excised using Dre recombination or piggyBac transposition to yield the cell line with operator arrays only (PGK = PGK promoter, NeoR = Neomycin resistance gene, PuroR = Puromycin resistance gene, pA = polyadenylation signal, ITR = inverted terminal repeats for piggyBac recognition, Rox = Rox sites for Dre recombination). G. Differential map at 6.4 kb resolution for the structural differences between the E14 cell line containing LacO and TetO insertions with the adjacent promoters vs. the E14 cell line containing the operator arrays only (see Methods). Dashed lines indicate the insertion sites. Source data
Extended Data Fig. 7
Extended Data Fig. 7. Polymer simulations of two genomic locations within the same TAD.
A. Radial MSD of TetO random integrations (mean ± s.e.m., purple, see Fig. 1E, n = 271 cells examined over 3 pooled biological replicates) and of targeted LacO and TetO insertions on Chr15 (mean ± s.e.m., dark blue, n = 214 cells examined over 4 replicates) are compared to model predictions for pairs of loci containing extrusion barriers at a distance of 1 Mb (light blue) and 152 kb (red). Note that random TetO insertions often occur on different chromosomes and thus have larger absolute radial MSD than 1 Mb simulations (but similar scaling). B. Radial MSD for cell lines containing multiple random integrations of TetO as shown in Extended Data Fig. 2D (mean ± s.e.m., red, 266 cells examined over 3 pooled replicates) or the targeted integrations of LacO and TetO on chr15 (mean ±  s.e.m., orange, n = 277 cells examined over 6 replicates) in the absence of RAD21 compared to the predicted radial MSD of two loci at a distance of 150 kb in the absence of extruders (gray) as predicted from polymer simulations. C. Radial MSD of TetO-LacO distances in mESC lines with or without convergent 3xCTCF sites (or promoters, respectively), either before or after treatment with 500 nM dTag-13 for 2 hours to induce degradation of RAD21 (dt = 30 s). radial MSDs are plotted as mean ± s.e.m. over conditions: +CTCF sites/+RAD21: n = 152 cells examined over 4 replicates, −CTCF sites/+RAD21: n = 214 cells examined over 4 replicates, +CTCF sites/−RAD21: n = 248 cells examined over 7 replicates, −CTCF sites/−RAD21: n = 277 cells examined over 6 replicates, +Promoters/+RAD21: n = 155 cells examined over 3 replicates, +Promoters/−RAD21: n = 170 cells examined over 3 replicates. Source data
Extended Data Fig. 8
Extended Data Fig. 8. Live-cell imaging of two genomic locations within the same TAD.
A. Radial distance distribution for the condition -3xCTCF sites/+RAD21 (magenta) overlaid with the distal state called by HMM on the +3xCTCF sites/+RAD21 (gray) showing that the distal state identified by HMM largely overlaps with the distance distribution of the two loci in the absence of the CTCF sites. B. Boxplot for the radial distances for the proximal and distal state called by HMM on all six conditions. The horizontal line indicates the median. Box plots are as in Extended Data Fig. 1F. Boxplot: boxes denote lower and upper quartiles (Q1 and Q3, respectively); whiskers denote 1.5x the interquartile region (IQR) below Q1 and above Q3. C. Distribution of TetO-LacO radial distances in the four experimental conditions. −CTCF sites/+RAD21: n = 214 cells examined over 4 replicates, −CTCF sites/−RAD21: n = 277 cells examined over 6 replicates, +Promoters/+RAD21: n = 155 cells examined over 3 replicates, +Promoters/−RAD21: n = 170 cells examined over 3 replicates). D. Fraction of time spent in the proximal state called by HMM in the four experimental conditions comparing +Promoters vs. -Promoters +/−RAD21 (no. of cells is as indicated in panel C). Shown average across experimental conditions and error bars represent bootstrapped (n = 10,000) standard deviations. E. Average duration of proximal states (mean ± 95% confidence interval, n = 680 cells (-promoter +RAD21); n = 466 cells (+promoter +RAD21); n = 268 cells (−promoter −RAD21); n = 253 cells (+promoter −RAD21)) for the conditions +Promoters vs. −Promoters, +/−RAD21. p-values (two-sided Kolmogorov-Smirnov): * – p < 0.05, ** – p < 0.01, *** – p < 0.001, **** – p < 0.0001. p-values can be found in Suppl. Table S2. F. Average rates of contact formation – time elapsed between the end of a proximal state and the beginning of the next (mean ± 95% confidence interval, n = 726 (-promoter +RAD21); n = 495 (+promoter +RAD21); n = 323 (−promoter −RAD21); n = 296 (+promoter −RAD21))) for the conditions +Promoters vs. −Promoters, +/−RAD21. p-values legend is as in panel E. Source data
Extended Data Fig. 9
Extended Data Fig. 9. HMM analysis of simulations compared to experimental data.
A. Bimodal distribution of pairwise distances from simulations corresponding to the set of parameters with a loading rate of 0.06 (min × Mb)−1, extruder residence time of 5.5 min, extruder speed of 1 kb/s, and in the absence of barriers. Data were sampled every 1 s and merged from 10 simulation runs. B. Representative radial distance trajectory of a simulated system with and without an additional error on the distance that is in the range of the experimental error. C. Radial distance distribution for the proximal state of the +3xCTCF sites/+RAD21 condition overlaid with the distributions of the proximal states from the three best matching parameters sets when comparing only the average radial distances. D. Heatmap showing the agreement of all simulated systems (for extrusion speed 0.1 kb/s) with the experimental data. The score is as described in Fig. 6A (see Methods). E. MSDs for three conditions for extruder residence time of 5.5 min, loading rate of 0.6 (Mb × min)−1 and extrusion speed of 10 kb/s. Pairwise comparison for conditions indicated in the title of each pair of heatmaps. F. Heatmap showing the fold change of generalized diffusion coefficients (D) and scaling exponent (α), and represents fold change between the conditions. Source data
Extended Data Fig. 10
Extended Data Fig. 10. Polymer simulations of landscapes with two barriers at different distances.
A. Scheme of simulated polymers with varying distances between (optional) convergent loop extrusion barriers, corresponding to 100, 150, 250, 500, and 1000 kb. B. Duration (left) and rate of formation (right) of the HMM proximal state detected on simulated pairwise distances (after addition of experimental error) between monomers in the presence or absence of extrusion barriers, as a function of the intervening linear genomic distance. Lines are means, shaded areas are s.e.m. Note that the average duration of the HMM proximal state slightly decreases although the average duration of the underlying cohesin-mediated CTCF-CTCF interaction doesn’t (see panel C). This is due to non-CTCF mediated interactions, which also contribute to the proximal state, and decrease with increasing genomic distance. C. Average duration (left) and rate of formation (right) of the looped state (that is cohesin-mediated CTCF-CTCF interaction) extracted from polymer simulations. Lines are means, shaded areas are s.e.m. Source data

References

    1. Marchal C, Sima J, Gilbert DM. Control of DNA replication timing in the 3D genome. Nat. Rev. Mol. Cell Biol. 2019;20:721–737. doi: 10.1038/s41580-019-0162-y. - DOI - PMC - PubMed
    1. Arnould C, et al. Loop extrusion as a mechanism for formation of DNA damage repair foci. Nature. 2021;590:660–665. doi: 10.1038/s41586-021-03193-z. - DOI - PMC - PubMed
    1. Zuin J, et al. Nonlinear control of transcription through enhancer–promoter interactions. Nature. 2022;604:571–577. doi: 10.1038/s41586-022-04570-y. - DOI - PMC - PubMed
    1. Nora EP, et al. Spatial partitioning of the regulatory landscape of the X-inactivation centre. Nature. 2012;485:381–385. doi: 10.1038/nature11049. - DOI - PMC - PubMed
    1. Dixon JR, et al. Topological domains in mammalian genomes identified by analysis of chromatin interactions. Nature. 2012;485:376–380. doi: 10.1038/nature11082. - DOI - PMC - PubMed

Publication types

MeSH terms