. 2022 Dec;24(12):1714-1725.
doi: 10.1038/s41556-022-01025-4. Epub 2022 Dec 5.

ER-associated RNA silencing promotes ER quality control

Affiliations

ER-associated RNA silencing promotes ER quality control

Sotirios Efstathiou et al. Nat Cell Biol. 2022 Dec.

Abstract

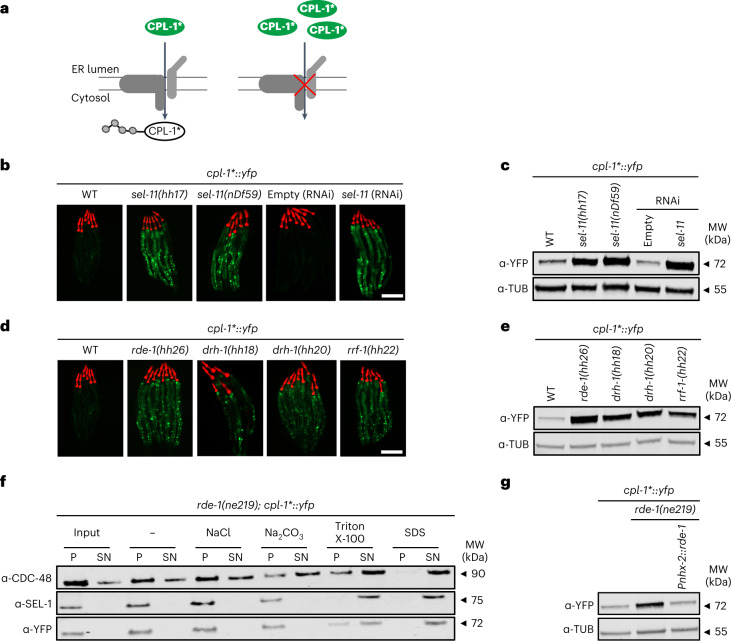
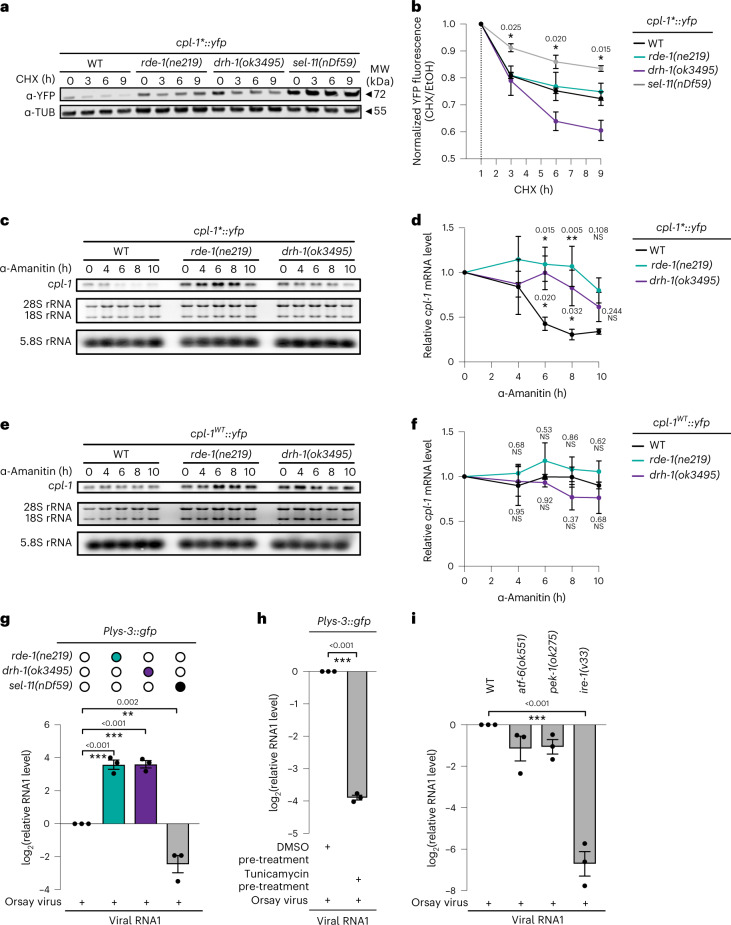
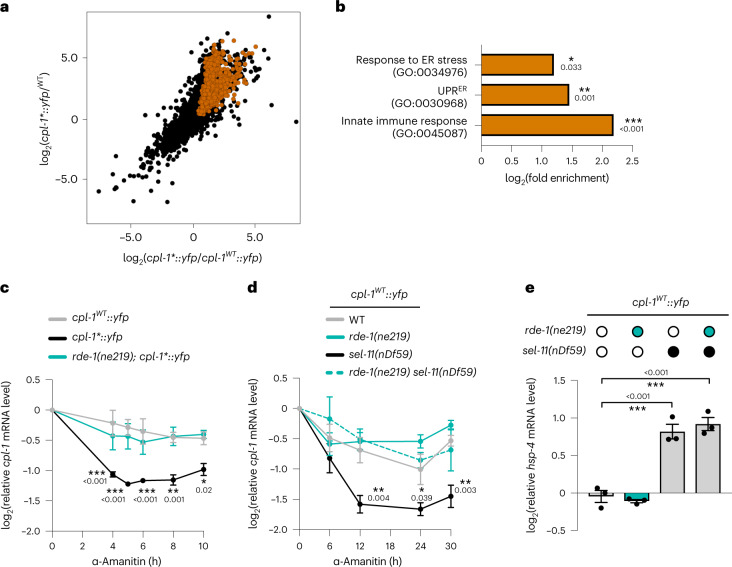
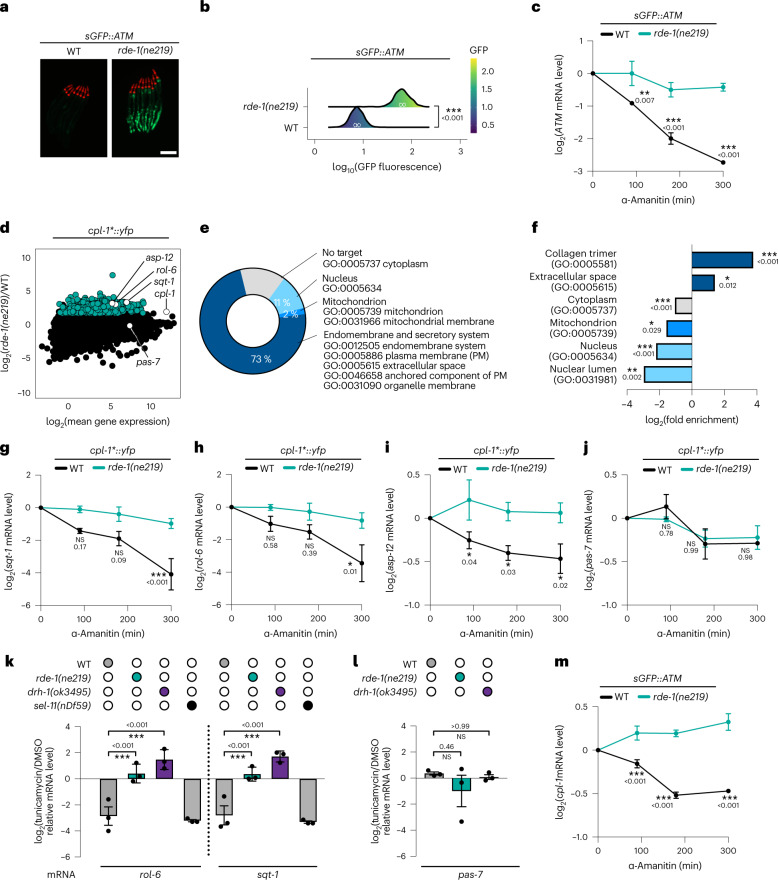
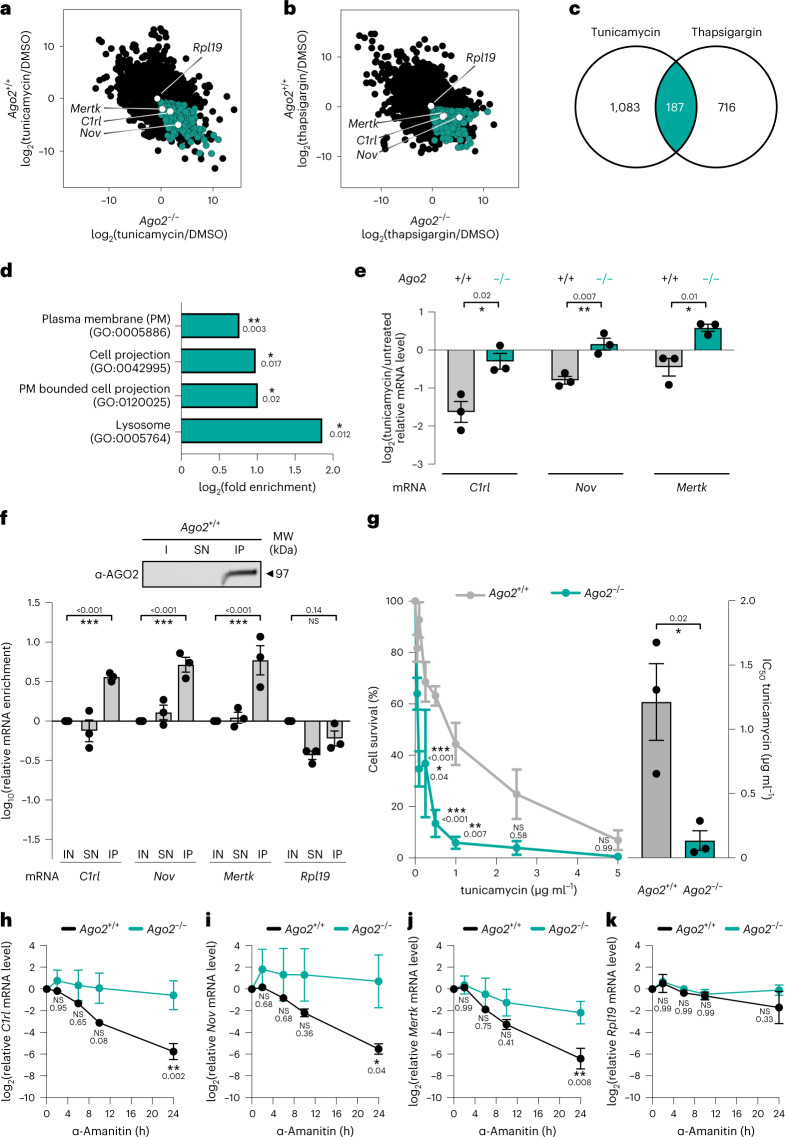
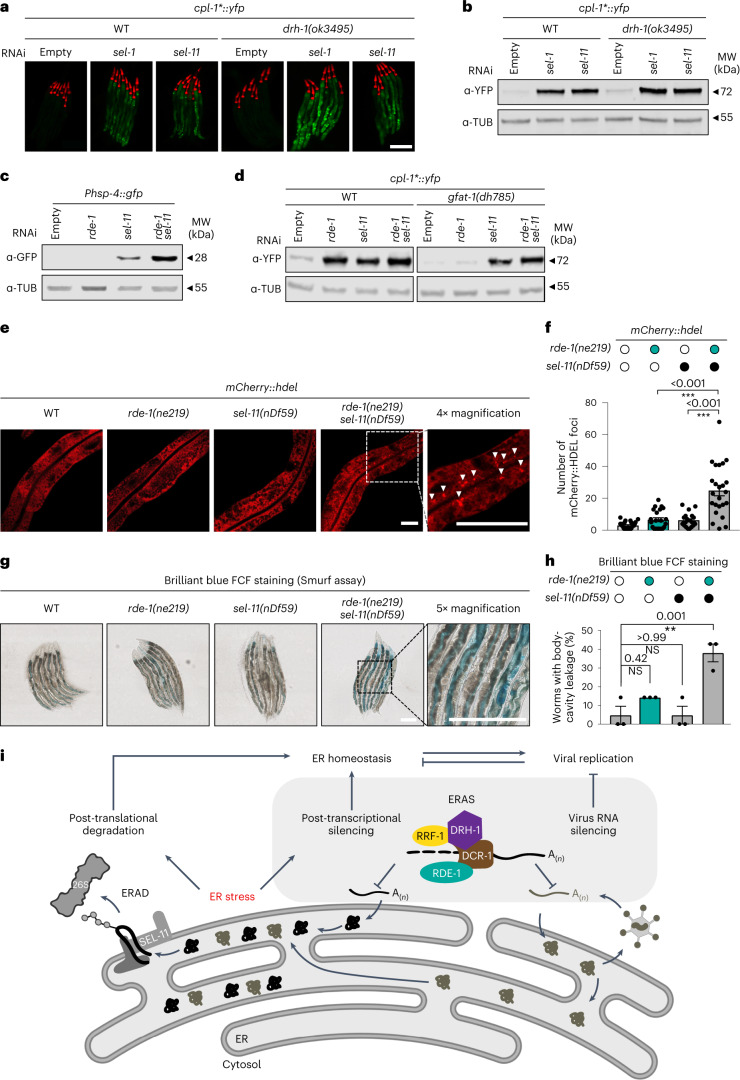
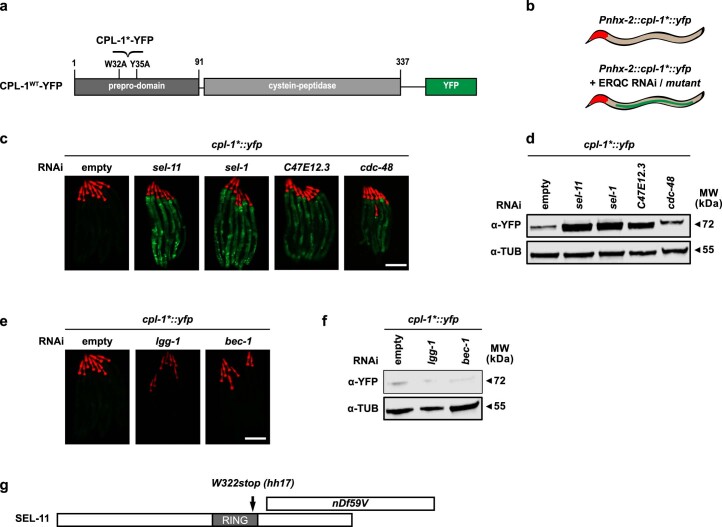
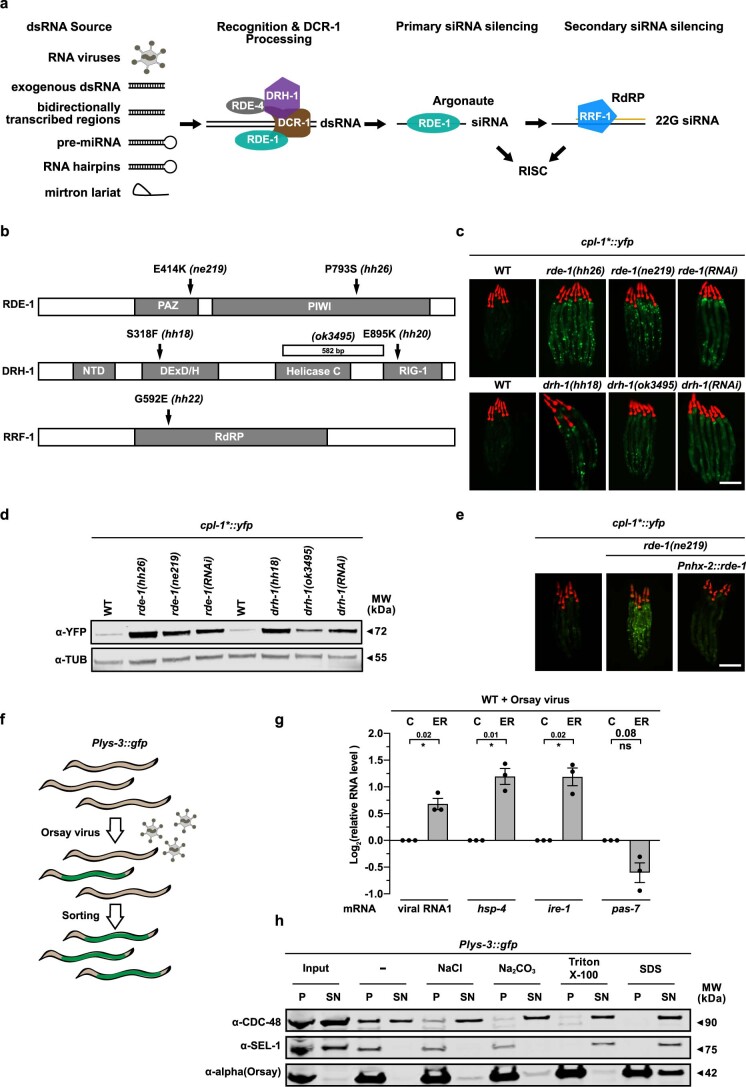
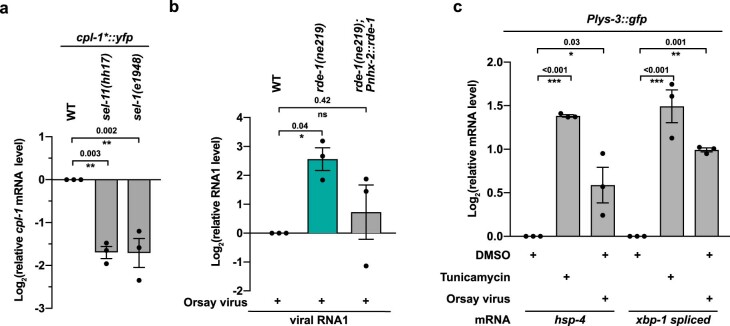
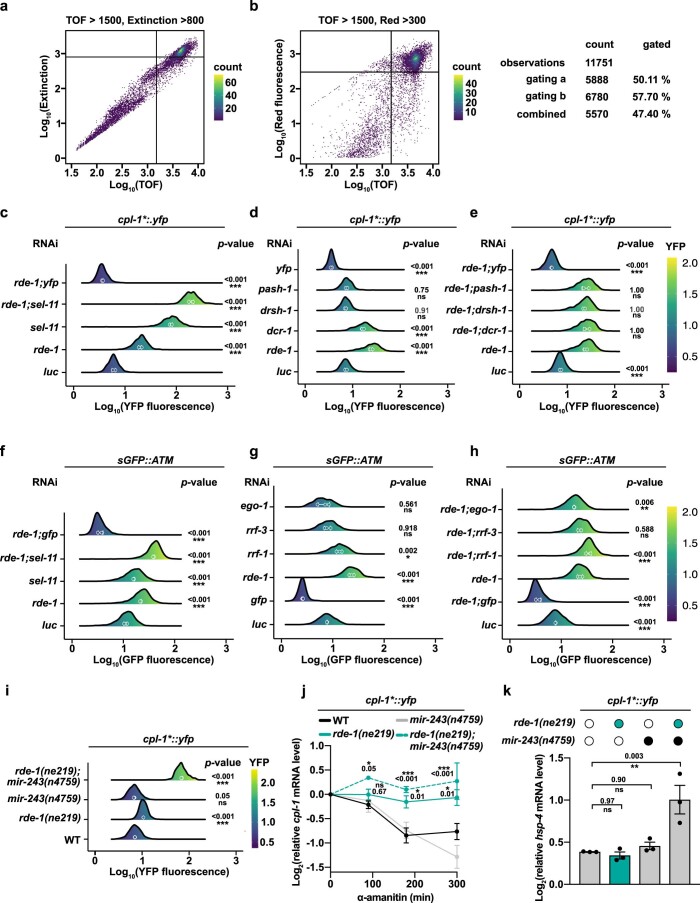
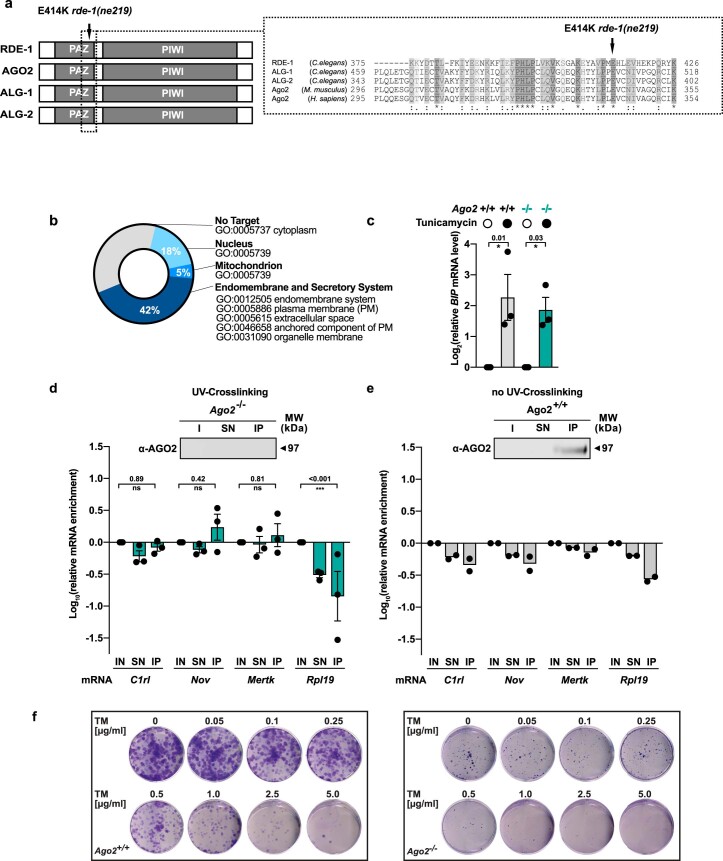
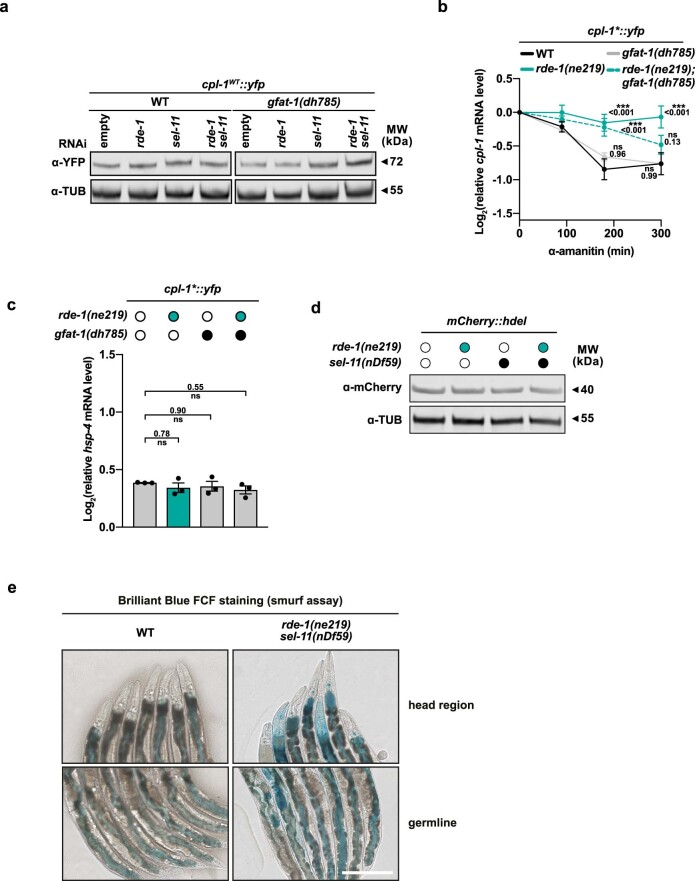
The endoplasmic reticulum (ER) coordinates mRNA translation and processing of secreted and endomembrane proteins. ER-associated degradation (ERAD) prevents the accumulation of misfolded proteins in the ER, but the physiological regulation of this process remains poorly characterized. Here, in a genetic screen using an ERAD model substrate in Caenorhabditis elegans, we identified an anti-viral RNA interference pathway, referred to as ER-associated RNA silencing (ERAS), which acts together with ERAD to preserve ER homeostasis and function. Induced by ER stress, ERAS is mediated by the Argonaute protein RDE-1/AGO2, is conserved in mammals and promotes ER-associated RNA turnover. ERAS and ERAD are complementary, as simultaneous inactivation of both quality-control pathways leads to increased ER stress, reduced protein quality control and impaired intestinal integrity. Collectively, our findings indicate that ER homeostasis and organismal health are protected by synergistic functions of ERAS and ERAD.


Conflict of interest statement

The authors declare no competing interests.

Figures

Fig. 1
Fig. 1. A role for exo-RNAi in ER homeostasis.
a, Turnover of the model substrate CPL‑1* via ERAD. b, Fluorescence images of worms expressing cpl1* with the indicated mutations and RNAi (empty control (Empty)) for the ERAD factor sel-11. c, Western blot of worm lysates corresponding to images shown in b, detecting CPL-1* (YFP) and tubulin (TUB). d, Fluorescence images of worms expressing cpl-1* with mutations in the exo-RNAi pathway. e, Western blot of worm lysates corresponding to the samples in d, detecting CPL-1* (YFP) and tubulin (TUB). f, Cellular fractionation of microsomes. Western blot detecting CPL-1* (YFP), CDC-48 (CDC-48) and SEL-1 (SEL-1). Pellet (P) and supernatant (SN) fractions of rde-1(ne219); cpl-1* worm lysates treated with the indicated chemicals after subcellular fractionation. g, Western blot of worm lysates detecting CPL-1* (YFP) and tubulin (TUB) in rde-1(ne219) worms and animals with intestinal Pnhx-2::rde-1 rescue. In b and d, pharyngeal expression of Pmyo-2::mCherry serves as transgenic marker. Scale bar, 200 µm. MW, molecular weight. Unprocessed blots are available in the source data. Source data
Fig. 2
Fig. 2. Post-transcriptional regulation of ERAD substrate and viral RNA level.
a,b, CHX chase assay to assess CPL-1* protein stability: western blot of lysates from cpl-1* expressing worms with indicated mutations detecting CPL-1* (YFP) and tubulin (TUB) over 9 h of CHX treatment (a); BioSorter quantification of YFP fluorescence in vehicle (EtOH)- and CHX-treated cpl-1*-expressing worms (b). CHX/EtOH ratios were normalized to the 1 h timepoint of the respective genotype. c, α-Amanitin chase assay to monitor cpl-1 mRNA level in rde‑1(ne219) and drh‑1(ok3495) mutant worms expressing cpl-1*. Northern blot of purified RNA from animals expressing cpl-1*, detecting cpl-1 mRNA and 5.8S rRNA. 28S and 18S rRNA served as agarose gel loading control. d, Quantification of cpl-1 mRNA level corresponding to the data shown in c, relative to 5.8 S rRNA. e, α-Amanitin chase assay to monitor cpl-1 mRNA level in rde‑1(ne219) and drh‑1(ok3495) mutant worms expressing cpl-1WT. Northern blot of purified RNA from animals expressing cpl-1WT, detecting cpl-1 mRNA and 5.8 S rRNA. 28S and 18S rRNA served as agarose gel loading control. f, Quantification of cpl-1 mRNA level corresponding to the data shown in e, relative to 5.8S rRNA. g, Viral RNA1 level measured by qRT–PCR in worms infected with the Orsay virus. h, Viral RNA1 level measured by qRT–PCR in worms pre-treated with vehicle (DMSO) or tunicamycin before viral infection. Data are relative to 18S rRNA. i, Viral RNA1 level measured by qRT–PCR in worms, defective for the UPRER pathway. In b, d and fi, Values are depicted as mean ± standard error of the mean (s.e.m.) generated from n = 3 independent experiments, *P < 0.05; **P < 0.01; ***P < 0.001; NS, P > 0.05. Data were analysed by two-way ANOVA with Sidak’s multiple comparison test. Source numerical data and unprocessed blots are available in source data. Source data
Fig. 3
Fig. 3. RDE-1-dependent RNA turnover is affected by ER stress.
a, RNA sequencing results of cpl-1* expressing worms compared with WT and cpl-1WT expressing worms, respectively. The cut-off for filtering of upregulated constructs was performed with P ≤ 0.05 (brown spheres). b, GO term enrichment for biological processes of the transcripts identified in a (brown). Only transcripts that were upregulated in both datasets shown in a were selected for analysis, resulting in 996 upregulated transcripts. c,d, α-Amanitin chase assays for cpl-1WT and cpl-1* mRNA from mutant animals for ERAD and/or ERAS expressing cpl-1WT or cpl-1* mRNA measured by qRT–PCR. Data relative to 18S rRNA, cdc-42 and pmp-3 mRNA. e, hsp-4 mRNA level measured by qRT-PCR at the 0 h timepoint corresponding to the samples shown in d. Data relative to cdc-42 and pmp-3 mRNA. In c and d, data were analysed by two-way ANOVA with Dunnett’s multiple comparison test. In e, data were analysed by one-way ANOVA with Sidak’s multiple comparison test. In ce, values are depicted as mean ± s.e.m. generated from n = 3 independent experiments, *P < 0.05; **P < 0.01; ***P < 0.001; NS, P > 0.05. In b, raw P values were corrected for FDR. *FDR <0.05; **FDR <0.01; ***FDR <0.001; NS, FDR >0.05. Source numerical data are available in source data. Source data
Fig. 4
Fig. 4. Endogenous mRNAs regulated by RDE-1.
a, Fluorescence images of mutant worms for the exo-RNAi pathway expressing ATM. Pharyngeal expression of Pmyo-2::mCherry serves as transgenic marker. Scale bar, 200 µm. b, Quantification of GFP fluorescence intensity of ATM expressing worms together with rde-1(ne219) mutation. Measurements were carried out with the BioSorter using at least 200 animals per replicate, which were merged and displayed in ridgeline density plots. c, α-Amanitin chase assays for ATM mRNA from rde-1(ne219) mutants expressing ATM. mRNA measured by qRT–PCR. d, RNA sequencing results of cpl-1*-expressing worms bearing the rde-1(ne219) mutation or the WT allele. Cut-off for upregulated constructs: P ≤ 0.05. e, A total of 485 transcripts identified in d were subjected to BUSCA subcellular localization analysis. f, Subcellular component GO term enrichment for the genes identified in d and e. gj, α-Amanitin chase assays for indicated endogenous mRNAs identified in d from rde-1(ne219) mutants and WT animals expressing cpl-1*. mRNA measured by qRT–PCR. k,l, Endogenous rol-6, sqt-1 (k) and pas-7 (l) mRNA level measured by qRT–PCR in vehicle (DMSO)- versus tunicamycin-treated WT worms. Data relative to 18S rRNA. m, α-Amanitin chase assays for endogenous cpl-1 mRNA from ATM expressing animals with the rde-1(ne219) mutation or WT allele. mRNA measured by qRT–PCR. In c, g–j and m, data are relative to cdc-42 and pmp-3 mRNA. In b, data were analysed by pairwise t-test with Holmes multiple comparison test. In k and l, data were analysed by one-way ANOVA with Sidak’s multiple comparison test. In c, gj and m, data were analysed by two-way ANOVA with Dunnett’s multiple comparison test. Values are depicted as mean ± s.e.m or, in c and gm, as mean (white circles) ± standard deviation (s.d.) (white error bars). Data in b are generated from n = 3 independent experiments. *P < 0.05; **P < 0.01; ***P < 0.001; NS, P > 0.05. In f, raw P values were corrected for FDR. *FDR <0.05; **FDR <0.01; *** FDR <0.001; NS, FDR >0.05. Source numerical data are available in source data. Source data
Fig. 5
Fig. 5. ERAS is conserved in mammalian cells.
a,b, RNA sequencing results of tunicamycin/DMSO-treated (a) and thapsigargin/DMSO-treated (b) Ago2+/+ and Ago2−/− MEF cells. Ago2-specific targets were selected by filtering (P ≤ 0.05) transcripts that were downregulated in Ago2+/+ and upregulated in Ago2−/− cells (cyan). c, Venn diagram showing the number of transcripts regulated by AGO2 upon ER stress induction. Only transcripts that were identified in both ER stress conditions (a and b) were further investigated (cyan). d, Cellular component GO term enrichment of the genes identified in a and b. e, Expression levels of endogenous Nov, Mertk and C1rl mRNA in tunicamycin-treated MEFs measured by qRT–PCR. Data relative to 18S rRNA. f, UV CLIP of tunicamycin-treated MEF cells using AGO2 as bait and subsequent qRT–PCR of target mRNAs in the input (IN), supernatant (SN) and immunoprecipitation (IP) fractions. Data normalized to input fraction. Top shows western blot against AGO2 for the performed CLIP experiment. g, Dose-dependent cell survival after tunicamycin treatment calculated from the colony formation assay shown in Extended Data Fig. 5f. Bar graph showing the IC50 values for tunicamycin between Ago2+/+ and Ago2−/− MEF cells. hk, α-Amanitin chase assays for indicated endogenous mRNAs identified in a and b from Ago2+/+ and Ago2−/− MEF cells pre-treated with tunicamycin. mRNA measured by qRT–PCR. Data relative to 18S and 28S rRNA. Data in e were analysed by unpaired two-tailed t-tests. Data in f were analysed by a two-way ANOVA with Dunnett’s multiple comparison test. The bar graph in g was analysed by paired two-tailed t-test. In gk, data were analysed by two-way ANOVA with Sidak´s multiple comparison test. In e-k values are depicted as mean ± s.e.m. generated from n = 3 independent experiments, *P < 0.05; **P < 0.01; ***P < 0.001; NS, P > 0.05. In d, raw P values were corrected for FDR. *FDR <0.05; ** FDR <0.01; *** FDR <0.001; NS, FDR >0.05. Source numerical data and unprocessed blots are available in source data. Source data
Fig. 6
Fig. 6. ERAS and ERAD execute complementary functions in ERQC.
Fluorescence images of worms expressing cpl-1*. Pharyngeal expression of Pmyo-2::mCherry serves as transgenic marker. Scale bar, 200 µm. Images were taken with lower exposure time to prevent YFP overexposure for animals with defects in both, the ERAS and ERAD pathway. b, Western blot of worm lysates corresponding to the samples in a, detecting CPL-1* (YFP) and tubulin (TUB). c, Western blot of worm lysates with the indicated RNAi treatment, detecting GFP (GFP) and tubulin (TUB). d, Western blot of worm lysates from worms depleted for ERAS and/or ERAD components expressing cpl-1* in the WT or gfat-1 GOF background detecting CPL-1* (YFP) and tubulin (TUB). e, Confocal microscopy images showing worms expressing the ER marker mCherry::hdel (red). Focal accumulation of mCherry highlighted by arrow heads. Scale bars, 20 µm. f, Quantification of mCherry-HDEL foci shown in e, n = 28, 22, 21 and 24 animals (left to right). g, Intestinal barrier (Smurf) assay. Representative images of day 5 adult worms soaked in blue food dye (Brilliant Blue FCF). Blue dye leaking from the intestinal lumen into the body cavity gives rise to the Smurf phenotype. Scale bars, 200 µm. h, Quantification of body-cavity leakage in animals shown in g, n = 7 individual animals/n = 3 replicates. In f and h, data were analysed by one-way ANOVA with Bonferroni’s multiple comparison test and values are depicted as mean ± s.e.m. generated from n = 3 independent experiments, **P < 0.01; ***P < 0.001; NS, P > 0.05. i, The ERAD machinery detects misfolded proteins and retro-translocates them into the cytosol for polyubiquitylation by SEL-11 and proteasomal turnover. The ERAS machinery mediates silencing of ER-associated mRNAs and viral RNA. ERAD and ERAS are required upon ER stress caused by misfolded proteins and virus replication and their complementary functions contribute to maintain ER homeostasis and organismal functionality. Source numerical data and unprocessed blots are available in source data. Source data
Extended Data Fig. 1
Extended Data Fig. 1. CPL-1* model substrate to monitor ER quality control in C. elegans.
(a) Schematic overview of mutations inserted into the CPL-1WT encoding transgene for expression of the CPL-1* ERAD substrate. (b) Schematic overview of the CPL-1* model substrate for studying ERQC. (c) Fluorescence images of worms with mutations in ERAD components expressing cpl-1*; C47E12.3 (EDEM-1 homologue), empty vector (empty). (d) Western blot of worm lysates corresponding to samples shown in (c), detecting CPL-1* (YFP) and tubulin (TUB). (e) Fluorescence images of worms expressing cpl-1* with defects in autophagy. (f) Western blot of worm lysates corresponding to the samples in (e), detecting CPL-1* (YFP) and tubulin (TUB). (g) Schematic overview of different sel-11 alleles used in this study; nDf59: deletion allele, hh17: Introduction of a stop codon at amino acid position 322 of the SEL-11 protein. [(c), (e)] Pharyngeal expression of Pmyo-2::mCherry serves as transgenic marker. Scale bar: 200 µm. WT: wild-type. Unprocessed blots are available in the source data. Source data
Extended Data Fig. 2
Extended Data Fig. 2. Exogenous RNAi pathway mutants accumulate the CPL-1* protein.
(a) Scheme of the exogenous RNAi pathway, detecting double stranded RNA (dsRNAs) species from various sources. RDE-4 and DRH-1 are involved in dsRNA recognition, whereas DCR-1 cleaves these RNAs into primary small interfering or micro RNAs (siRNAs/miRNA). These small RNA species are either used for primary siRNA silencing by RDE-1 or engage RDE-1-dependently in amplification by the RNA-dependent RNA polymerase (RdRP) RRF-1. RRF-1 generates secondary siRNAs for potent secondary siRNA silencing. Eventually, siRNAs and their complementary target mRNAs are loaded into the RNA-induced silencing complex (RISC) mediating target mRNA silencing. (b) Schematic overview of loss-of-function alleles of rde-1, drh-1, and rrf-1. ne219, hh26, hh18, hh20, hh22: amino acid substitutions; ok3495: deletion allele. NTD: N-terminal domain, RdRP: RNA-dependent RNA polymerase. (c) Fluorescence images of worms defective in the exogenous RNAi pathway expressing cpl-1*. (d) Western blot of worm lysates corresponding to samples shown in (c), detecting CPL-1* (YFP) and tubulin (TUB). (e) Fluorescence images of rde-1(ne219) worms and animals with intestinal Pnhx-2::rde-1 rescue expressing cpl-1*. (f) Schematic overview of Orsay virus infection in worms expressing the viral infection reporter Plys-3::gfp. Infected worms can be detected and sorted by the green fluorescent signal. (g) Cellular fractionation of cytosolic (C) and ER fraction (ER) with subsequent RNA purification. Relative mRNA level measured by qRT-PCR. (h) Cellular fractionation of microsomes. Western blot detecting SEL-1 (SEL-1), CDC-48 (CDC-48), and Orsay virus alpha capsid protein (alpha (Orsay)). Pellet (P) and supernatant (SN) fractions of Plys-3::gfp worm lysates treated with the indicated chemicals after subcellular fractionation. [(c), (e)] Pharyngeal expression of Pmyo-2::mCherry serves as transgenic marker. Scale bar: 200 µm. (g) was analyzed by unpaired two-tailed t-tests. Values are depicted as mean ± SEM generated from n = 3 independent experiments, *p < 0.05, ns p > 0.05. WT: wild-type. Source numerical data and unprocessed blots are available in source data. Source data
Extended Data Fig. 3
Extended Data Fig. 3. The exogenous RNAi pathway degrades viral RNA.
(a) cpl-1 mRNA level measured by qRT-PCR in worms depleted of the ERAD components sel-1 or sel-11. (b) Viral RNA1 level measured by qRT-PCR in rde-1(ne219) worms and animals with intestinal Pnhx-2::rde-1 expression. (c) hsp-4 and spliced xbp-1 mRNA level measured by qRT-PCR in worms infected with the Orsay virus or treated with tunicamycin. [(a)-(c)] were analyzed by one-way ANOVA with Sidak’s multiple comparison test. Data are relative to 18 S rRNA. Values are depicted as mean ± SEM generated from n = 3 independent experiments, *p < 0.05, **p < 0.01, ***p < 0.001, ns p > 0.05. WT: wild-type. Source numerical data are available in source data. Source data
Extended Data Fig. 4
Extended Data Fig. 4. DCR-1 processed dsRNA species and RRF-1 are associated with ERAS.
(a, b) 2d density hexbin plot (bins = 200) of all Biosorter® raw observations measured in Extended Data Fig. 4c, exemplifying the combined gating method of TOF, Extinction and Red fluorescence, which gates for day 1 adult worms co-expressing either the ATM or cpl-1* reporter with the pharyngeal Pmyo-2::mCherry (Red) transgenic marker (c-e) Quantification of YFP fluorescence intensity of cpl-1* expressing worms in RNAi treatments against ERAS and ERAD (c), miRNA maturation and dsRNA processing (d, e). luc: luciferase. (f-h) Quantification of GFP fluorescence intensity of ATM expressing worms in RNAi treatments against ERAS and ERAD (f) and secondary siRNA silencing (g). (i) Quantification of YFP fluorescence intensity of cpl-1* expressing worms with lof mutations for ERAS and/or mir-243. (j) Alpha-amanitin chase assays against cpl-1* mRNA in cpl-1* expressing worms with lof mutations for ERAS and/or mir-243, measured by qRT-PCR. Data relative to cdc-42 and pmp-3 mRNA. (k) hsp-4 mRNA level measured by qRT-PCR in cpl-1* expressing worms with lof mutations for ERAS and/or mir-243. Data relative to cdc-42 and pmp-3 mRNA. [(c)-(i)] Measurements were carried out with the BioSorter® using at least 200 animals per replicate, which were merged and displayed in ridgeline density plots. [(c)-(i)] were analyzed by pairwise t-test with Holmes multiple comparison test. (j) was analyzed by a two-way ANOVA with Sidak´s multiple comparison test. (k) was analyzed by one-way ANOVA with Dunnett’s multiple comparison test. Values are depicted as mean ± SEM [(j), (k)] or as mean (white circles) ± SD (white error bars) [(c)-(i)] generated from n = 3 independent experiments, *p < 0.05, **p < 0.01, ***p < 0.001, ns p > 0.05. WT: wild-type. Source numerical data are available in source data. Source data
Extended Data Fig. 5
Extended Data Fig. 5. AGO2 binds to endogenous mRNAs and supports ER stress resistance.
(a) Schematic illustration of PAZ-PIWI domain containing Argonaute proteins of C. elegans (RDE-1, ALG-1, ALG-2) and mammals (AGO2) showing the cross-species conservation of E414 in the PAZ domain, which is mutated to a lysine residue in the E414K mutation of the rde-1(ne219) allele. Aasterisk (*) indicates single conserved residues.:(colons) indicate conservation between groups of strongly similar properties, scoring >0.5 in the Gonnet PAM 250 matrix. Period (.) indicates conservation between groups of weakly similar properties, scoring = <0.5 in the Gonnet PAM 250 matrix. The alignment was performed by Clustal-Omega. (b) Genes identified in Fig. 5a-c were subjected to BUSCA subcellular localization analysis, showing a targeting of the obtained mRNAs to the endomembrane and secretory system. Results of the BUSCA analysis are summarized in Supplementary Table 4. (c) BiP mRNA level measured by qRT-PCR at the 0 h timepoint corresponding to the samples shown in Fig. 5h-k. Data relative to 18 S and 28 S rRNA. (d, e) Negative control experiments related to UV cross-linking immunoprecipitation (CLIP) experiments in Fig. 5f. CLIP of tunicamycin-treated Ago2−/− (d) or in Ago2+/+ MEF cells but without UV cross-linking (e). AGO2 was used as bait with subsequent qRT-PCR against C1rl, Nov, and Mertk target mRNAs in the input (IN), supernatant (SN) and immunoprecipitation (IP) fractions. Data normalized to input fraction. Top panels show western blots against AGO2 for the performed CLIP experiment. (f) Images of tunicamycin (TM)-treated Ago2+/+ and Ago−/− cell colonies stained with crystal violet. (c) was analyzed by unpaired two-tailed t-tests, [(d), (e)] were analyzed by a two-way ANOVA with Dunnett’s multiple comparison test. [(c), (d), (e)] Values are depicted as mean ± SEM generated from n = 3 [(c), (d)] or n = 2 (e) independent experiments, *p < 0.05, ***p < 0.001, ns p > 0.05. Source numerical data and unprocessed blots are available in source data. Source data
Extended Data Fig. 6
Extended Data Fig. 6. ERAS and ERAD maintain ER quality control and intestinal integrity.
(a) Western blot of worm lysates from worms depleted for ERAS and/or ERAD components expressing cpl-1WT in the WT (wild-type) or gfat-1 gain-of-function background detecting CPL-1WT (YFP) and tubulin (TUB). (b) Alpha-amanitin chase assays against cpl-1* mRNA from ERAS mutants and/or animals carrying a gfat-1 gain-of-function mutation expressing cpl-1*, measured by qRT-PCR. (c) hsp-4 mRNA level measured by qRT-PCR at the 0 h time point corresponding to the samples shown in (b). (d) Western blot of worm lysates corresponding to the data shown in Fig. 6e detecting mCherry::HDEL (mCherry) and tubulin (TUB). (e) Images showing the head and germline region of worms with the indicated genotypes after soaking in blue food dye (Brilliant Blue FCF). Blue dye leaking from the intestinal lumen into the body cavity gives rise to the Smurf phenotype. Scale bar: 200 µm. [(b), (c)] Data relative to cdc-42 and pmp-3 mRNA. (b) was analyzed by two-way ANOVA with Dunnett’s multiple comparison test, (c) was analyzed by one-way ANOVA with Sidak’s multiple comparison test. [(b), (c)] Values are depicted as mean ± SEM generated from n = 3 individuals, ***p < 0.001, ns p > 0.05. Source numerical data and unprocessed blots are available in source data. Source data

References

    1. Hetz C, Papa FR. The unfolded protein response and cell fate control. Mol. Cell. 2018;69:169–181. doi: 10.1016/j.molcel.2017.06.017. - DOI - PubMed
    1. Walter P, Ron D. The unfolded protein response: from stress pathway to homeostatic regulation. Science. 2011;334:1081–1086. doi: 10.1126/science.1209038. - DOI - PubMed
    1. Koksal AR, Verne GN, Zhou Q. Endoplasmic reticulum stress in biological processing and disease. J. Investig. Med. 2021;69:309–315. doi: 10.1136/jim-2020-001570. - DOI - PubMed
    1. Hetz C, Zhang K, Kaufman RJ. Mechanisms, regulation and functions of the unfolded protein response. Nat. Rev. Mol. Cell Biol. 2020;21:421–438. doi: 10.1038/s41580-020-0250-z. - DOI - PMC - PubMed
    1. Calfon M, et al. IRE1 couples endoplasmic reticulum load to secretory capacity by processing the XBP-1 mRNA. Nature. 2002;415:92–96. doi: 10.1038/415092a. - DOI - PubMed

Publication types

MeSH terms