

Electrophysiological and Psychophysical Measures of Temporal Pitch Sensitivity in Normal-hearing Listeners
- PMID: 36471208
- PMCID: PMC9971391
- DOI: 10.1007/s10162-022-00879-7
Electrophysiological and Psychophysical Measures of Temporal Pitch Sensitivity in Normal-hearing Listeners
Abstract
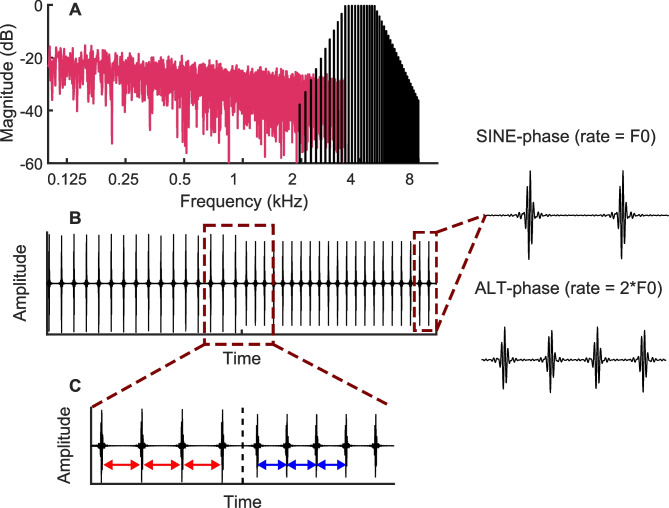
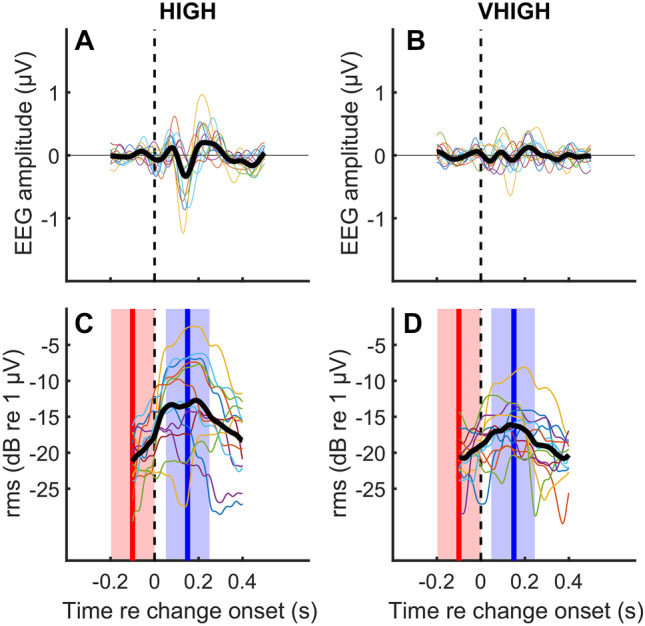
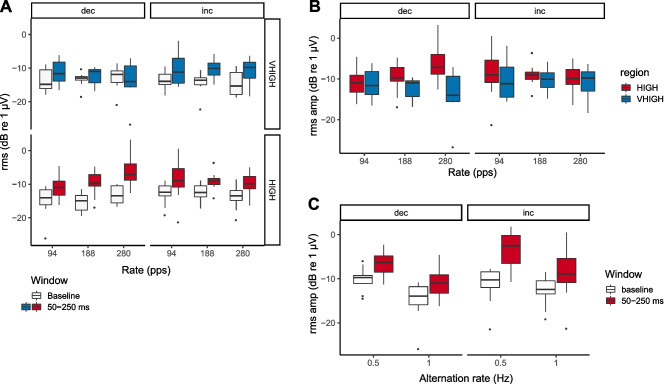
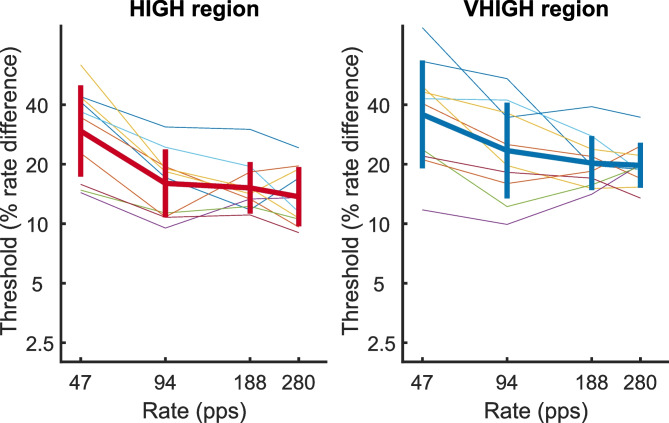
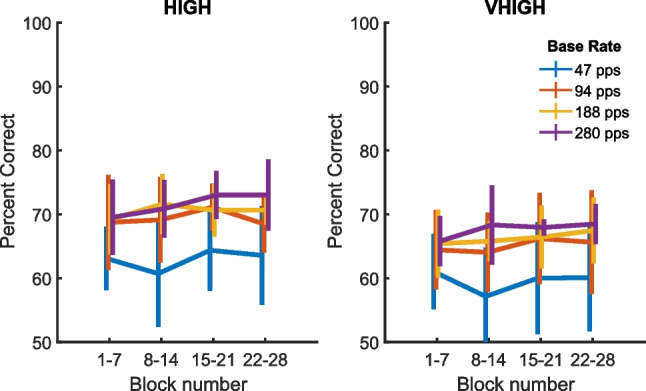
To obtain combined behavioural and electrophysiological measures of pitch perception, we presented harmonic complexes, bandpass filtered to contain only high-numbered harmonics, to normal-hearing listeners. These stimuli resemble bandlimited pulse trains and convey pitch using a purely temporal code. A core set of conditions consisted of six stimuli with baseline pulse rates of 94, 188 and 280 pps, filtered into a HIGH (3365-4755 Hz) or VHIGH (7800-10,800 Hz) region, alternating with a 36% higher pulse rate. Brainstem and cortical processing were measured using the frequency following response (FFR) and auditory change complex (ACC), respectively. Behavioural rate change difference limens (DLs) were measured by requiring participants to discriminate between a stimulus that changed rate twice (up-down or down-up) during its 750-ms presentation from a constant-rate pulse train. FFRs revealed robust brainstem phase locking whose amplitude decreased with increasing rate. Moderate-sized but reliable ACCs were obtained in response to changes in purely temporal pitch and, like the psychophysical DLs, did not depend consistently on the direction of rate change or on the pulse rate for baseline rates between 94 and 280 pps. ACCs were larger and DLs lower for stimuli in the HIGH than in the VHGH region. We argue that the ACC may be a useful surrogate for behavioural measures of rate discrimination, both for normal-hearing listeners and for cochlear-implant users. We also showed that rate DLs increased markedly when the baseline rate was reduced to 48 pps, and compared the behavioural and electrophysiological findings to recent cat data obtained with similar stimuli and methods.
Keywords: Auditory change complex; Emporal pitch perception; Frequency following response; Psychophysics.
© 2022. The Author(s).
Conflict of interest statement
The authors declare no competing interests.
Figures


Similar articles
-
Temporal Pitch Sensitivity in an Animal Model: Psychophysics and Scalp Recordings : Temporal Pitch Sensitivity in Cat.J Assoc Res Otolaryngol. 2022 Aug;23(4):491-512. doi: 10.1007/s10162-022-00849-z. Epub 2022 Jun 6. J Assoc Res Otolaryngol. 2022. PMID: 35668206 Free PMC article.
-
Pitch and loudness matching of unmodulated and modulated stimuli in cochlear implantees.Hear Res. 2013 Aug;302:32-49. doi: 10.1016/j.heares.2013.05.004. Epub 2013 May 16. Hear Res. 2013. PMID: 23685148
-
Rate pitch discrimination in cochlear implant users with the use of double pulses and different interpulse intervals.Cochlear Implants Int. 2019 Nov;20(6):312-323. doi: 10.1080/14670100.2019.1656847. Epub 2019 Aug 25. Cochlear Implants Int. 2019. PMID: 31448701
-
Electrical stimulation of the auditory nerve: the coding of frequency, the perception of pitch and the development of cochlear implant speech processing strategies for profoundly deaf people.Clin Exp Pharmacol Physiol. 1996 Sep;23(9):766-76. doi: 10.1111/j.1440-1681.1996.tb01178.x. Clin Exp Pharmacol Physiol. 1996. PMID: 8911712 Review.
-
Pitch perception and auditory stream segregation: implications for hearing loss and cochlear implants.Trends Amplif. 2008 Dec;12(4):316-31. doi: 10.1177/1084713808325881. Epub 2008 Oct 30. Trends Amplif. 2008. PMID: 18974203 Free PMC article. Review.
Cited by
-
Frequency Following Responses to Electric Cochlear Stimulation in an Animal Model.J Assoc Res Otolaryngol. 2025 Aug;26(4):427-449. doi: 10.1007/s10162-025-00992-3. Epub 2025 May 21. J Assoc Res Otolaryngol. 2025. PMID: 40399500 Free PMC article.
-
Artifact removal by template subtraction enables recordings of the frequency following response in cochlear-implant users.Sci Rep. 2024 Mar 14;14(1):6158. doi: 10.1038/s41598-024-56047-9. Sci Rep. 2024. PMID: 38486005 Free PMC article.
-
Temporal Pitch Sensitivity in an Animal Model: Psychophysics and Scalp Recordings : Temporal Pitch Sensitivity in Cat.J Assoc Res Otolaryngol. 2022 Aug;23(4):491-512. doi: 10.1007/s10162-022-00849-z. Epub 2022 Jun 6. J Assoc Res Otolaryngol. 2022. PMID: 35668206 Free PMC article.
References
-
- Moore BCJ, Glasberg BR, Peters RW. Relative dominance of individual partials in determining the pitch of complex tones. J Acoust Soc Am. 1985;77:1853–1860. doi: 10.1121/1.391936. - DOI
-
- Hoekstra A (1979) Frequency discrimination and frequency analysis in hearing. In: Institute of Audiology, University Hospital, Groningen, Netherlands.
-
- Houtsma AJM, Smurzynski J. J.F.Schouten revisited: pitch of complex tones having many high-order harmonics. J Acoust Soc Am. 1990;87:304–310. doi: 10.1121/1.399297. - DOI
Publication types
MeSH terms
Grants and funding
LinkOut - more resources
Full Text Sources
Medical
Miscellaneous
