. 2023 Feb 20;35(2):924-941.
doi: 10.1093/plcell/koac351.

Mutation of the polyadenylation complex subunit CstF77 reveals that mRNA 3' end formation and HSP101 levels are critical for a robust heat stress response

Affiliations

Mutation of the polyadenylation complex subunit CstF77 reveals that mRNA 3' end formation and HSP101 levels are critical for a robust heat stress response

Minsoo Kim et al. Plant Cell. .

Abstract

Heat shock protein 101 (HSP101) in plants, and bacterial and yeast orthologs, is essential for thermotolerance. To investigate thermotolerance mechanisms involving HSP101, we performed a suppressor screen in Arabidopsis thaliana of a missense HSP101 allele (hot1-4). hot1-4 plants are sensitive to acclimation heat treatments that are otherwise permissive for HSP101 null mutants, indicating that the hot1-4 protein is toxic. We report one suppressor (shot2, suppressor of hot1-4 2) has a missense mutation of a conserved residue in CLEAVAGE STIMULATION FACTOR77 (CstF77), a subunit of the polyadenylation complex critical for mRNA 3' end maturation. We performed ribosomal RNA depletion RNA-Seq and captured transcriptional readthrough with a custom bioinformatics pipeline. Acclimation heat treatment caused transcriptional readthrough in hot1-4 shot2, with more readthrough in heat-induced genes, reducing the levels of toxic hot1-4 protein and suppressing hot1-4 heat sensitivity. Although shot2 mutants develop like the wild type in the absence of stress and survive mild heat stress, reduction of heat-induced genes and decreased HSP accumulation makes shot2 in HSP101 null and wild-type backgrounds sensitive to severe heat stress. Our study reveals the critical function of CstF77 for 3' end formation of mRNA and the dominant role of HSP101 in dictating the outcome of severe heat stress.


Conflict of interest statement

Conflict of interest statement. The authors declare no competing interests.

Figures
Figure 1
Figure 1
Heat stress phenotype and immunoblot analysis of extragenic suppressors of hot1–4. A, Three suppressor mutants were isolated. The degree of suppression was measured by hypocotyl elongation of dark-grown seedlings after heat treatment at 38°C for 3 h. Horizontal lines in boxes indicate the median, the bottom and top of each box denote the first and third quartile, respectively. The lower and upper whiskers denote the smallest value within 1.5 times interquartile range below 25th percentile and the largest value within 1.5 times interquartile range above 75th percentile, respectively. Sample sizes: Col-0 (12), hot1–4 (12), hot1–4 shot2 (22), hot1–4 shot3 (23), and hot1–4 shot4 (10). Different letters indicate significant differences (P < 0.01) by one-way ANOVA followed by Tukey's post hoc test. B, HSP101 protein levels were checked by immunoblot analysis of samples from 3-day-old dark-grown seedlings with or without heat treatment at 38°C for 3 h. Immunoblot against anti-GAPC (glyceraldehyde-3-phosphate dehydrogenase, cytosolic) is shown as a loading control. C, Heat stress tolerance was measured by hypocotyl elongation after 45°C for 50 min following acclimation treatment (AC = 38°C for 1.5 h, 22°C for 2 h). Horizontal lines in boxes indicate the median, and the bottom and top of each box denote the first and third quartile, respectively. The lower and upper whiskers denote the smallest value within 1.5 times interquartile range below 25th percentile and the largest value within 1.5 times interquartile range above 75th percentile, respectively. Sample sizes: Col-0 (12), hot1–3 (12), hot1–4 (13), hot1–4 shot2 (12), hot1–4 shot3 (11), and hot1–4 shot4 (14). Different letters indicate significant differences (P < 0.01) by one-way ANOVA followed by Tukey's post hoc test. The hypocotyl elongation assays in (A) and (B) were repeated more than 3 times with similar results.
Figure 2
Figure 2
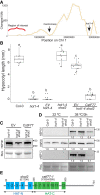
A mutation in the CstF77 gene is responsible for the suppressor phenotype of the shot2 mutant. A, DNA sequence changes in the F3 mapping population were plotted along Chromosome 1. The causal mutation for the suppressor phenotype is located on the upper arm of Chromosome 1 as indicated. B, T1 transgenic plants carrying the wild-type CstF77 gene showed recovery of the heat-sensitive phenotype in hot1-4 shot2. Hypocotyl length of dark-grown seedlings was measured after heat treatment at 38°C for 3 h. Horizontal lines in boxes indicate the median, and the bottom and top of each box denote the first and third quartile, respectively. The lower and upper whiskers denote the smallest value within 1.5 times interquartile range below 25th percentile and the largest value within 1.5 times interquartile range above 75th percentile, respectively. Sample sizes: Col-0 (11), hot1–4 (12), EV hot1–4 (12), hot1–4 shot2 (12), EV hot1–4 shot2 (13), and CstF77 hot1–4 shot2 (12). Different letters indicate significant differences (P < 0.01) by one-way ANOVA followed by Tukey's post hoc test. The assay was performed twice with similar results. EV, empty vector control. C, Immunoblot shows that the introduction of the wild-type CstF77 gene recovers accumulation of HSP101. Protein was extracted from leaves of 3-week-old T1 plants of the indicated genotypes. Ponceau-S-stained rubisco large subunit (RbcL) is shown as a loading control. D, Immunoblot analysis of HSP101, HSP70, and cytosolic class I sHSPs (sHSP CI). The hot1-4 shot2 mutant accumulates less HSP101 and cytosolic Class I sHSPs. Ponceau-S-stained rubisco large subunit (RbcL) is shown as a loading control. E, Domain organization of the SHOT2/CstF77 protein. The HAT (Half-A-TPR)-N and -C domains contain the first five HAT motifs (blue) and the other seven HAT motifs (green), respectively. Position of the shot2 mutation and the cstf77-1 allele discussed in the text are denoted in an asterisk and a dotted line.
Figure 3
Figure 3
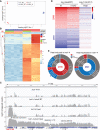
Most heat-inducible genes accumulate lower transcripts in hot1–4 shot2 compared with in hot1–4. A, Multidimensional scaling plot of RNA-Seq expression profiles in two dimensions. The hot1–4 (h1) and hot1–4 shot2 (h1sh2) were treated with (H) or without (RT) heat stress (38°C/3 h). There are three biological replicates for each group. B, Heat map of the top 200 genes with the largest fold-change from the RNA-Seq experiment. The genes were grouped into three clusters (I–III) as indicated in the cladogram. Expression is scaled to z-scores of log2 (counts per million). C, Mapped reads on HSP17.6C and its downstream region showing abundant readthrough reads in hot1–4 shot2 plants under heat treatment (log10 scale). The HSP17.6C gene is oriented from left to right. Genes with the same orientation are shown with arrows. TE, transposable element. The vertical red line indicates a missense mutation (A65V) in hot1–4 shot2 introduced by mutagenesis. D, The 5326 genes differentially expressed in hot1–4 in response to heat treatment (FDR < 0.01, |log2FC| > 1, left column) were tracked in hot1–4 shot2 samples upon heat treatment (compared to hot1–4 shot2-RT, middle column) and under heat treatment (compared with hot1–4-Heat, right column). E, Pie charts showing proportions of differentially expressed genes as shown in (D). 5326 genes expressed differentially in hot1-4 by heat were separated into two pies (2785 genes upregulated on the left and 2541 genes downregulated on the right). The inner and outer pies represent proportions in the middle column and right column in (D), respectively.
Figure 4
Figure 4
The shot2 mutation causes transcription termination defects in HSP101. A, An IGV (Integrative Genomics Viewer) snapshot of the HSP101 locus shows readthrough reads (salmon color) downstream of the TTS in a heat-treated hot1–4 shot2 sample. The orientation of genes is denoted by black arrows. The TTS of HSP101 is indicated by a vertical blue line and a blue arrow. The red vertical lines indicate the hot1–4 mutation. B, Confirmation of RNA-Seq results by RT-qPCR analysis of HSP101 (left) and a downstream read-in gene AT1G74300 (right) using cDNA synthesized with either oligo-dT (PolyA) or random hexamers (Random). Transcript levels are reported relative to heat-treated hot1-4 samples. ACTIN2 was used as a reference gene. Data are mean ± SEM of three biological replicates.
Figure 5
Figure 5
The shot2 plants express auxin signaling genes and the COOLAIR gene like the wild type. Transcript levels relative to each wild-type sample (Col-0 or JU223) are shown. Two primer pair sets for each of IAA7, ARF9, and COOLAIR genes were tested for RT-qPCR. ACTIN2 was used as the reference gene. P-values for a significant change (two-tailed Student's t test) are shown above each comparison. Three biological replicates were performed. Data are mean ± SEM of three biological replicates.
Figure 6
Figure 6
Heat-inducible genes are affected most by shot2. A, Illustration of how the likelihood of readthrough transcription (LoR) is calculated. The number of reads that align 100 bp upstream and downstream of a transcription stop site (TTS) of a gene are counted. The ratios (R) of downstream read counts to upstream read counts are calculated and averaged for the three biological replicates of the four groups. LoR by shot2 under heat stress is calculated by subtracting the mean ratios of hot1–4 from the mean ratios of hot1–4 shot2. A putative gene model is depicted with exons in black rectangles, 3′-UTR in white rectangle and introns with a line. The blue and red reads overlap at least 30% with the upstream and downstream region, respectively, while the purple reads overlap with both regions. B, Over-represented GO biological processes in genes with or without readthrough reads. The most representative and significant biological processes are shown with fold enrichment. The dot size indicates the number of genes associated with the process and the dot color gradient indicates the significance of the enrichment [−log10 (FDR-corrected P-values)]. The vertical gray dashed lines represent a fold enrichment of 1.0. C. The 527 genes with at least 10 reads in the 100-bp upstream region of the TTS in heated hot1–4 samples were plotted to look at the relationship between heat inducibility (log2FC [H vs RT in hot1–4]) and LoR. A regression line with R2 value is overlayed on the graph to show the trend. H, heat; RT, room temperature. D, The same genes were plotted to look at the relationship between readthrough (LoR) and gene expression fold-change in hot1–4 shot2 compared with in hot1–4 under heat treatment. h1sh2_H: hot1–4 shot2 heated samples, h1_H: hot1–4 heated samples.
Figure 7
Figure 7
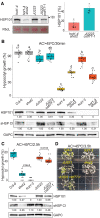
The shot2 single mutant is more sensitive to heat stress. A, HSP101 protein accumulation is reduced by mutations in the CstF77 gene. Total proteins were extracted after 38°C for 3 h followed by 1 h recovery at room temperature. A representative immunoblot is shown on the left. Ponceau-S-stained RbcL (Rubisco large subunit) was used as a loading control. Quantitative measurements of HSP101 protein level relative to each wild type from three independent biological samples are shown in a bar graph on the right. Error bars represent the standard deviation. B, Heat stress tolerance was measured by hypocotyl elongation after heat stress treatment at 45°C for 30 min following acclimation treatment (AC > 45°C/30 min). Horizontal lines in boxes indicate the median, the bottom and top of each box denote the first and third quartile, respectively. The lower and upper whiskers denote the smallest value within 1.5 times interquartile range below 25th percentile and the largest value within 1.5 times interquartile range above 75th percentile, respectively. Sample sizes: Col-0 (18), shot2 (17), JU223 (16), JU223 cstf77-1 (14), hot1–4 (16), hot1–4 shot2 (16), hot1–3 (15), and hot1–3 shot2 (15). Different letters indicate significant differences (P < 0.01) by one-way ANOVA followed by Tukey's post hoc test. Representative immunoblots of HSP101 and Class I sHSPs are shown below the graph. GAPC was used as a loading control. Quantitative measurements of protein level relative to each wild type are shown below each blot. C, Heat stress tolerance was measured by hypocotyl elongation after 45°C for 2.5 h following acclimation treatment (AC > 45°C/2.5 h). Horizontal lines in boxes indicate the median, the bottom and top of each box denote the first and third quartile, respectively. The lower and upper whiskers denote the smallest value within 1.5 times interquartile range below 25th percentile and the largest value within 1.5 times interquartile range above 75th percentile, respectively. Sample sizes: Col-0 (15), shot2 (16), hot1–3 (17), JU223 (15), and JU223 cstf77-1 (15). P-values from two-tailed t tests of each comparison are shown in the graph. Representative immunoblots of HSP101 and Class I sHSPs are shown below the graph. GAPC was used as a loading control. Quantitative measurements of protein level relative to each wild-type are shown below each blot. D, Heat stress tolerance of light-grown seedlings was tested after 45°C for 3.5 h following acclimation treatment (AC > 45°C/3.5 h). The heat stress assays in (B–D) were repeated more than once with similar results.

Similar articles

Cited by

References

    1. Alpert T, Straube K, Oesterreich FC, Neugebauer KM (2020) Widespread transcriptional readthrough caused by Nab2 depletion leads to chimeric transcripts with retained introns. Cell Rep 33(4): 108324. - PMC - PubMed
    1. Anders S, Pyl PT, Huber W (2015) HTSeq—a Python framework to work with high-throughput sequencing data. Bioinformatics 31(2): 166–169 - PMC - PubMed
    1. Andreassi C, Riccio A (2009) To localize or not to localize: mRNA fate is in 3′UTR ends. Trends Cell Biol 19(9): 465–474 - PubMed
    1. Antosz W, Pfab A, Ehrnsberger HF, Holzinger P, Köllen K, Mortensen SA, Bruckmann A, Schubert T, Längst G, Griesenbeck J, et al. (2017) The composition of the Arabidopsis RNA polymerase II transcript elongation complex reveals the interplay between elongation and mRNA processing factors. Plant Cell 29(4): 854–870 - PMC - PubMed
    1. Bai Y, Auperin TC, Chou C-Y, Chang G-G, Manley JL, Tong L (2007) Crystal structure of murine CstF-77: dimeric association and implications for polyadenylation of mRNA precursors. Mol Cell 25(6): 863–875 - PubMed

Publication types

MeSH terms

LinkOut - more resources