

A theoretical model of efficient phagocytosis driven by curved membrane proteins and active cytoskeleton forces
- PMID: 36472164
- PMCID: PMC10078962
- DOI: 10.1039/d2sm01152b
A theoretical model of efficient phagocytosis driven by curved membrane proteins and active cytoskeleton forces
Abstract
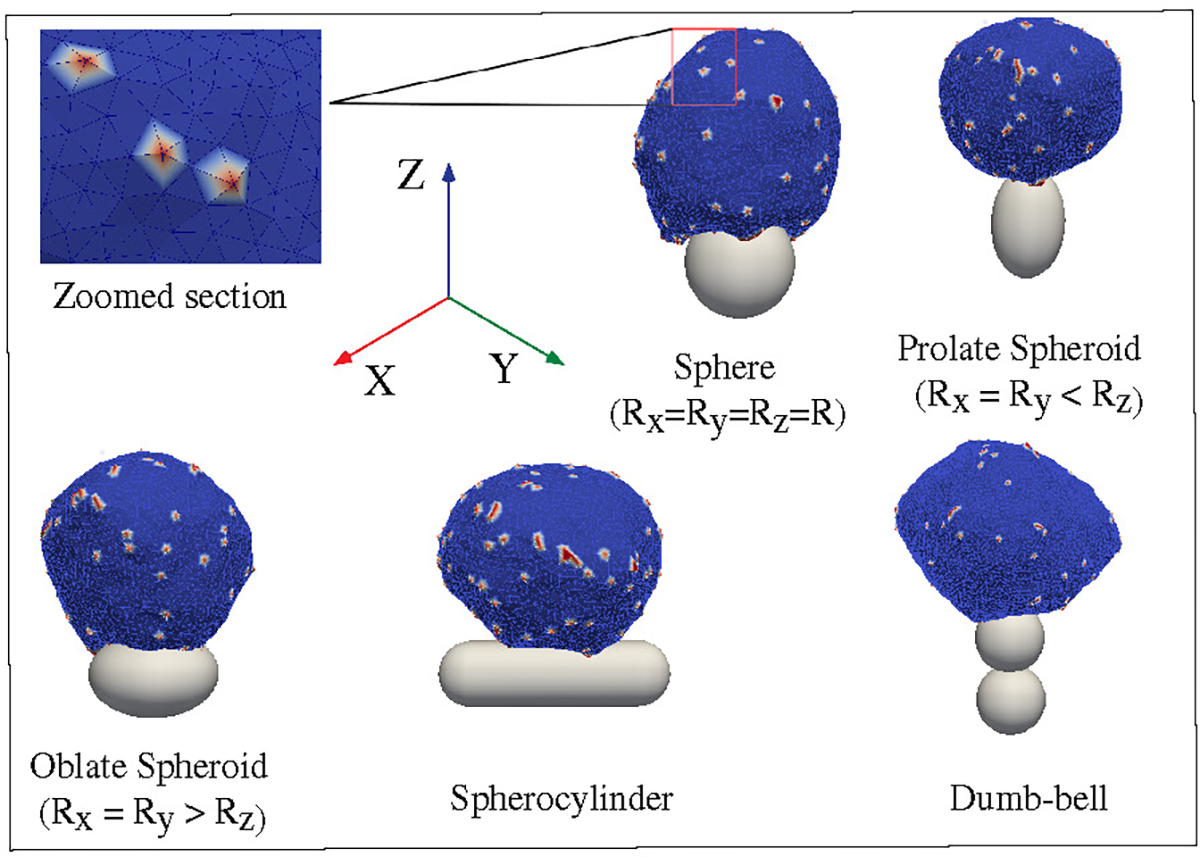
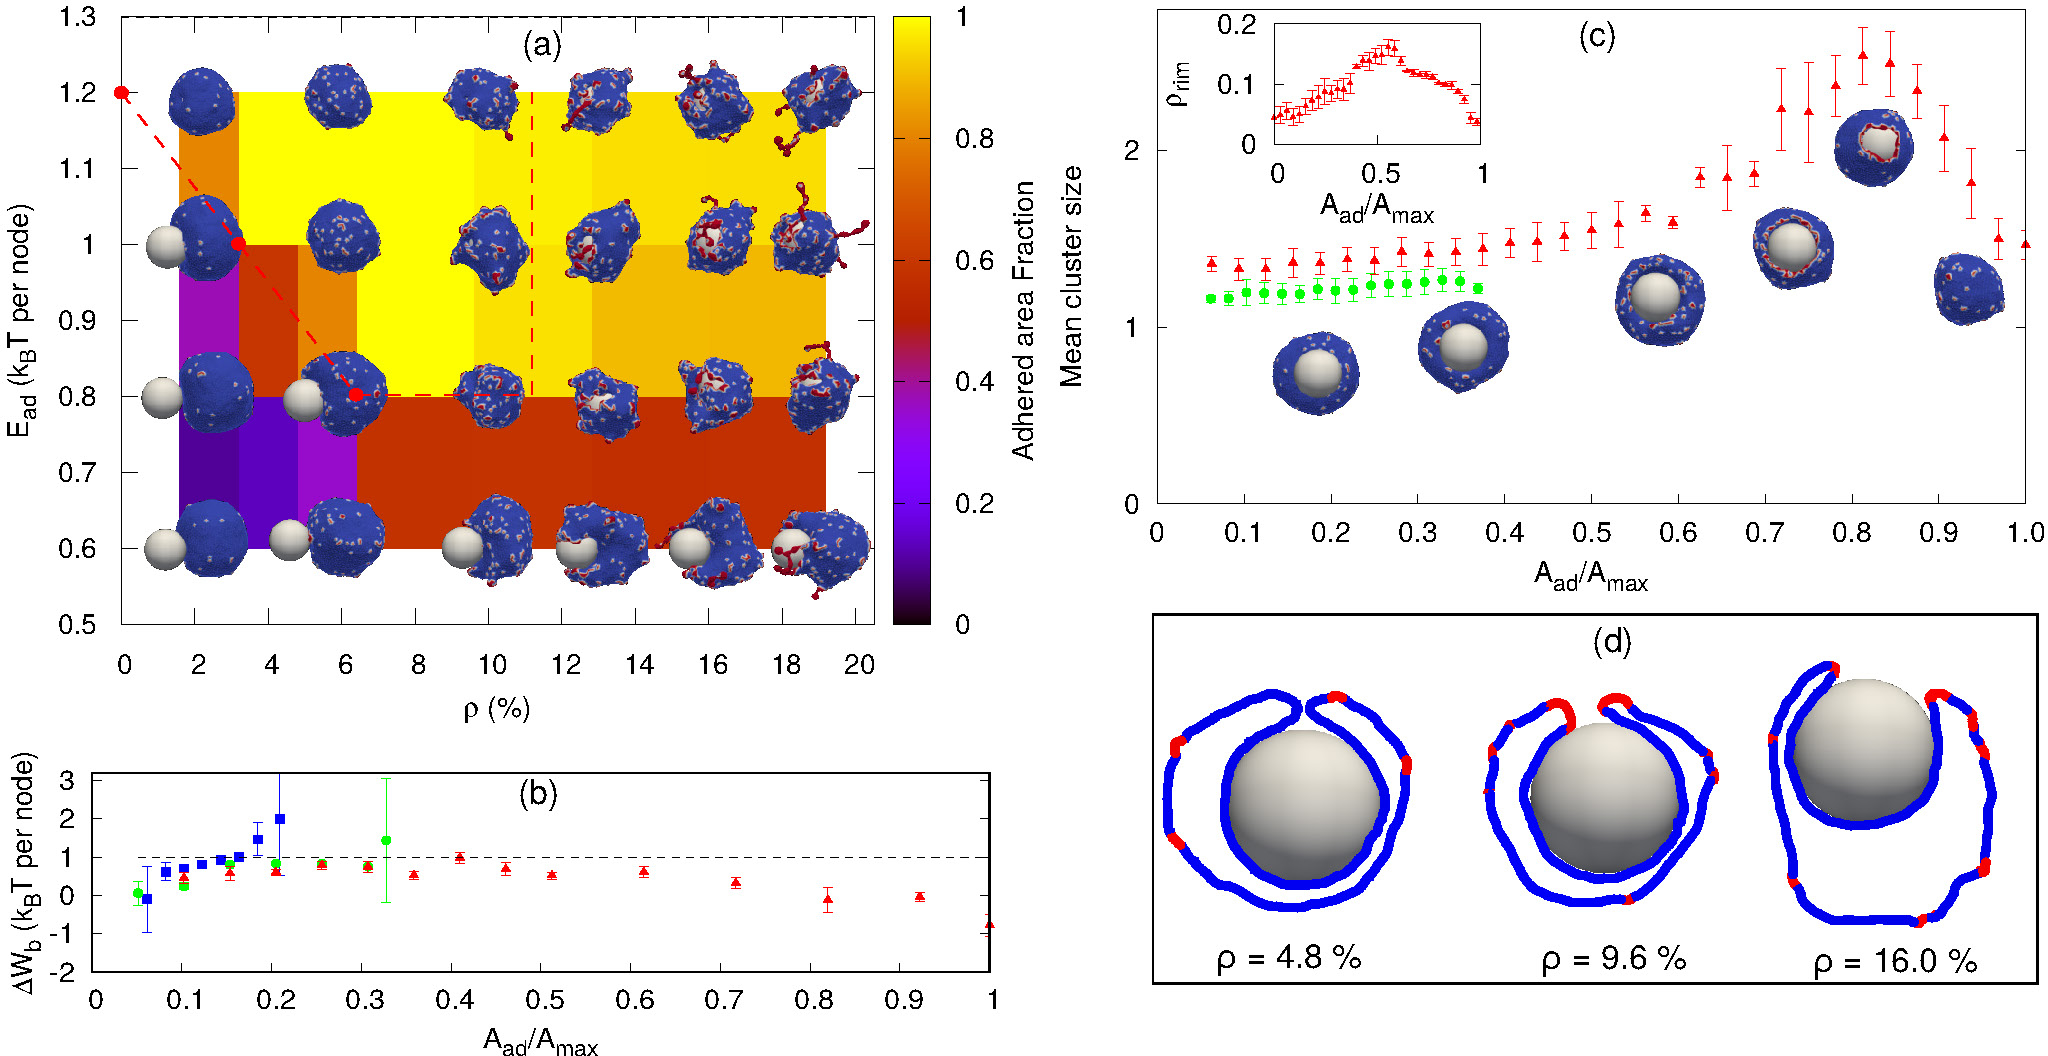
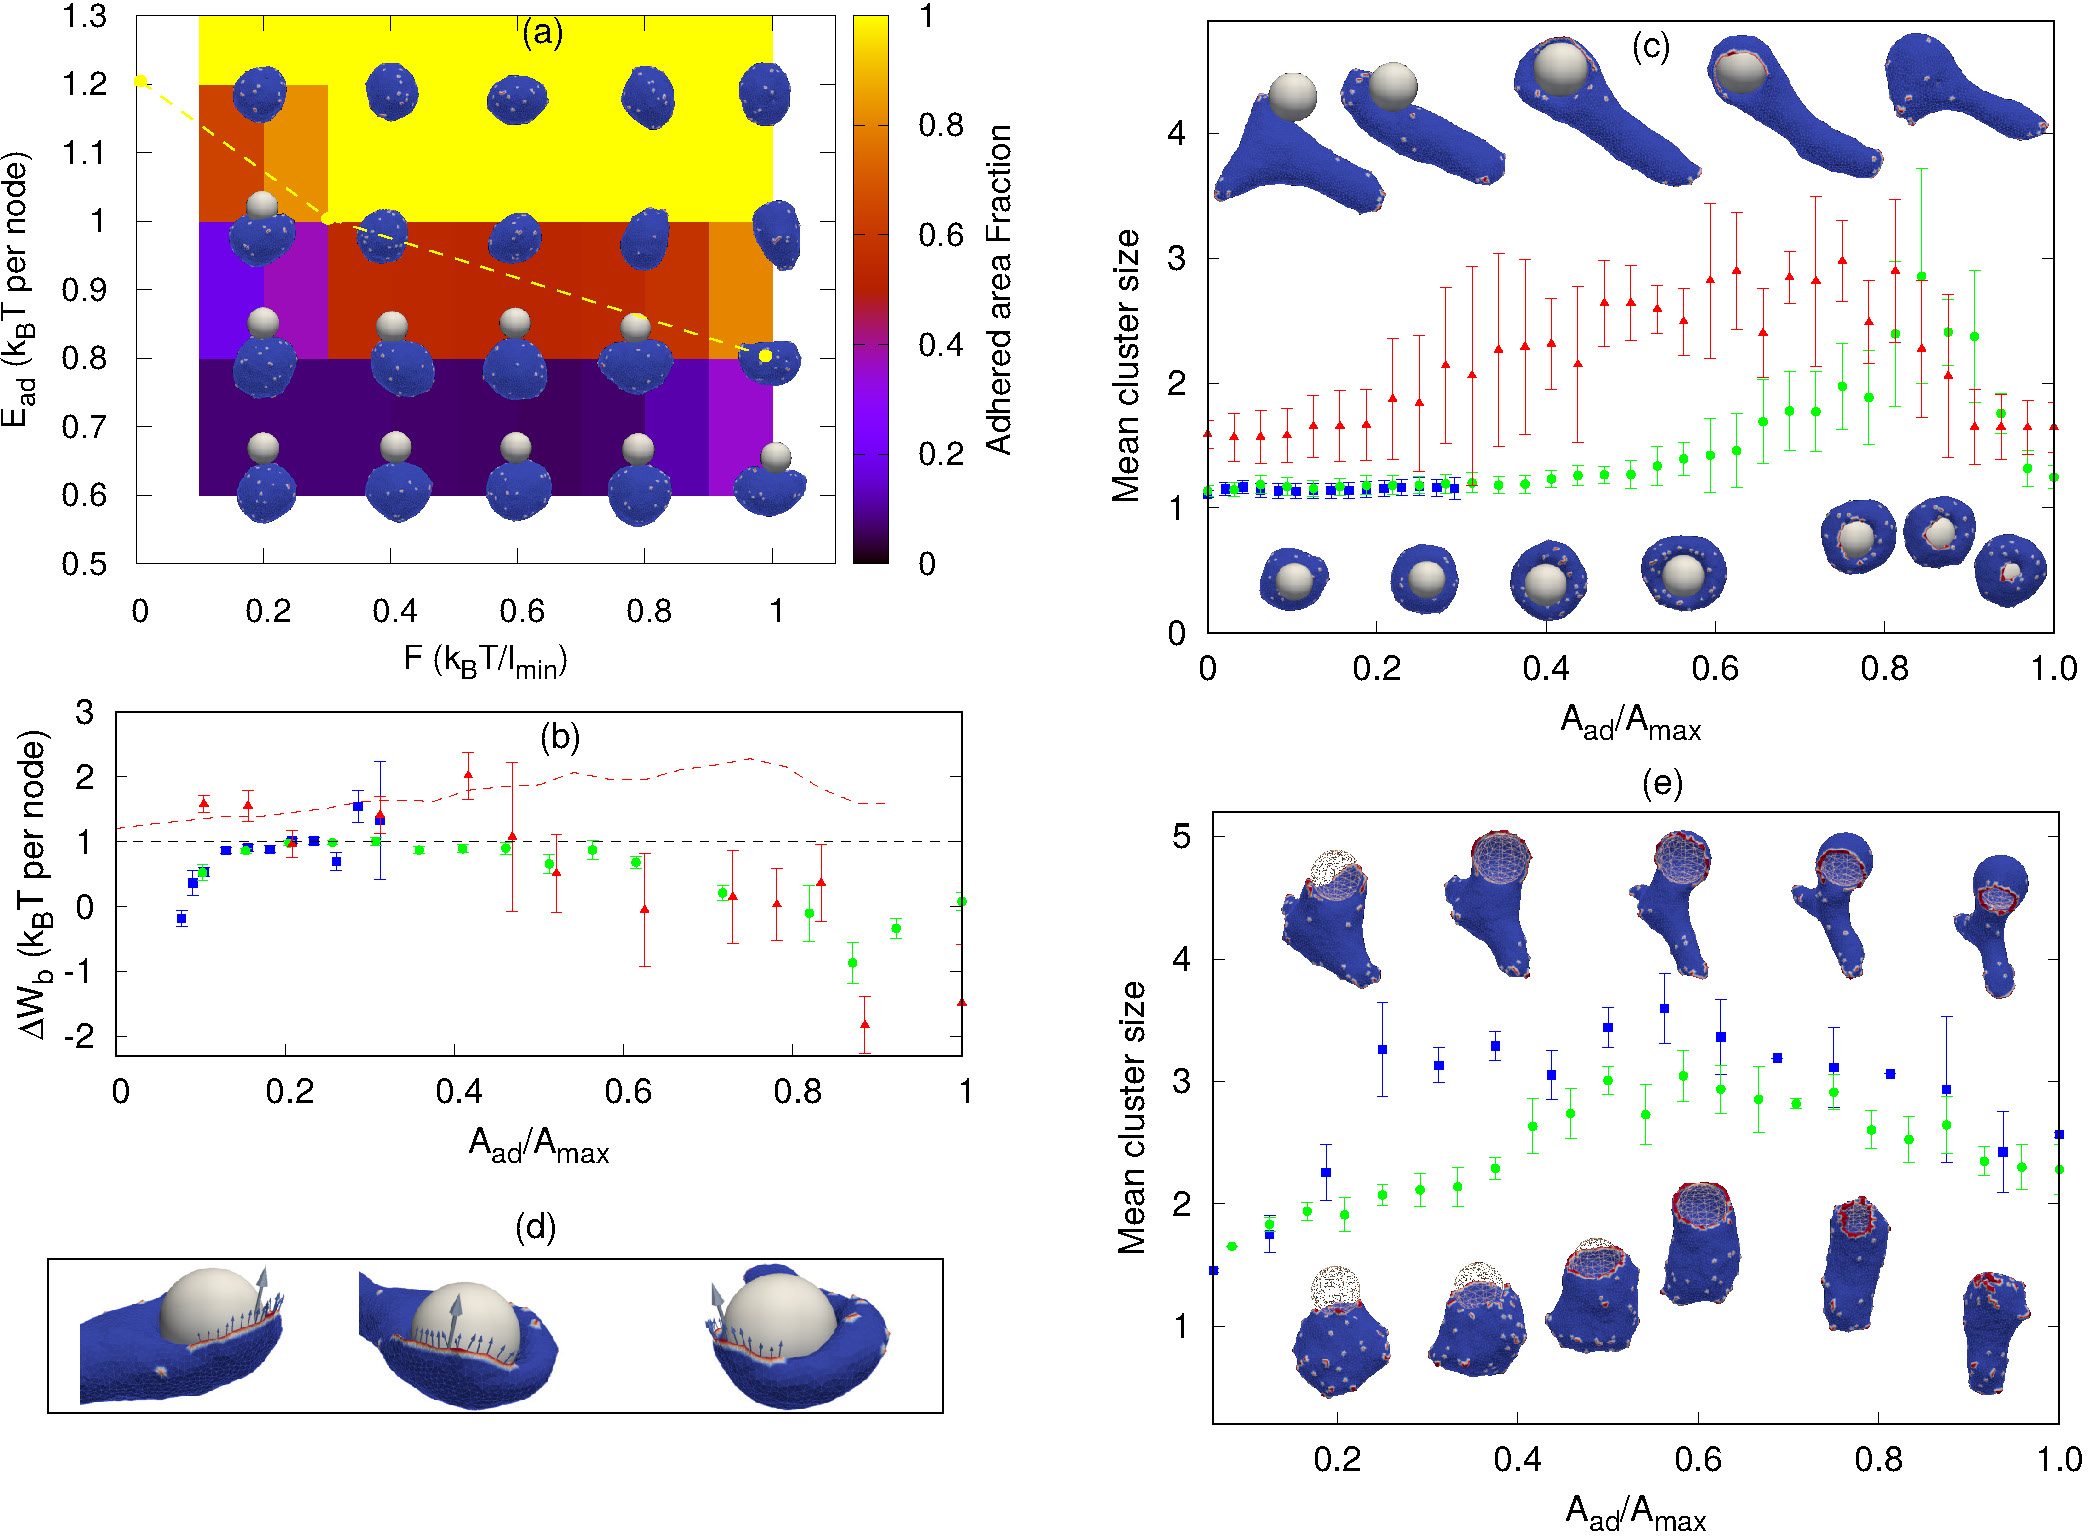
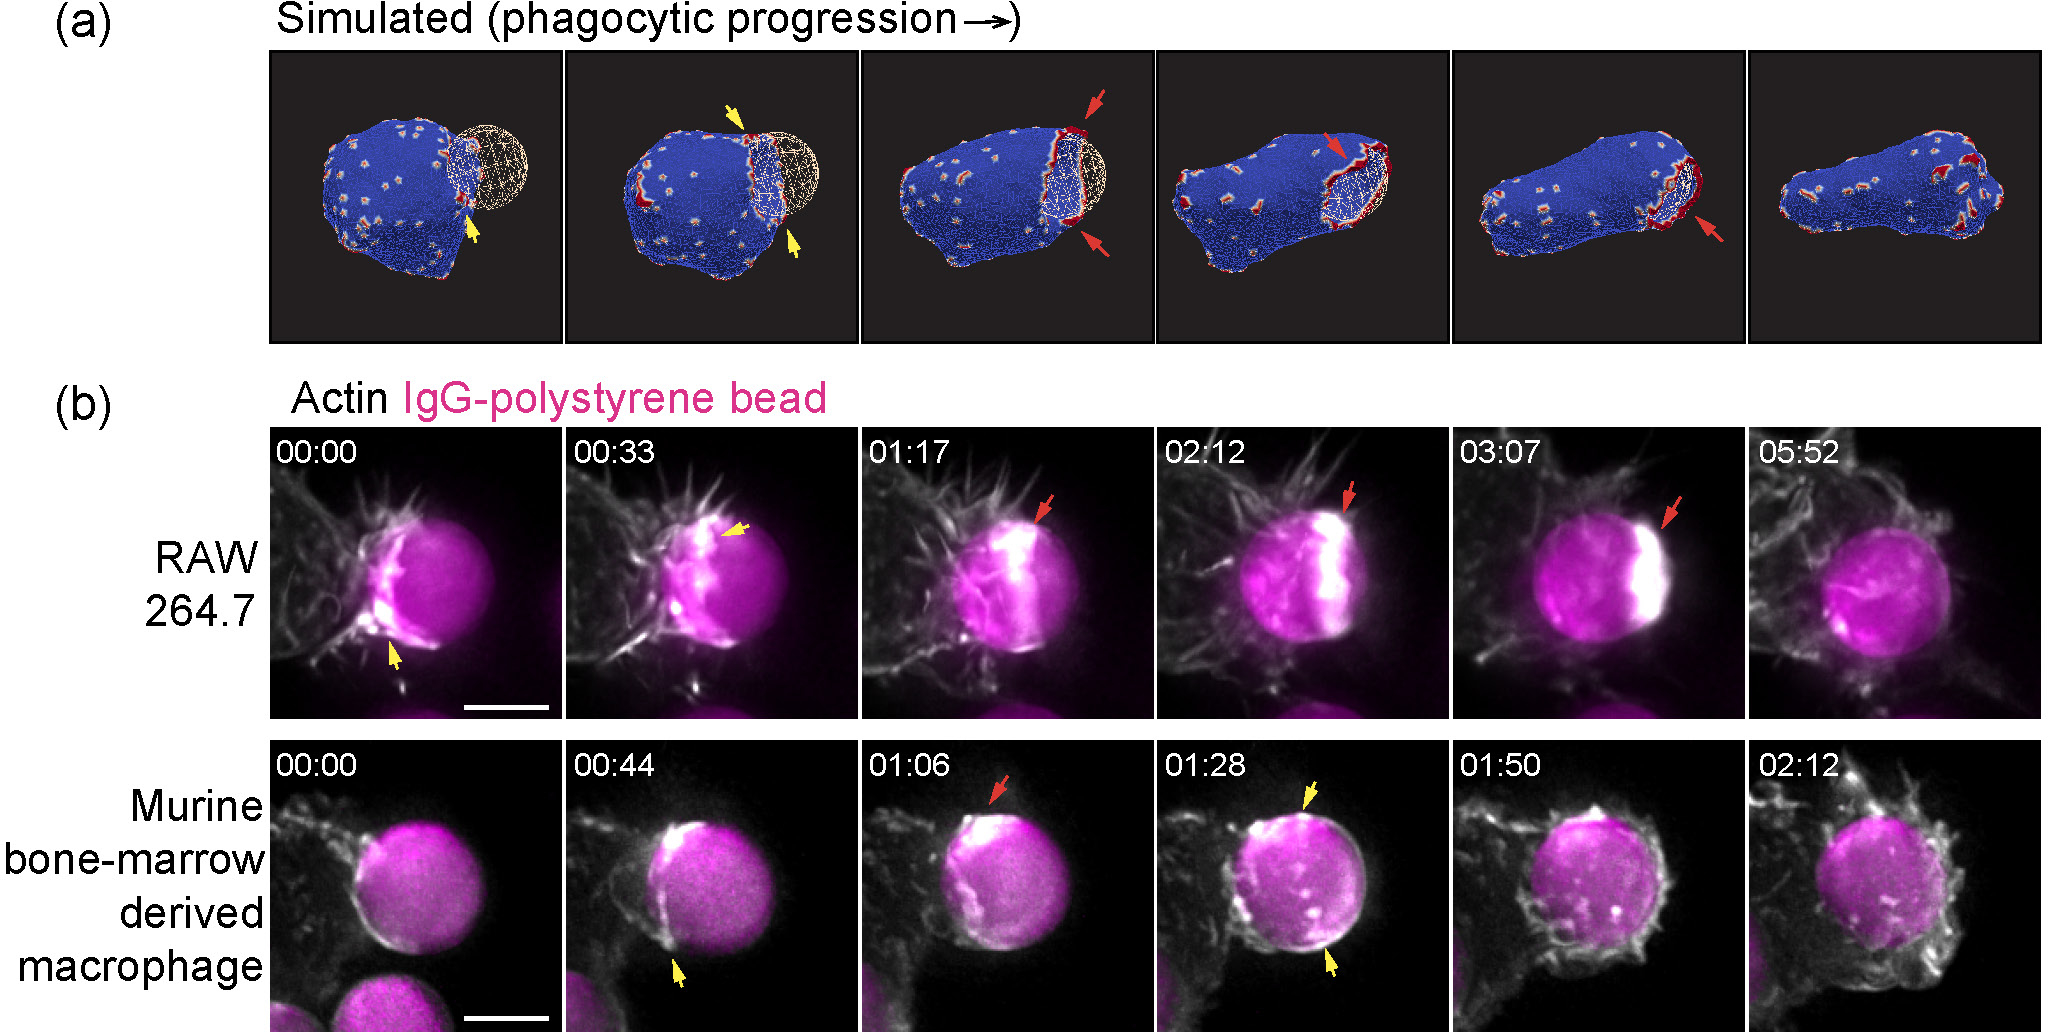
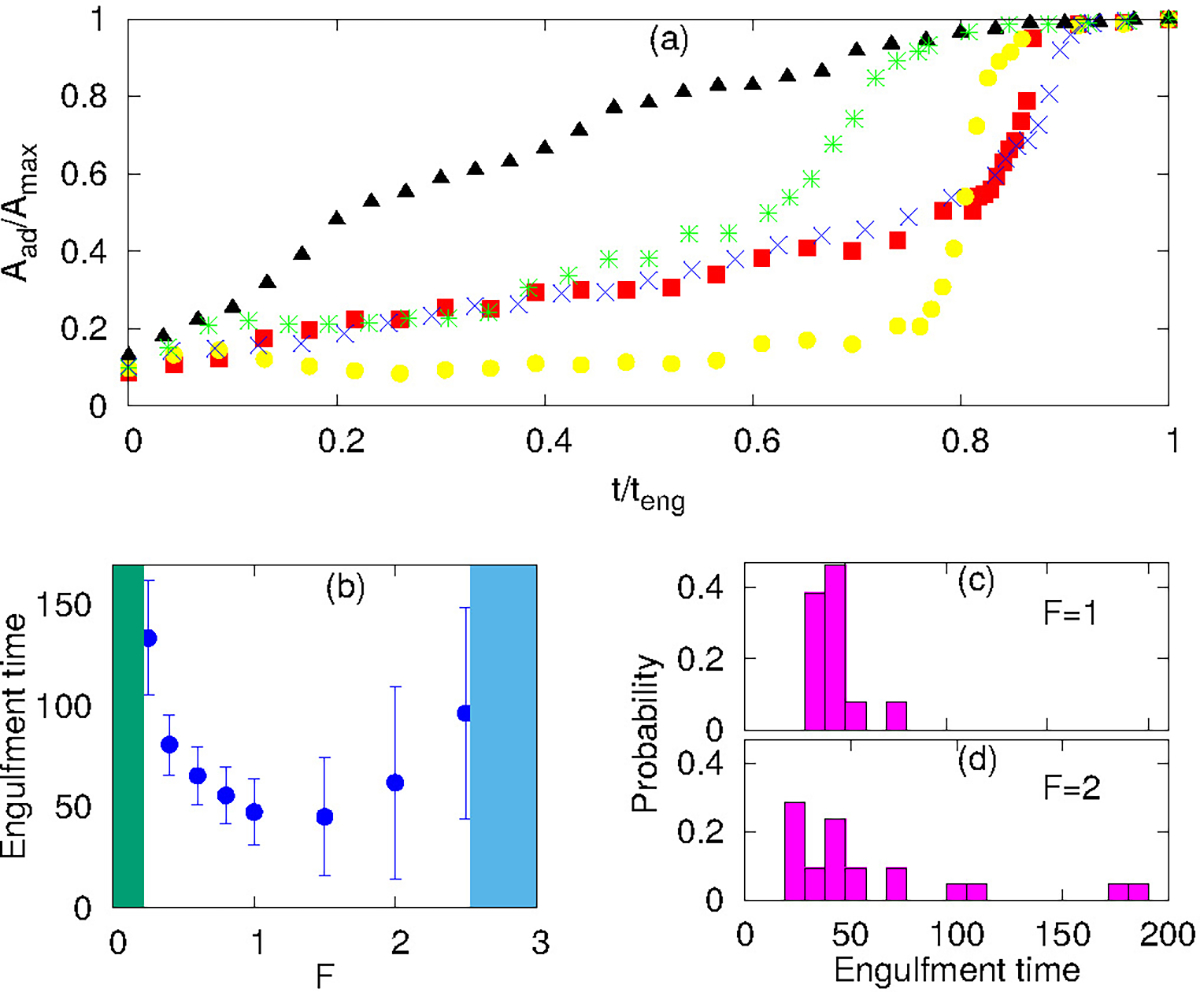
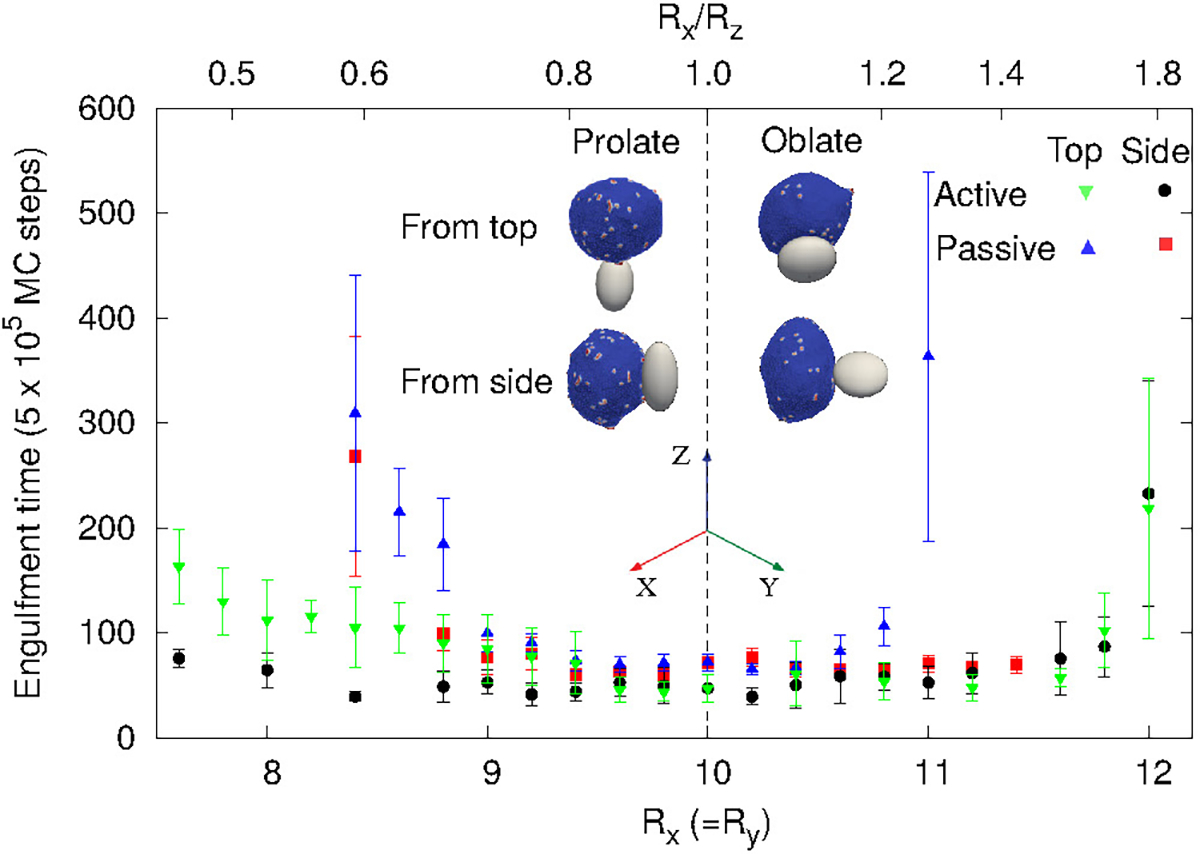
Phagocytosis is the process of engulfment and internalization of comparatively large particles by cells, and plays a central role in the functioning of our immune system. We study the process of phagocytosis by considering a simplified coarse grained model of a three-dimensional vesicle, having a uniform adhesion interaction with a rigid particle, and containing curved membrane-bound protein complexes or curved membrane nano-domains, which in turn recruit active cytoskeletal forces. Complete engulfment is achieved when the bending energy cost of the vesicle is balanced by the gain in the adhesion energy. The presence of curved (convex) proteins reduces the bending energy cost by self-organizing with a higher density at the highly curved leading edge of the engulfing membrane, which forms the circular rim of the phagocytic cup that wraps around the particle. This allows the engulfment to occur at much smaller adhesion strength. When the curved membrane-bound protein complexes locally recruit actin polymerization machinery, which leads to outward forces being exerted on the membrane, we found that engulfment is achieved more quickly and at a lower protein density. We consider spherical and non-spherical particles and found that non-spherical particles are more difficult to engulf in comparison to the spherical particles of the same surface area. For non-spherical particles, the engulfment time crucially depends on the initial orientation of the particles with respect to the vesicle. Our model offers a mechanism for the spontaneous self-organization of the actin cytoskeleton at the phagocytic cup, in good agreement with recent high-resolution experimental observations.
Conflict of interest statement
Declaration of Interest
The authors declare no competing interests.
Figures
Similar articles
-
The zipper mechanism in phagocytosis: energetic requirements and variability in phagocytic cup shape.BMC Syst Biol. 2010 Nov 8;4:149. doi: 10.1186/1752-0509-4-149. BMC Syst Biol. 2010. PMID: 21059234 Free PMC article.
-
Building the phagocytic cup on an actin scaffold.Curr Opin Cell Biol. 2022 Aug;77:102112. doi: 10.1016/j.ceb.2022.102112. Epub 2022 Jul 9. Curr Opin Cell Biol. 2022. PMID: 35820329 Free PMC article. Review.
-
A minimal cell model for lamellipodia-based cellular dynamics and migration.J Cell Sci. 2023 Jul 15;136(14):jcs260744. doi: 10.1242/jcs.260744. Epub 2023 Jul 27. J Cell Sci. 2023. PMID: 37497740 Review.
-
Evidence for a molecular complex consisting of Fyb/SLAP, SLP-76, Nck, VASP and WASP that links the actin cytoskeleton to Fcgamma receptor signalling during phagocytosis.J Cell Sci. 2001 Dec;114(Pt 23):4307-18. doi: 10.1242/jcs.114.23.4307. J Cell Sci. 2001. PMID: 11739662
-
Propagating cell-membrane waves driven by curved activators of actin polymerization.PLoS One. 2011 Apr 21;6(4):e18635. doi: 10.1371/journal.pone.0018635. PLoS One. 2011. PMID: 21533032 Free PMC article.
Cited by
-
Role of particle local curvature in cellular wrapping.J R Soc Interface. 2022 Nov;19(196):20220462. doi: 10.1098/rsif.2022.0462. Epub 2022 Nov 2. J R Soc Interface. 2022. PMID: 36321371 Free PMC article.
-
In silico and in vitro study of the adhesion dynamics of erythrophagocytosis in sickle cell disease.Biophys J. 2023 Jun 20;122(12):2590-2604. doi: 10.1016/j.bpj.2023.05.022. Epub 2023 May 24. Biophys J. 2023. PMID: 37231647 Free PMC article.
-
Thiol-Michael Addition Microparticles: Their Synthesis, Characterization, and Uptake by Macrophages.ACS Biomater Sci Eng. 2023 Jul 10;9(7):4223-4240. doi: 10.1021/acsbiomaterials.3c00441. Epub 2023 Jun 28. ACS Biomater Sci Eng. 2023. PMID: 37379254 Free PMC article.
-
Two-component macrophage model for active phagocytosis with pseudopod formation.Biophys J. 2024 May 7;123(9):1069-1084. doi: 10.1016/j.bpj.2024.03.026. Epub 2024 Mar 25. Biophys J. 2024. PMID: 38532625 Free PMC article.
-
WAVE complex forms linear arrays at negative membrane curvature to instruct lamellipodia formation.J Cell Biol. 2025 Sep 1;224(9):e202410098. doi: 10.1083/jcb.202410098. Epub 2025 Jul 16. J Cell Biol. 2025. PMID: 40668190
References
-
- Cannon G and Swanson J, Journal of Cell Science, 1992, 101, 907–913. - PubMed
-
- Flannagan RS, Jaumouillé V and Grinstein S, Annual Review of Pathology: Mechanisms of Disease, 2012, 7, 61–98. - PubMed
-
- Ellinger I and Pietschmann P, Wiener Medizinische Wochenschrift, 2016, 166, 193–195. - PubMed
-
- Mylvaganam S, Freeman SA and Grinstein S, Current Biology, 2021, 31, R619–R632. - PubMed
MeSH terms
Substances
Grants and funding
LinkOut - more resources
Full Text Sources