. 2022 Jan-Dec;14(1):2149020.
doi: 10.1080/19490976.2022.2149020.

Dysbiotic but nonpathogenic shift in the fecal mycobiota of patients with rheumatoid arthritis

Affiliations

Dysbiotic but nonpathogenic shift in the fecal mycobiota of patients with rheumatoid arthritis

Eun Ha Lee et al. Gut Microbes. 2022 Jan-Dec.

Abstract

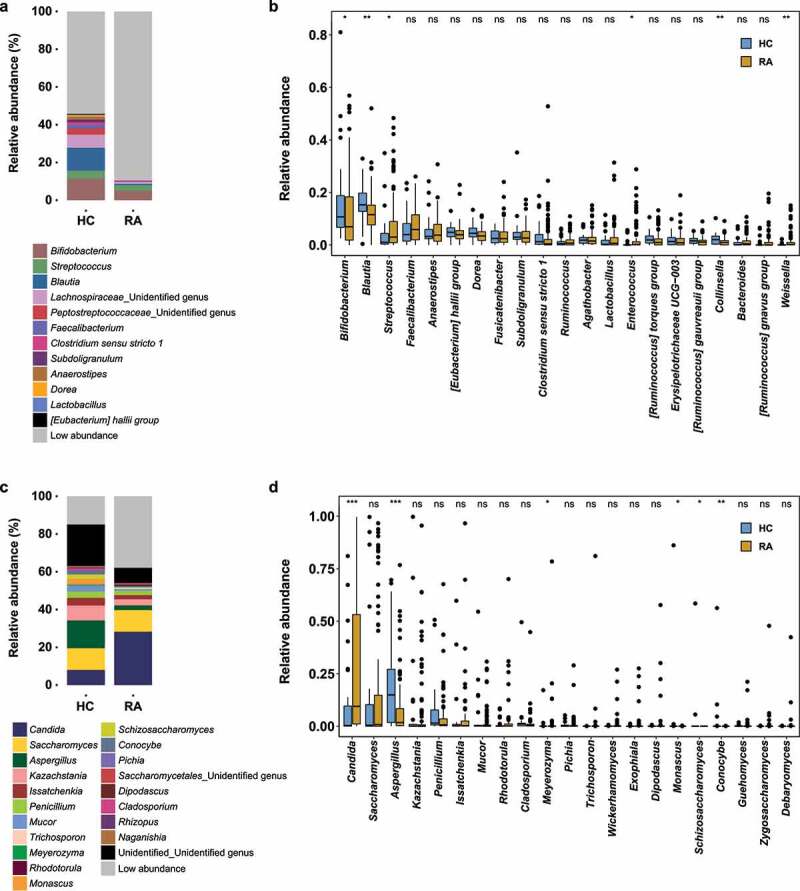
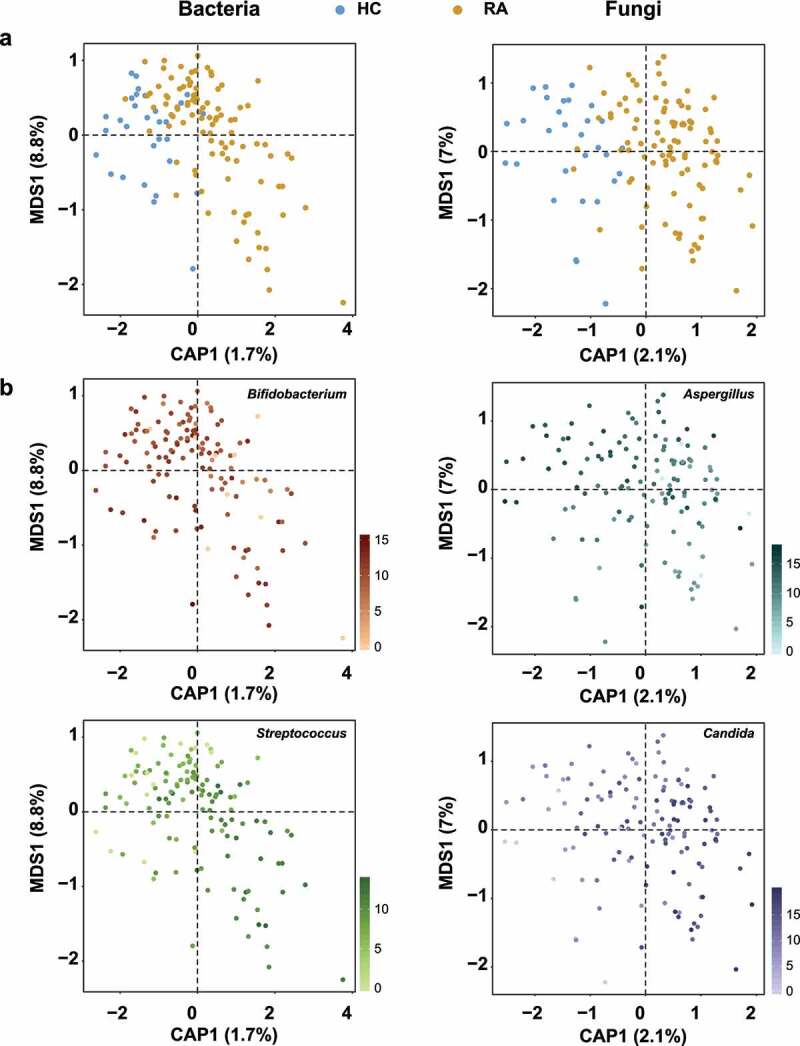
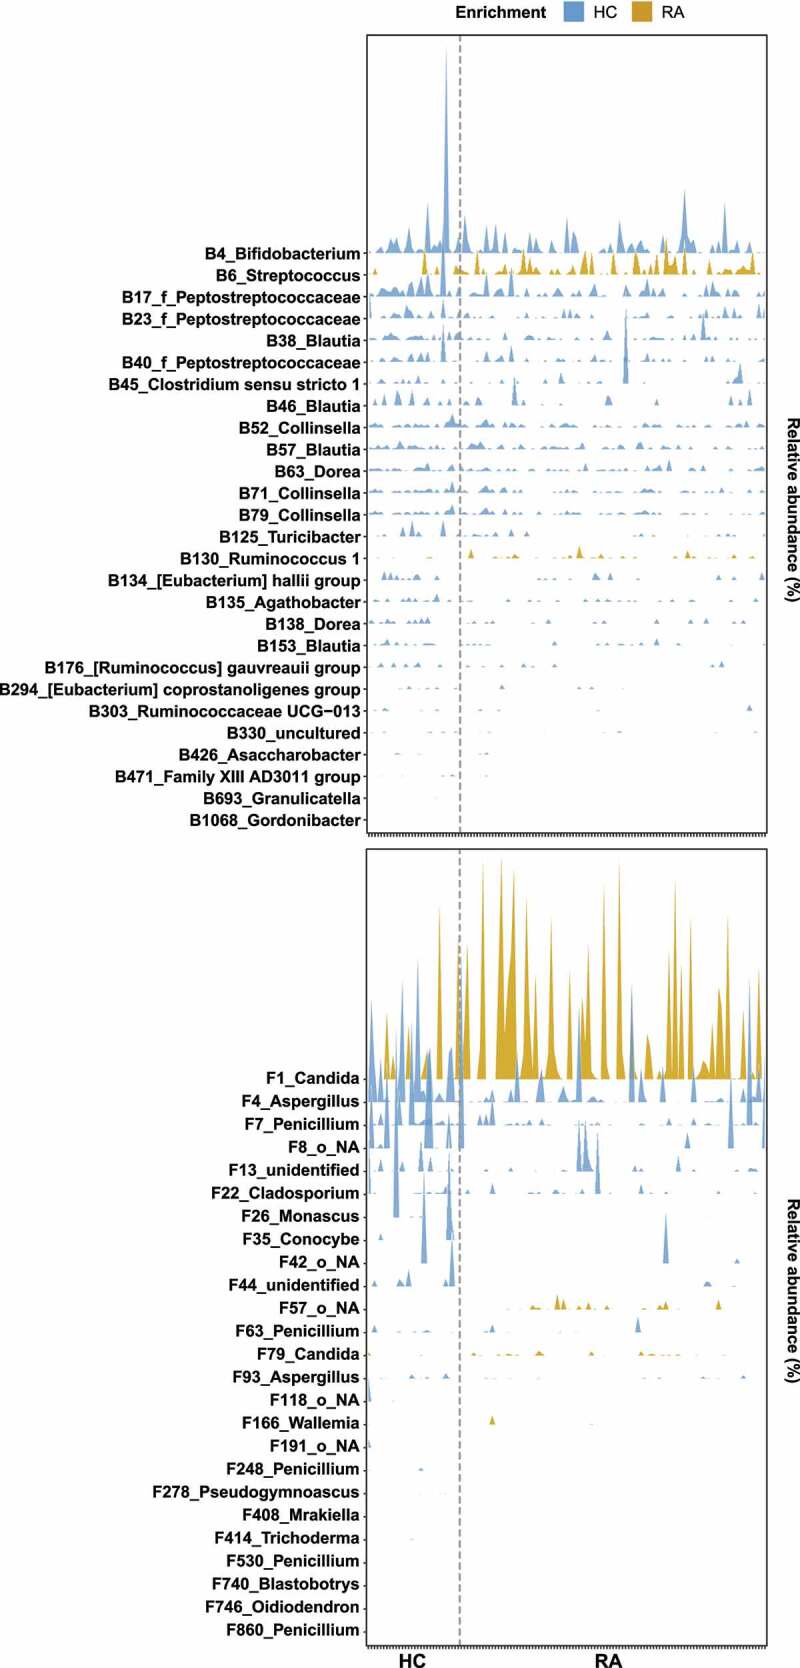
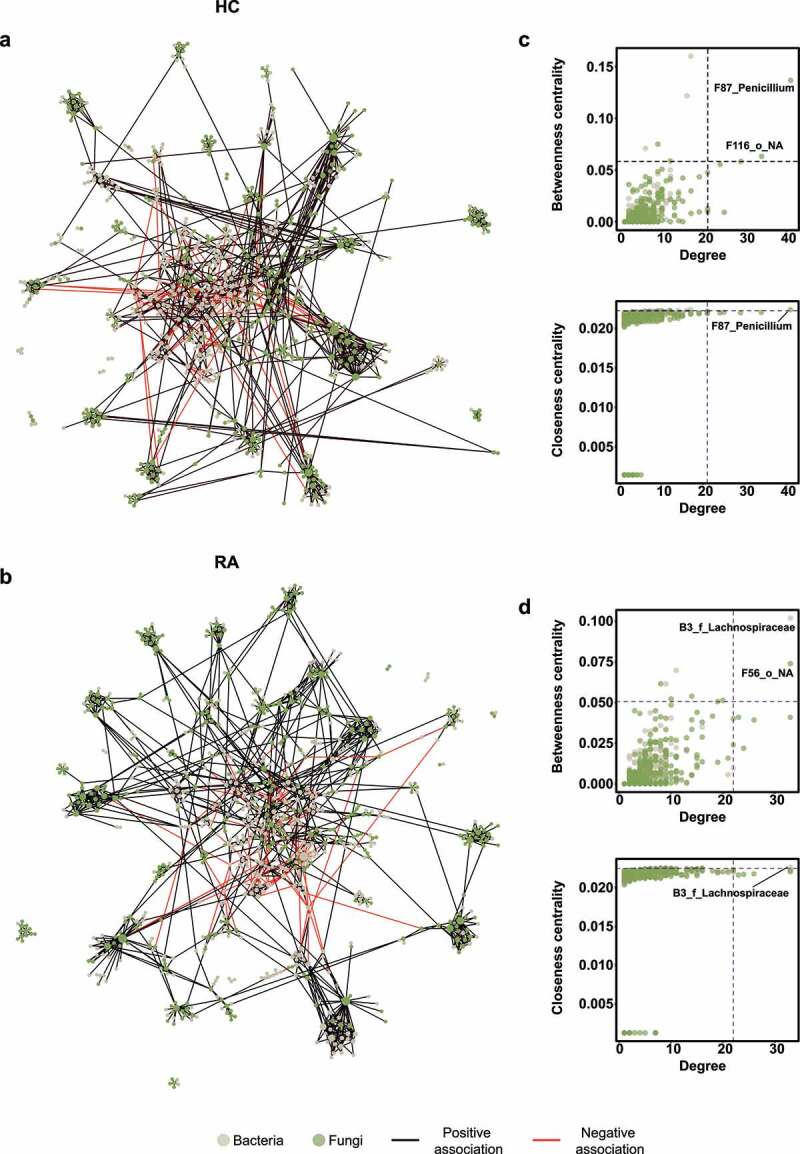
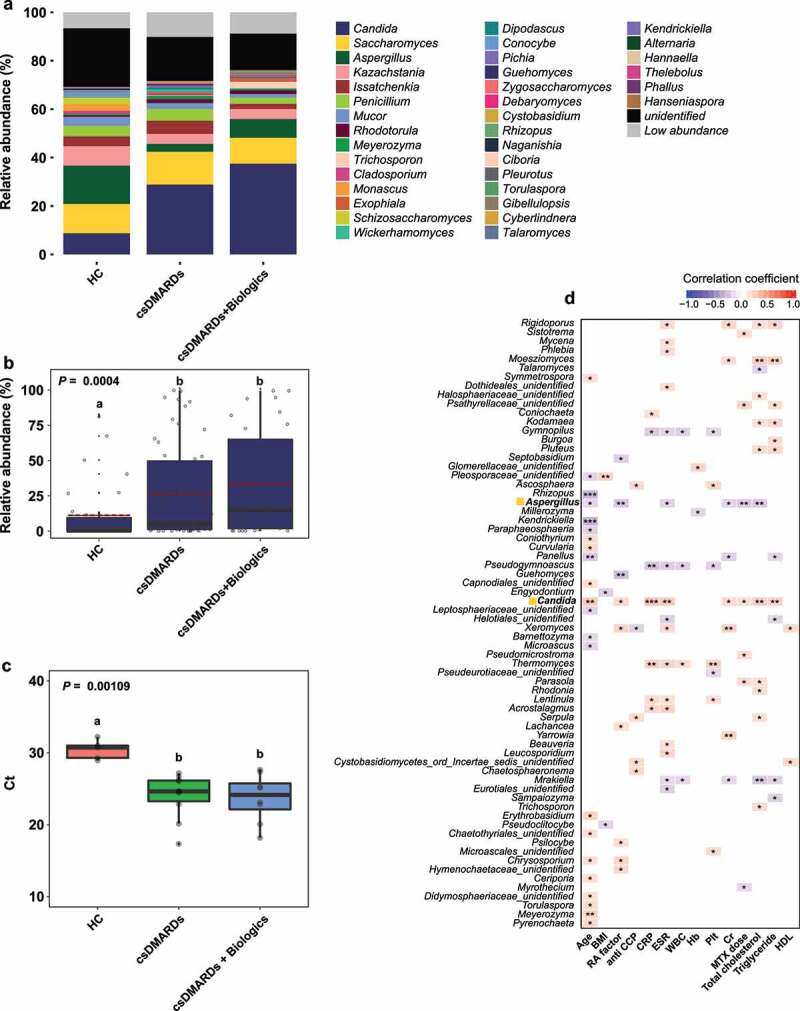
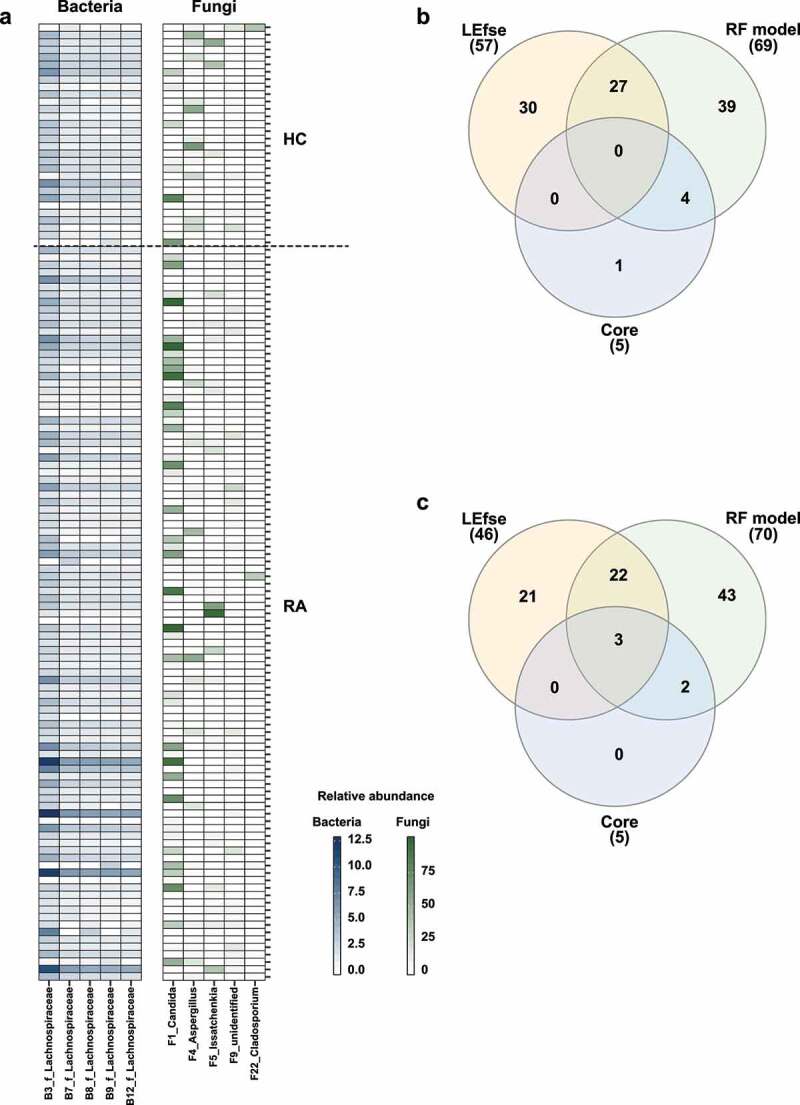
Rheumatoid arthritis (RA) is closely associated with the oral and gut microbiomes. Fungal cell wall components initiate inflammatory arthritis in mouse models. However, little is known regarding the role of the fungal community in the pathogenesis of RA. To evaluate the association between RA and the gut microbiome, investigations of bacterial and fungal communities in patients with RA are necessary. Therefore, we investigated the compositions and associations of fecal bacterial and fungal communities in 30 healthy controls and 99 patients with RA. The relative abundances of Bifidobacterium and Blautia decreased, whereas the relative abundance of Streptococcus increased, in patients with RA. The relative abundance of Candida in the fecal fungal community was higher in patients with RA than in healthy controls, while the relative abundance of Aspergillus was higher in healthy controls than in patients with RA. Candida species-specific gene amplification showed that C. albicans was the most abundant species of Candida. Ordination analysis and random forest classification models supported the findings of structural changes in bacterial and fungal communities. Aspergillus was the core fecal fungal genus in healthy controls, although Saccharomyces spp. are typically predominant in Western cohorts. In addition, bacterial-fungal association analyses showed that the hub node had shifted from fungi to bacteria in patients with RA. The finding of fungal dysbiosis in patients with RA suggests that fungi play critical roles in the fecal microbial communities and pathogenesis of RA.

Keywords: Aspergillus; Candida; Fecal microbiota; dysbiosis; rheumatoid arthritis.


Conflict of interest statement

The authors declare that they have no competing interests.

Figures

Figure 1.
Figure 1.
Fecal microbial community composition in healthy controls and patients with RA. (a) Bacterial community composition at the genus level. (b) Pairwise comparison of abundant bacterial genera. (c) Fungal community composition at the genus level. (d) Pairwise comparison of abundant fungal genera. Taxa with abundance < 0.5% are grouped as “Low abundance.” In panels b and d, boxes and lines represent the interquartile ranges (Q3-Q1) and medians of relative abundances, respectively. Black dots indicate potential outliers. Lower and upper whiskers show minimum and maximum relative abundances of genera. Statistical significance was estimated by two-sided Mann–Whitney U test. ***, P < .001; **, P < .01; *, P < .05; ns, P > .05 (not significant). HC, healthy controls; RA, patients with RA.
Figure 2.
Figure 2.
Ordination analysis of fecal bacterial and fungal communities in healthy controls and patients with RA. Compositional variations among samples were estimated by CAP, based on the Bray–Curtis distance metric. (a) Changes in composition of fecal bacterial and fungal communities. HC samples are shown in blue; RA samples are shown in dark yellow. (b) Ordination analysis according to the relative abundances of abundant genera. Greater intensity denotes higher relative abundance. Left and right sides of panels a and b are bacterial and fungal communities, respectively.
Figure 3.
Figure 3.
Microbial signatures associated with RA. A random forest model was used to identify OTUs that explain the gut bacterial (a) and fungal (b) communities. OTUs are colored based on their classification as “HC-enriched” and “RA-enriched,” based on the results of differential abundance analysis (Figure S5a, S6a). Random forest models were constructed using a 10-fold cross-validation method. OTUs are arranged along the y-axis according to total abundance. Each mark on the x-axis indicates an individual HC or RA sample.
Figure 4.
Figure 4.
Interkingdom co-occurrence networks and hub nodes of fecal microbiota. (a) Interkingdom HC networks. (b) Interkingdom RA networks. In panels a and b, each node corresponds to an out; edges between nodes correspond to positive (black) or negative (red) correlations inferred from OTU abundance profiles using the SparCC method (P < .05, correlation values of < −0.3 or > 0.3). OTUs that belong to different microbial kingdoms are indicated by colors (bacteria, ivory; fungi, green), and node size reflects degree of centrality. (c) Hub nodes of microbial HC networks. (d) Hub nodes of microbial RA networks. In panels c and d, the hub was defined as a node in which degree, betweenness centrality, and closeness centrality were in the top 1%. Dashed lines indicate threshold values of degree, betweenness centrality, and closeness centrality.
Figure 5.
Figure 5.
Effects of medication on Candida abundance. (a) Fecal microbiota composition according to medication. (b) Relative abundance of Candida. Letters indicate statistical significance, as determined by Kruskal–Wallis test followed by Dunn’s test. (c) Results of quantitative PCR analysis of C. albicans. Letters indicate statistical significance, as determined by analysis of variance followed by Tukey’s honestly significant difference test. (d) Correlations between relative abundances of fungal OTUs and quantitative variables. Correlation coefficients were estimated using Spearman’s rank correlation. Asterisks indicate statistical significance (***, P < .001; **, P < .01; *, P < .05). Red and blue boxes indicate positive and negative correlations, respectively.
Figure 6.
Figure 6.
Analysis of core OTUs in fecal microbiota. (a) Core OTUs were identified based on 85% prevalence for bacteria (dark blue) and 70% prevalence for fungi (dark green). Box colors indicate relative abundances of OTUs. Greater color intensity indicates higher relative abundance. Each mark on the y-axis indicates an individual sample. Venn diagrams of the numbers of (b) bacterial and (c) fungal OTUs identified by LEfSe, the random forest model, and core out analysis.

References

    1. Epstein FH, Harris ,ED.. Rheumatoid arthritis: pathophysiology and implications for therapy. New Engl J Med. 1990;322(18):1277–16. doi:10.1056/NEJM199005033221805. - DOI - PubMed
    1. Klareskog L, Catrina AI, Paget S. Rheumatoid arthritis. Lancet. 2009;373:659–672. - PubMed
    1. Smolen JS, Aletaha D, Barton A, Burmester GR, Emery P, Firestein GS, Kavanaugh A, McInnes IB, Solomon DH, Strand V, et al. Rheumatoid arthritis. Nat Rev Dis Primers. 2018;4:18001. - PubMed
    1. Tsuchiya Y, Takayanagi N, Sugiura H, Miyahara Y, Tokunaga D, Kawabata Y, Sugita Y. Lung diseases directly associated with rheumatoid arthritis and their relationship to outcome. Eur Respir J. 2011;37:1411–1417. - PubMed
    1. Solomon DH, Goodson NJ, Katz JN, Weinblatt ME, Avorn J, Setoguchi S, Canning C, Schneeweiss S. Patterns of cardiovascular risk in rheumatoid arthritis. Ann Rheum Dis. 2006;65:1608–1612. - PMC - PubMed

Publication types