. 2023 Feb 6;13(2):298-311.
doi: 10.1158/2159-8290.CD-22-1066.

Efficacy of a Small-Molecule Inhibitor of KrasG12D in Immunocompetent Models of Pancreatic Cancer

Affiliations

Efficacy of a Small-Molecule Inhibitor of KrasG12D in Immunocompetent Models of Pancreatic Cancer

Samantha B Kemp et al. Cancer Discov. .

Abstract

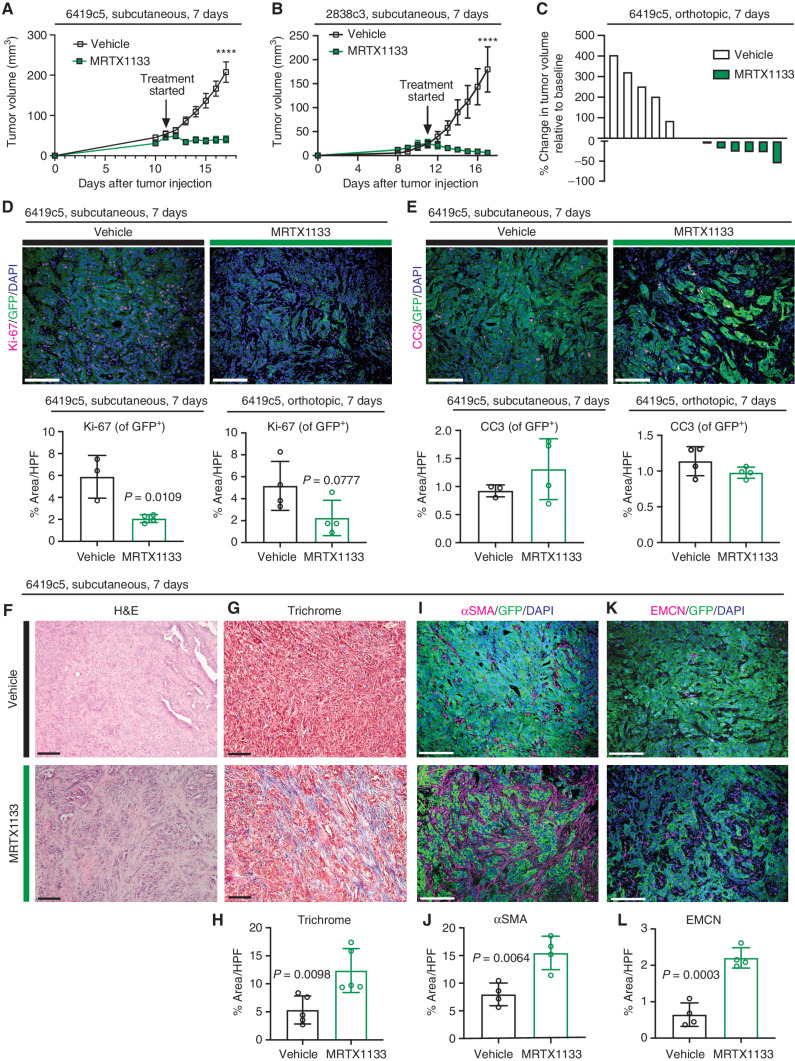
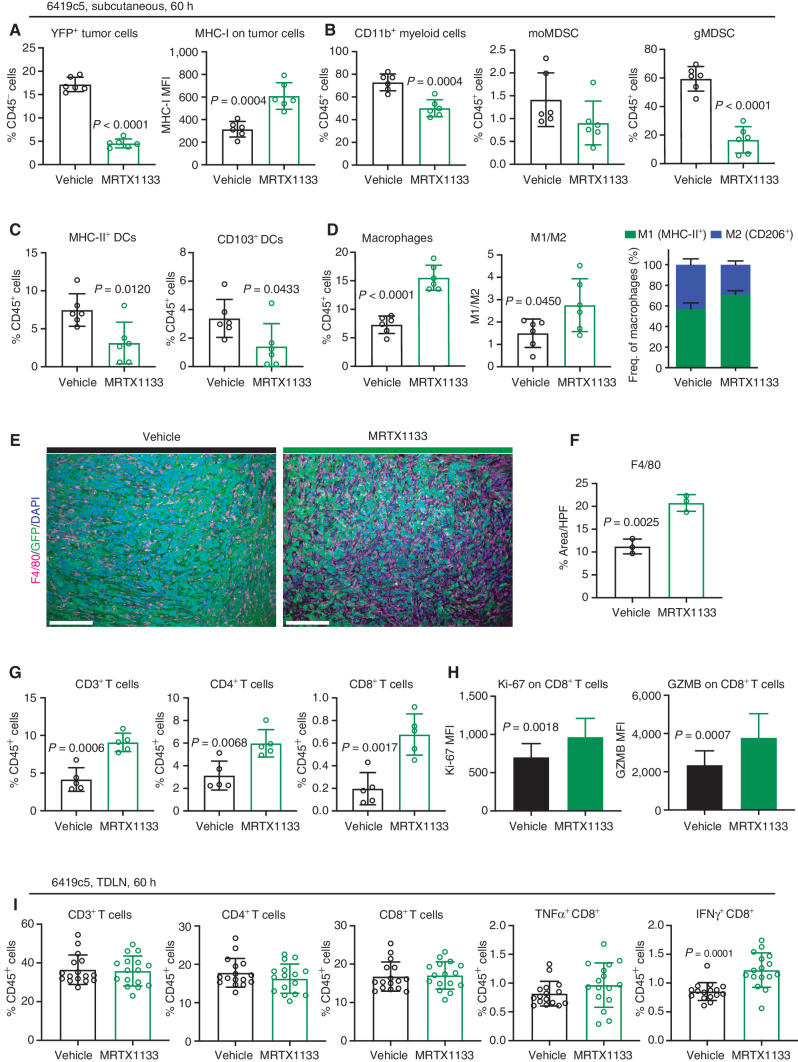
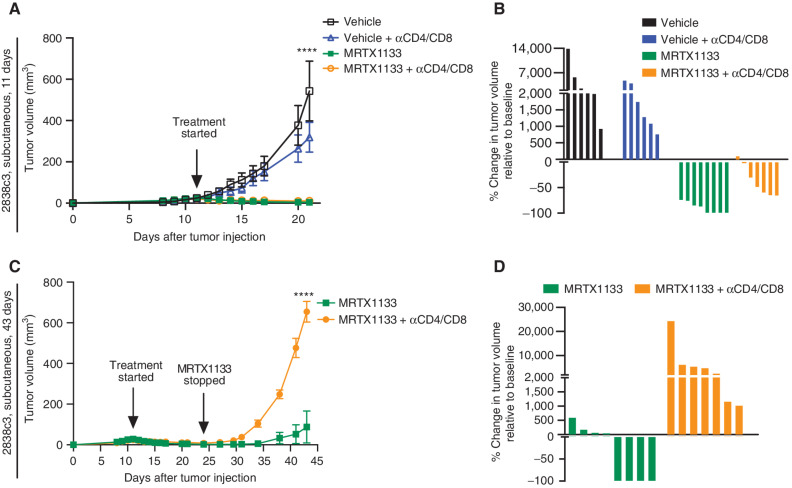
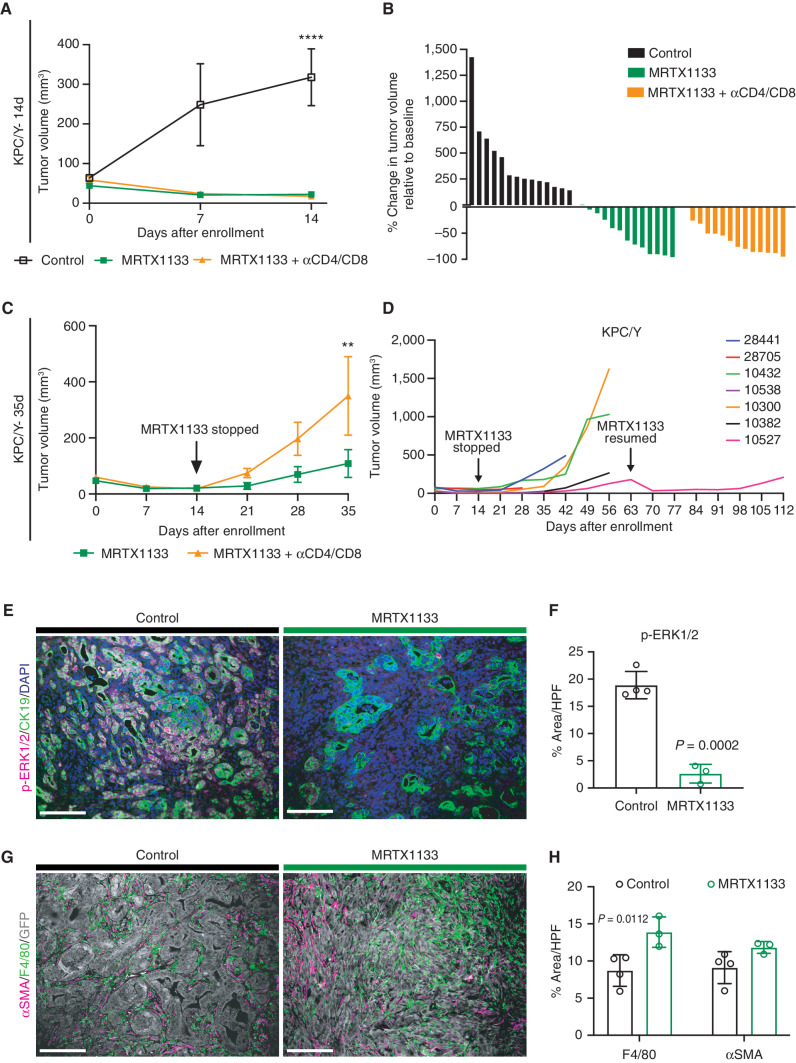
Mutations in the KRAS oncogene are found in more than 90% of patients with pancreatic ductal adenocarcinoma (PDAC), with Gly-to-Asp mutations (KRASG12D) being the most common. Here, we tested the efficacy of a small-molecule KRASG12D inhibitor, MRTX1133, in implantable and autochthonous PDAC models with an intact immune system. In vitro studies validated the specificity and potency of MRTX1133. In vivo, MRTX1133 prompted deep tumor regressions in all models tested, including complete or near-complete remissions after 14 days. Concomitant with tumor cell apoptosis and proliferative arrest, drug treatment led to marked shifts in the tumor microenvironment (TME), including changes in fibroblasts, matrix, and macrophages. T cells were necessary for MRTX1133's full antitumor effect, and T-cell depletion accelerated tumor regrowth after therapy. These results validate the specificity, potency, and efficacy of MRTX1133 in immunocompetent KRASG12D-mutant PDAC models, providing a rationale for clinical testing and a platform for further investigation of combination therapies.

Significance: Pharmacologic inhibition of KRASG12D in pancreatic cancer models with an intact immune system stimulates specific, potent, and durable tumor regressions. In the absence of overt toxicity, these results suggest that this and similar inhibitors should be tested as potential, high-impact novel therapies for patients with PDAC. See related commentary by Redding and Grabocka, p. 260. This article is highlighted in the In This Issue feature, p. 247.


Figures

Figure 1. Pharmacologic inhibition of KRASG12D inhibits tumor growth and elicits changes in the tumor stroma in immunocompetent implantation PDAC models. A, Tumor volume (mm3) of vehicle- and MRTX1133-treated subcutaneous tumors (6419c5). Growth curves show change in tumor volume over 7 days of treatment. n = 10/group. Each symbol represents the average tumor volume. Error bars, SEM. Statistics were determined using a two-way ANOVA with the Sidak multiple comparisons test with significance indicated (****, P < 0.0001). Results are representative of 3 independent experiments. B, Tumor volume (mm3) of vehicle and MRTX1133-treated subcutaneous tumors (2838c3). Growth curves show change in tumor volume over 7 days of treatment. n = 7–8/group. Each symbol represents the average tumor volume. Error bars, SEM. Statistics were determined using a two-way ANOVA with the Sidak multiple comparisons test with significance indicated (****, P < 0.0001). Results are representative of 2 independent experiments. C, Waterfall plot of vehicle- and MRTX1133-treated orthotopic tumors (6419c5) showing a change in tumor volume after 7 days of treatment compared with baseline at day 0. Each bar represents a single tumor. n = 5–6/group. D, Representative coimmunofluorescence images of staining for Ki-67 (proliferation marker), GFP (tumor cell marker), and DAPI (nuclear counterstain) in vehicle- and MRTX1133-treated tumors (top). Quantitation of proliferating tumor cells (Ki-67 of GFP+) as a percent area per high power field (HPF) in vehicle- (n = 3) and MRTX1133-treated tumors (n = 4; bottom). At least 3 fields of view were averaged per tumor. P values were determined by an unpaired Student t test. Scale bars, 100 μm. Objective, 20×. E, Representative coimmunofluorescence images of cleaved caspase-3 (CC3), GFP, and DAPI in vehicle- and MRTX1133-treated tumors (top). Quantitation of apoptotic tumor cells (CC3 of GFP+) as percent area per HPF in vehicle- (n = 3) and MRTX1133-treated tumors (n = 4; bottom). At least 3 fields of view were averaged per tumor. P values were determined by an unpaired Student t test. Scale bars, 100 μm. Objective, 20×. F, Representative images of H&E staining of subcutaneous tumors (6419c5) following 7 days of treatment with vehicle or MRTX1133. Scale bars, 100 μm. Objective, 10×. G, Representative images of Masson's trichrome staining of vehicle- and MRTX1133-treated tumors. Scale bars, 100 μm. Objective, 10×. H, Quantitation of collagen deposition (blue stain) as percent area per HPF in vehicle- (n = 5) and MRTX1133-treated tumors (n = 5). At least 3 fields of view were averaged per tumor. P values were determined by an unpaired Student t test. Error bars, SD. I, Representative coimmunofluorescence images of alpha-smooth muscle actin (αSMA), GFP, and DAPI in vehicle- and MRTX1133-treated tumors. Scale bars, 100 μm. Objective, 20×. J, Quantitation of fibroblasts (αSMA+) as percent area per HPF in vehicle- (n = 4) and MRTX1133-treated tumors (n = 4). At least 3 fields of view were averaged per tumor. P values were determined by Student unpaired t test. Error bars, SD. K, Representative coimmunofluorescent images of endomucin (EMCN), GFP, and DAPI in vehicle- and MRTX1133-treated tumors. Scale bars, 100 μm. Objective, 20×. L, Quantitation of endothelial cells (EMCN+) as percent area per HPF in vehicle- (n = 4) and MRTX1133-treated tumors (n = 4). At least 3 fields of view were averaged per tumor. P values were determined by an unpaired Student t test. Error bars, SD.
Figure 1.
Pharmacologic inhibition of KRASG12D inhibits tumor growth and elicits changes in the tumor stroma in immunocompetent implantation PDAC models. A, Tumor volume (mm3) of vehicle- and MRTX1133-treated subcutaneous tumors (6419c5). Growth curves show change in tumor volume over 7 days of treatment. n = 10/group. Each symbol represents the average tumor volume. Error bars, SEM. Statistics were determined using a two-way ANOVA with the Sidak multiple comparisons test with significance indicated (****, P < 0.0001). Results are representative of 3 independent experiments. B, Tumor volume (mm3) of vehicle and MRTX1133-treated subcutaneous tumors (2838c3). Growth curves show change in tumor volume over 7 days of treatment. n = 7–8/group. Each symbol represents the average tumor volume. Error bars, SEM. Statistics were determined using a two-way ANOVA with the Sidak multiple comparisons test with significance indicated (****, P < 0.0001). Results are representative of 2 independent experiments. C, Waterfall plot of vehicle- and MRTX1133-treated orthotopic tumors (6419c5) showing a change in tumor volume after 7 days of treatment compared with baseline at day 0. Each bar represents a single tumor. n = 5–6/group. D, Representative coimmunofluorescence images of staining for Ki-67 (proliferation marker), GFP (tumor cell marker), and DAPI (nuclear counterstain) in vehicle- and MRTX1133-treated tumors (top). Quantitation of proliferating tumor cells (Ki-67 of GFP+) as a percent area per high-power field (HPF) in vehicle-treated (n = 3) and MRTX1133-treated (n = 4; bottom) tumors. At least 3 fields of view were averaged per tumor. P values were determined by an unpaired Student t test. Scale bars, 100 μm. Objective, 20×. E, Representative coimmunofluorescence images of CC3, GFP, and DAPI in vehicle- and MRTX1133-treated tumors (top). Quantitation of apoptotic tumor cells (CC3 of GFP+) as percent area per HPF in vehicle-treated (n = 3) and MRTX1133-treated (n = 4; bottom) tumors. At least 3 fields of view were averaged per tumor. P values were determined by an unpaired Student t test. Scale bars, 100 μm. Objective, 20×. F, Representative images of H&E staining of subcutaneous tumors (6419c5) following 7 days of treatment with vehicle or MRTX1133. Scale bars, 100 μm. Objective, 10×. G, Representative images of Masson's trichrome staining of vehicle- and MRTX1133-treated tumors. Scale bars, 100 μm. Objective, 10×. H, Quantitation of collagen deposition (blue stain) as percent area per HPF in vehicle-treated (n = 5) and MRTX1133-treated (n = 5) tumors. At least 3 fields of view were averaged per tumor. P values were determined by an unpaired Student t test. Error bars, SD. I, Representative coimmunofluorescence images of αSMA, GFP, and DAPI in vehicle- and MRTX1133-treated tumors. Scale bars, 100 μm. Objective, 20×. J, Quantitation of fibroblasts (αSMA+) as percent area per HPF in vehicle-treated (n = 4) and MRTX1133-treated (n = 4) tumors. At least 3 fields of view were averaged per tumor. P values were determined by Student unpaired t test. Error bars, SD. K, Representative coimmunofluorescent images of EMCN, GFP, and DAPI in vehicle- and MRTX1133-treated tumors. Scale bars, 100 μm. Objective, 20×. L, Quantitation of endothelial cells (EMCN+) as percent area per HPF in vehicle-treated (n = 4) and MRTX1133-treated (n = 4) tumors. At least 3 fields of view were averaged per tumor. P values were determined by an unpaired Student t test. Error bars, SD.
Figure 2. KRASG12D inhibition alters the tumor immune microenvironment. A–D, Flow cytometry of indicated cell subsets from 6419c5 (subcutaneous) tumors after 5 doses over 60 hours of vehicle (n = 6) or MRTX1133 (n = 6). Ratio of M1-like (MHC-II+) to M2-like (CD206+) macrophages in 6419c5 (subcutaneous) tumors after 5 doses of vehicle or MRTX1133 (D, middle). M1/M2 ratio plotted as the frequency of total macrophages (D, right). P values were determined by an unpaired Student t test. Error bars, SD. E, Representative coimmunofluorescent images of F4/80, GFP, and DAPI in vehicle- and MRTX1133-treated tumors (6419c5, subcutaneous, 60 hours). Scale bars, 100 μm. Objective, 20×. F, Quantitation of macrophages (F4/80+) as percent area per HPF in vehicle- (n = 3) and MRTX1133-treated tumors (n = 3). At least 3 fields of view were averaged per tumor. P values were determined by an unpaired Student t test. Error bars, SD. G, Flow cytometry of T-cell subsets from 6419c5 (subcutaneous) tumors after 5 doses over 60 hours of vehicle (n = 5) or MRTX1133 (n = 5). P values were determined by an unpaired Student t test. Error bars, indicate SD. Results are representative of n = 3 independent experiments. H, Flow cytometry of T-cell subsets from 6419c5 (subcutaneous) tumors after 5 doses over 60 hours of vehicle (n = 15) or MRTX1133 (n = 16). Mean fluorescence intensity (MFI) of Ki-67 and GZMB on CD8+ T cells. P values were determined by an unpaired Student t test. Error bars, SD. I, Flow cytometry of T-cell subsets from 6419c5 (subcutaneous) TDLNs after 5 doses over 60 hours of vehicle (n = 16) or MRTX1133 (n = 16). P values were determined by an unpaired Student t test. Error bars, SD.
Figure 2.
KRASG12D inhibition alters the tumor immune microenvironment. A–D, Flow cytometry of indicated cell subsets from 6419c5 (subcutaneous) tumors after 5 doses over 60 hours of vehicle (n = 6) or MRTX1133 (n = 6). Ratio of M1-like (MHC-II+) to M2-like (CD206+) macrophages in 6419c5 (subcutaneous) tumors after 5 doses of vehicle or MRTX1133 (D, middle). M1/M2 ratio plotted as the frequency (freq.) of total macrophages (D, right). P values were determined by an unpaired Student t test. Error bars, SD. MFI, mean fluorescence intensity; moMDSC, monocytic myeloid-derived suppressor cell. E, Representative coimmunofluorescent images of F4/80, GFP, and DAPI in vehicle- and MRTX1133-treated tumors (6419c5, subcutaneous, 60 hours). Scale bars, 100 μm. Objective, 20×. F, Quantitation of macrophages (F4/80+) as percent area per high-power field in vehicle-treated (n = 3) and MRTX1133-treated (n = 3) tumors. At least 3 fields of view were averaged per tumor. P values were determined by an unpaired Student t test. Error bars, SD. G, Flow cytometry of T-cell subsets from 6419c5 (subcutaneous) tumors after 5 doses over 60 hours of vehicle (n = 5) or MRTX1133 (n = 5). P values were determined by an unpaired Student t test. Error bars, indicate SD. Results are representative of 3 independent experiments. H, Flow cytometry of T-cell subsets from 6419c5 (subcutaneous) tumors after 5 doses over 60 hours of vehicle (n = 15) or MRTX1133 (n = 16). MFI of Ki-67 and GZMB on CD8+ T cells. P values were determined by an unpaired Student t test. Error bars, SD. I, Flow cytometry of T-cell subsets from 6419c5 (subcutaneous) TDLNs after 5 doses over 60 hours of vehicle (n = 16) or MRTX1133 (n = 16). P values were determined by an unpaired Student t test. Error bars, SD.
Figure 3. T cells contribute to the antitumor effects of MRTX1133. A, Tumor volumes (mm3) of vehicle-, vehicle +αCD4/CD8-, MRTX1133-, and MRTX1133 +αCD4/CD8-treated tumors (2838c3, subcutaneous). Growth curves show changes in tumor volume over 11 days of treatment. n = 7–8/group. Each symbol represents the average tumor volume. Error bars, SEM. P values were determined using a two-way ANOVA with the Sidak multiple comparisons test with significance indicated (****, P < 0.0001). Results representative of 2 independent experiments. B, Waterfall plot of vehicle-, vehicle +αCD4/CD8-, MRTX1133-, and MRTX1133 +αCD4/CD8-treated tumors showing changes in tumor volume after 11 days of treatment. Each bar represents a single tumor. n = 6–8/group. C, Tumor volumes (mm3) of MRTX1133- and MRTX1133 +αCD4/CD8-treated tumors (2838c3, subcutaneous). Growth curves show changes in tumor volume over 14 days of MRTX1133 treatment and subsequent 43 days of T-cell depletion. n = 7–8/group. Each symbol represents the average tumor volume. Error bars, SEM. Statistics were determined using a two-way ANOVA with the Sidak multiple comparisons test with significance indicated (****, P < 0.0001). Results are representative of 2 independent experiments. D, Waterfall plot of MRTX1133- and MRTX1133 +αCD4/CD8-treated tumors showing changes in tumor volume after the removal of MRTX1133. Each bar represents a single tumor. n = 7–8/group.
Figure 3.
T cells contribute to the antitumor effects of MRTX1133. A, Tumor volumes (mm3) of vehicle-, vehicle + αCD4/CD8–, MRTX1133-, and MRTX1133 + αCD4/CD8–treated tumors (2838c3, subcutaneous). Growth curves show changes in tumor volume over 11 days of treatment. n = 7–8/group. Each symbol represents the average tumor volume. Error bars, SEM. P values were determined using a two-way ANOVA with the Sidak multiple comparisons test with significance indicated (****, P < 0.0001). Results representative of 2 independent experiments. B, Waterfall plot of vehicle-, vehicle + αCD4/CD8–, MRTX1133-, and MRTX1133 + αCD4/CD8–treated tumors showing changes in tumor volume after 11 days of treatment. Each bar represents a single tumor. n = 6–8/group. C, Tumor volumes (mm3) of MRTX1133- and MRTX1133 + αCD4/CD8–treated tumors (2838c3, subcutaneous). Growth curves show changes in tumor volume over 14 days of MRTX1133 treatment and subsequent 43 days of T-cell depletion. n = 7–8/group. Each symbol represents the average tumor volume. Error bars, SEM. Statistics were determined using a two-way ANOVA with the Sidak multiple comparisons test with significance indicated (****, P < 0.0001). Results are representative of 2 independent experiments. D, Waterfall plot of MRTX1133- and MRTX1133 + αCD4/CD8–treated tumors showing changes in tumor volume after the removal of MRTX1133. Each bar represents a single tumor. n = 7–8/group.
Figure 4. KRASG12D inhibition promotes tumor regressions in the autochthonous KPC/Y model. A, Tumor volumes (mm3) of KPC/Y tumors treated with vehicle control, MRTX1133, or MRTX1133 +αCD4/CD8. Growth curves show changes in tumor volume over 14 days of MRTX1133 treatment. n = 13–14/group. Each symbol represents the average tumor volume. Error bars, SEM. Statistics were determined using a two-way ANOVA with the Sidak multiple comparisons test with significance indicated (****, P < 0.0001). B, Waterfall plot of KPC/Y tumors in A treated with vehicle, MRTX1133, or MRTX1133 +αCD4/CD8 showing changes in tumor volume after 14 days of treatment. Each bar represents a single tumor. n = 13–14/group. C, Tumor volumes (mm3) of MRTX1133 and MRTX1133 +αCD4/CD8-treated KPC/Y tumors. Growth curves show changes in tumor volume over 14 days of MRTX1133 treatment and an additional 3 weeks of αCD4/CD8 in the T-cell depletion cohort. n = 6–8/group. Each symbol represents average tumor volume. Error bars, SEM. Statistics were determined using a two-way ANOVA with the Sidak multiple comparisons test with significance indicated (**, P < 0.01). D, Tumor volumes (mm3) of KPC/Y tumors (n = 7) treated with MRTX1133. Growth curves show changes in tumor volume over 14 days of MRTX1133 treatment and an additional 6 weeks off therapy. One mouse (10527) resumed MRTX1133 treatment at 63 days after enrollment and continued treatment for an additional 7 weeks. Each line represents a single tumor. E, Representative coimmunofluorescence images of p-ERK1/2, CK19, and DAPI in vehicle- and MRTX1133-treated KPC/Y tumors. Scale bars, 100 μm. Objective, 20×. F, Quantitation of p-ERK1/2 staining as percent area per HPF in control (n = 4) and MRTX1133-treated (n = 3) KPC/Y tumors. At least 3 fields of view were averaged per tumor. P values were determined by an unpaired Student t test. Error bars, indicate SD. G, Representative coimmunofluorescence images of αSMA, F4/80, and GFP in control- and MRTX1133-treated KPC/Y tumors. Scale bars, 100 μm. Objective, 20×. H, Quantitation of macrophages (F4/80+) and fibroblasts (αSMA+) as percent area per HPF in control- (n = 4) and MRTX1133-treated (n = 3) KPC/Y tumors. At least 3 fields of view were averaged per tumor. P values were determined using a two-way ANOVA with the Sidak multiple comparisons test. Error bars, SD.
Figure 4.
KRASG12D inhibition promotes tumor regressions in the autochthonous KPC/Y model. A, Tumor volumes (mm3) of KPC/Y tumors treated with vehicle control, MRTX1133, or MRTX1133 + αCD4/CD8. Growth curves show changes in tumor volume over 14 days of MRTX1133 treatment. n = 13–14/group. Each symbol represents the average tumor volume. Error bars, SEM. Statistics were determined using a two-way ANOVA with the Sidak multiple comparisons test with significance indicated (****, P < 0.0001). B, Waterfall plot of KPC/Y tumors in A treated with vehicle, MRTX1133, or MRTX1133 + αCD4/CD8 showing changes in tumor volume after 14 days of treatment. Each bar represents a single tumor. n = 13–14/group. C, Tumor volumes (mm3) of MRTX1133 and MRTX1133 + αCD4/CD8-treated KPC/Y tumors. Growth curves show changes in tumor volume over 14 days of MRTX1133 treatment and an additional 3 weeks of αCD4/CD8 in the T-cell depletion cohort. n = 6–8/group. Each symbol represents average tumor volume. Error bars, SEM. Statistics were determined using a two-way ANOVA with the Sidak multiple comparisons test with significance indicated (**, P < 0.01). D, Tumor volumes (mm3) of KPC/Y tumors (n = 7) treated with MRTX1133. Growth curves show changes in tumor volume over 14 days of MRTX1133 treatment and an additional 6 weeks off therapy. One mouse (10527) resumed MRTX1133 treatment at 63 days after enrollment and continued treatment for an additional 7 weeks. Each line represents a single tumor. E, Representative coimmunofluorescence images of p-ERK1/2, CK19, and DAPI in vehicle- and MRTX1133-treated KPC/Y tumors. Scale bars, 100 μm. Objective, 20×. F, Quantitation of p-ERK1/2 staining as percent area per high-power field (HPF) in control-treated (n = 4) and MRTX1133-treated (n = 3) KPC/Y tumors. At least 3 fields of view were averaged per tumor. P values were determined by an unpaired Student t test. Error bars, SD. G, Representative coimmunofluorescence images of αSMA, F4/80, and GFP in control- and MRTX1133-treated KPC/Y tumors. Scale bars, 100 μm. Objective, 20×. H, Quantitation of macrophages (F4/80+) and fibroblasts (αSMA+) as percent area per HPF in control-treated (n = 4) and MRTX1133-treated (n = 3) KPC/Y tumors. At least 3 fields of view were averaged per tumor. P values were determined using a two-way ANOVA with the Sidak multiple comparisons test. Error bars, SD.

Comment in

References

    1. Siegel RL, Miller KD, Fuchs HE, Jemal A. Cancer statistics, 2022. CA Cancer J Clin 2022;72:7–33. - PubMed
    1. Brahmer JR, Tykodi SS, Chow LQ, Hwu WJ, Topalian SL, Hwu P, et al. . Safety and activity of anti-PD-L1 antibody in patients with advanced cancer. N Engl J Med 2012;366:2455–65. - PMC - PubMed
    1. Royal RE, Levy C, Turner K, Mathur A, Hughes M, Kammula US, et al. . Phase 2 trial of single agent ipilimumab (anti-CTLA-4) for locally advanced or metastatic pancreatic adenocarcinoma. J Immunother 2010;33:828–33. - PMC - PubMed
    1. Conroy T, Desseigne F, Ychou M, Bouche O, Guimbaud R, Becouarn Y, et al. . FOLFIRINOX versus gemcitabine for metastatic pancreatic cancer. N Engl J Med 2011;364:1817–25. - PubMed
    1. Conroy T, Hammel P, Hebbar M, Ben Abdelghani M, Wei AC, Raoul JL, et al. . FOLFIRINOX or gemcitabine as adjuvant therapy for pancreatic cancer. N Engl J Med 2018;379:2395–406. - PubMed

Publication types

MeSH terms

Substances