. 2023 Jan 24;8(2):e157837.
doi: 10.1172/jci.insight.157837.

Spatial transcriptomic characterization of COVID-19 pneumonitis identifies immune circuits related to tissue injury

Affiliations

Spatial transcriptomic characterization of COVID-19 pneumonitis identifies immune circuits related to tissue injury

Amy R Cross et al. JCI Insight. .

Abstract

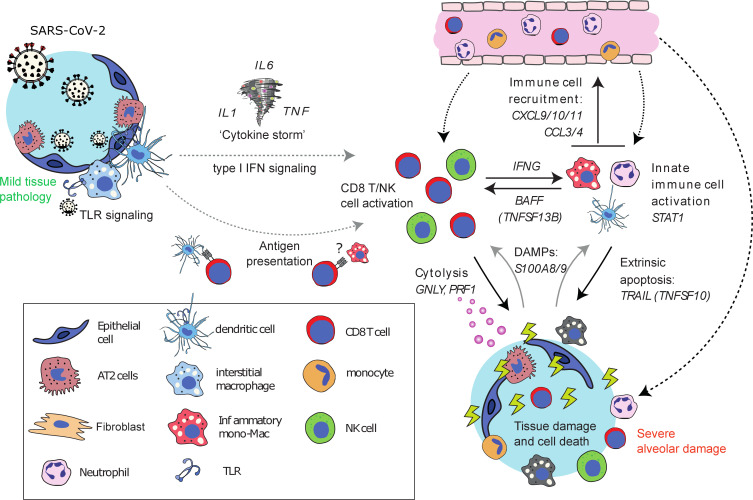
Severe lung damage resulting from COVID-19 involves complex interactions between diverse populations of immune and stromal cells. In this study, we used a spatial transcriptomics approach to delineate the cells, pathways, and genes present across the spectrum of histopathological damage in COVID-19-affected lung tissue. We applied correlation network-based approaches to deconvolve gene expression data from 46 areas of interest covering more than 62,000 cells within well-preserved lung samples from 3 patients. Despite substantial interpatient heterogeneity, we discovered evidence for a common immune-cell signaling circuit in areas of severe tissue that involves crosstalk between cytotoxic lymphocytes and pro-inflammatory macrophages. Expression of IFNG by cytotoxic lymphocytes was associated with induction of chemokines, including CXCL9, CXCL10, and CXCL11, which are known to promote the recruitment of CXCR3+ immune cells. The TNF superfamily members BAFF (TNFSF13B) and TRAIL (TNFSF10) were consistently upregulated in the areas with severe tissue damage. We used published spatial and single-cell SARS-CoV-2 data sets to validate our findings in the lung tissue from additional cohorts of patients with COVID-19. The resulting model of severe COVID-19 immune-mediated tissue pathology may inform future therapeutic strategies.

Keywords: COVID-19; Cellular immune response; Chemokines; Inflammation; Molecular pathology.


Figures

Figure 1
Figure 1. A spectrum of DAD and inflammation was observed within and across COVID-19 lung biopsy specimens.
Selection and annotation of areas of DAD in COVID-19 lung tissues for transcriptomic analysis. (A) Merged immunofluorescence (IF) images of the lung samples from patients A, B, and C (scale bars: 5 mm; panCK, green; DNA, blue; CD3, red; CD68, yellow). AOIs (n = 47) selected for transcript profiling are highlighted (mild to moderate, blue circles; severe pathology, magenta circles), of which 46 passed quality control after sequencing. Labeled areas correspond to higher magnification examples in B. (B) Representative IF images of AOIs demonstrating the morphology and immune infiltrate observed within areas of severe and mild to moderate DAD. AOIs spanned, on average, 0.2 mm2 (range, 0.05–0.33 mm2) with exclusion of empty space. (C) The proportions of CD3+ and CD68+ cells of total nucleated cells were derived from the immunofluorescence imaging, plotted for each AOI and colored by histological severity (mild to moderate, blue; severe, magenta) or inclusion of bronchiolar epithelium (grey). AOIs are annotated by patient: patient A, circle; patient B, triangle, patient C, square.
Figure 2
Figure 2. Severe alveolar damage was associated with the upregulation of immune transcripts.
(A) Differential gene expression between areas of severe and mild to moderate damage. Colored and annotated genes have a fold-change expression greater than 1.5 and a BH adjusted P < 0.05 calculated by testing with linear mixed models for repeated measures to compare severity while accounting for repeated sampling of each tissue (mild vs. severe, n = 16 and 28, respectively). (B) Selected GO BPs significantly overrepresented in genes differentially expressed between mild and severe areas of damage (BH corrected P < 0.05, 1-sided Fisher’s exact test). Also see Supplemental Table 3 for differentially expressed genes and all overrepresented pathways.
Figure 3
Figure 3. Identification and characterization of gene modules with spatially heterogenous expression in COVID-19 lung tissue.
Application of WGCNA to spatial transcriptomic data (n = 46) identified 17 modules of coexpressed genes (see also Supplemental Figure 3). (A) Correlation between estimated cell-type abundance (as determined by cell deconvolution; see Supplemental Table 6) and WGCNA module eigengene expression (all AOIs; positive Spearman’s correlation values are shown). (B) Selected GO BP, KEGG, and reactome pathways significantly overrepresented in the detected modules (BH adjusted P < 0.05; 1-side Fisher’s exact tests; see also Supplemental Table 5). (C) WGCNA module eigengene expression is shown for each AOI (see also Supplemental Table 4). Sampled AOIs are annotated with patient identity, the severity of damage, adjacent virus antigen presence, and the percentage of CD3+ and CD68+ cells of total nucleated cells. No severity grade was given to 2 AOIs sampling bronchiolar epithelium. Hierarchical clustering of the 46 AOIs by expression of the WGCNA module eigengenes identified 5 spatial groups with distinct patterns of module expression. (D) The severity of tissue damage was correlated to module eigengene expression separately for the AOIs from each patient (Pearson’s correlation). vRNA, viral RNA.
Figure 4
Figure 4. Within-patient analysis of spatially associated cellular phenotypes.
(AC) The cellular phenotype network analysis diagrams show the correlations (Spearman’s P < 0.05) among the WGCNA module eigengene expression values, predicted cell-type abundances, and secreted cytokine expression for the 3 patients (see Methods for node inclusion criteria). (D) The expression of selected genes in each of the 3 patients for mild (blue) and severe (red) areas of alveolar damage (median, IQR, and outliers are >1.5 times the IQR from the hinge). Asterisks indicate BH adjusted P < 0.05 and fold-change >1.5 in differential expression analysis with linear mixed models for repeated measures between mild and severe areas of damage (mild vs. severe, n = 16 and 28, respectively).
Figure 5
Figure 5. IFN-γ production by cytotoxic lymphocytes is associated with severe tissue damage in COVID-19.
(A) Analysis of the expression of genes of interest in a published BALF-sample, single-cell data set comprising 4 healthy donors and 6 patients with severe COVID-19 (18). (B) Spearman’s correlations between cytokine expression in T and NK and myeloid nuclei pseudobulks constructed from a published single-nuclei atlas of the lung tissue of SARS-CoV-2–infected autopsy donors with COVID-19 (n = 13) (7). mDC, myeloid dendritic cell; pDC, plasmacytoid dendritic cell; snRNA-seq, single-nucleus RNA sequencing.
Figure 6
Figure 6. Proposed cellular model of severe tissue damage in COVID-19.

References

    1. Speranza E, et al. Single-cell RNA sequencing reveals SARS-CoV-2 infection dynamics in lungs of African green monkeys. Sci Transl Med. 2021;13(578):eabe8146. doi: 10.1126/scitranslmed.abe8146. - DOI - PMC - PubMed
    1. Wichmann D, et al. Autopsy findings and venous thromboembolism in patients with COVID-19: a prospective cohort study. Ann Intern Med. 2020;173(4):268–277. doi: 10.7326/M20-2003. - DOI - PMC - PubMed
    1. Grasselli G, et al. Pathophysiology of COVID-19-associated acute respiratory distress syndrome: a multicentre prospective observational study. Lancet Respir Med. 2020;8(12):1201–1208. doi: 10.1016/S2213-2600(20)30370-2. - DOI - PMC - PubMed
    1. Short KR, et al. Pathogenesis of influenza-induced acute respiratory distress syndrome. Lancet Infect Dis. 2014;14(1):57–69. doi: 10.1016/S1473-3099(13)70286-X. - DOI - PubMed
    1. Desai N, et al. Temporal and spatial heterogeneity of host response to SARS-CoV-2 pulmonary infection. Nat Commun. 2020;11(1):6319. doi: 10.1038/s41467-020-20139-7. - DOI - PMC - PubMed