

cGMP dynamics that underlies thermosensation in temperature-sensing neuron regulates thermotaxis behavior in C. elegans
- PMID: 36472979
- PMCID: PMC9725164
- DOI: 10.1371/journal.pone.0278343
cGMP dynamics that underlies thermosensation in temperature-sensing neuron regulates thermotaxis behavior in C. elegans
Erratum in
-
Correction: cGMP dynamics that underlies thermosensation in temperature-sensing neuron regulates thermotaxis behavior in C. elegans.PLoS One. 2024 May 31;19(5):e0305045. doi: 10.1371/journal.pone.0305045. eCollection 2024. PLoS One. 2024. PMID: 38820473 Free PMC article.
Abstract
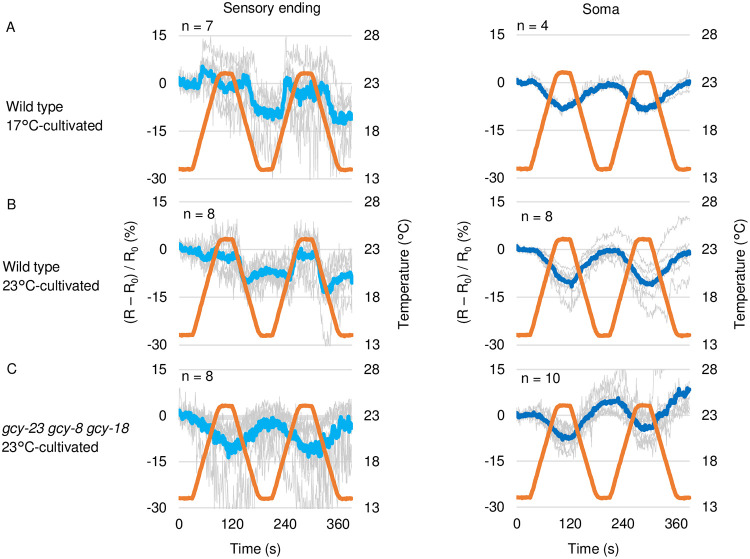
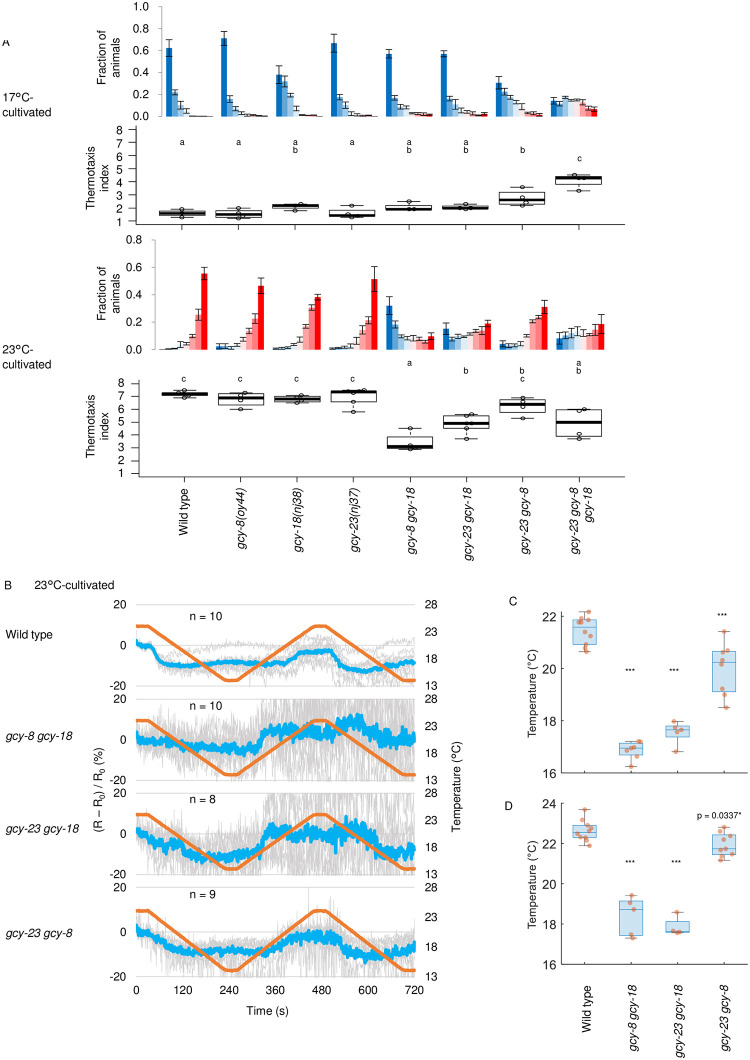
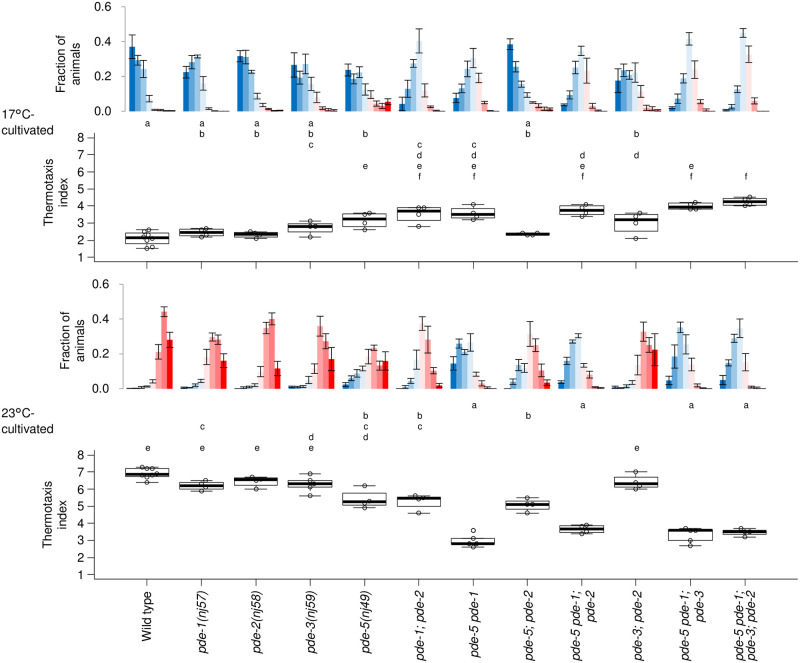
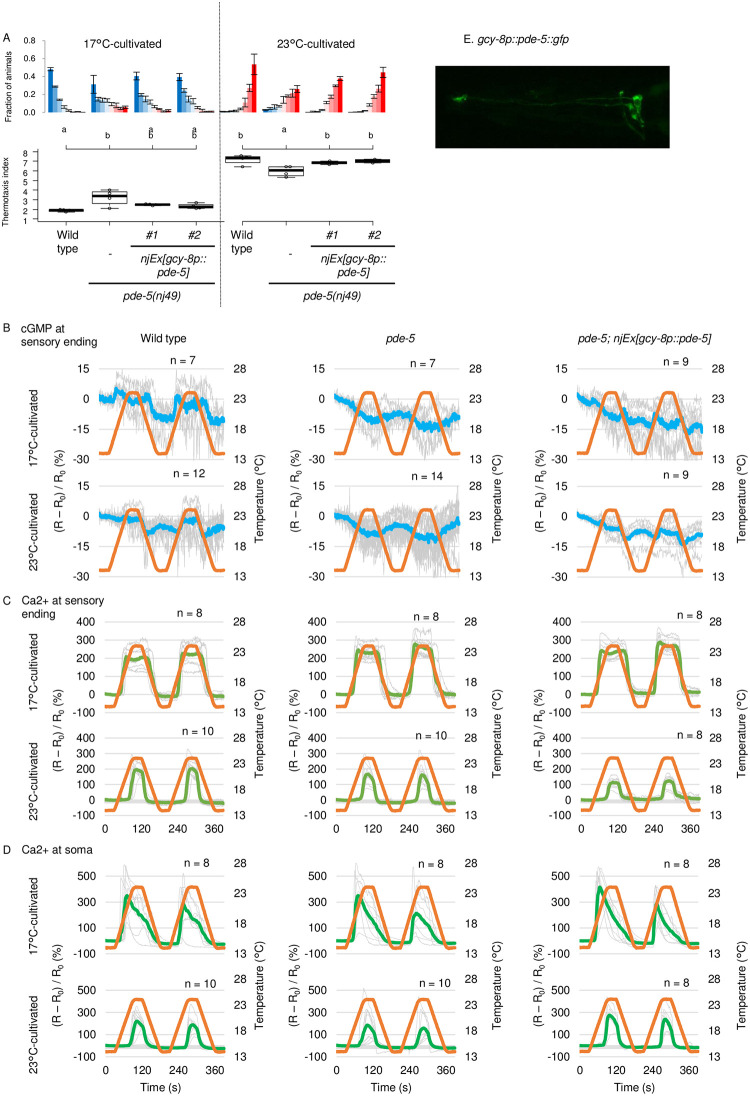
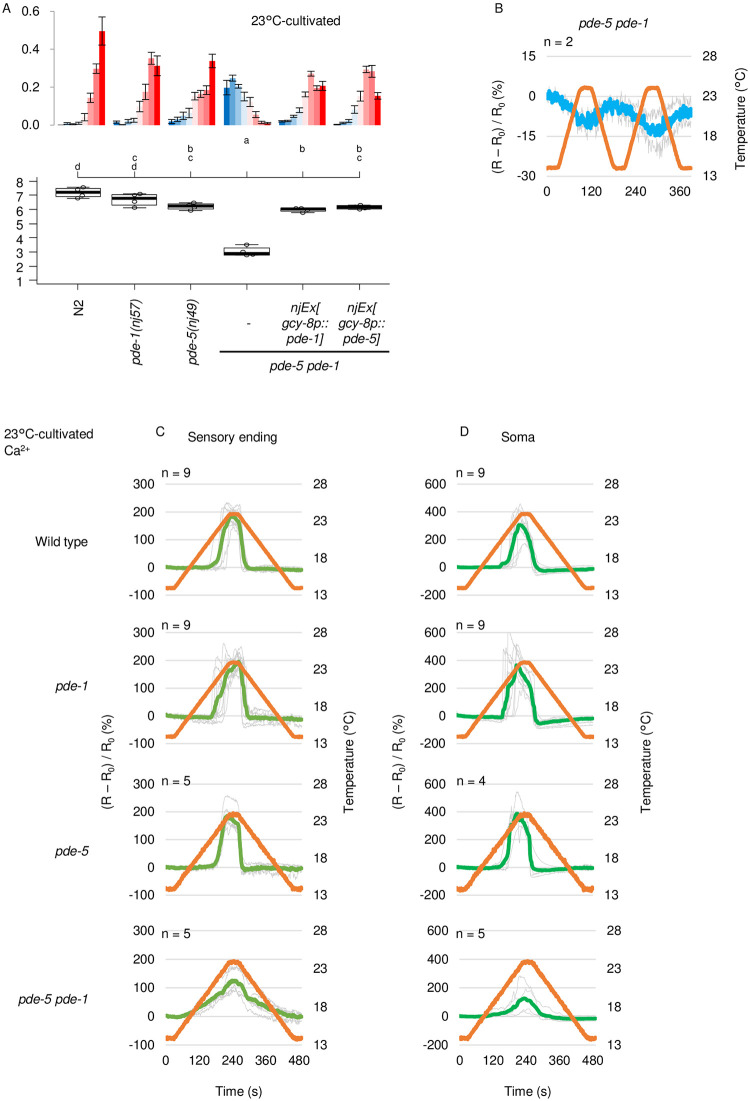
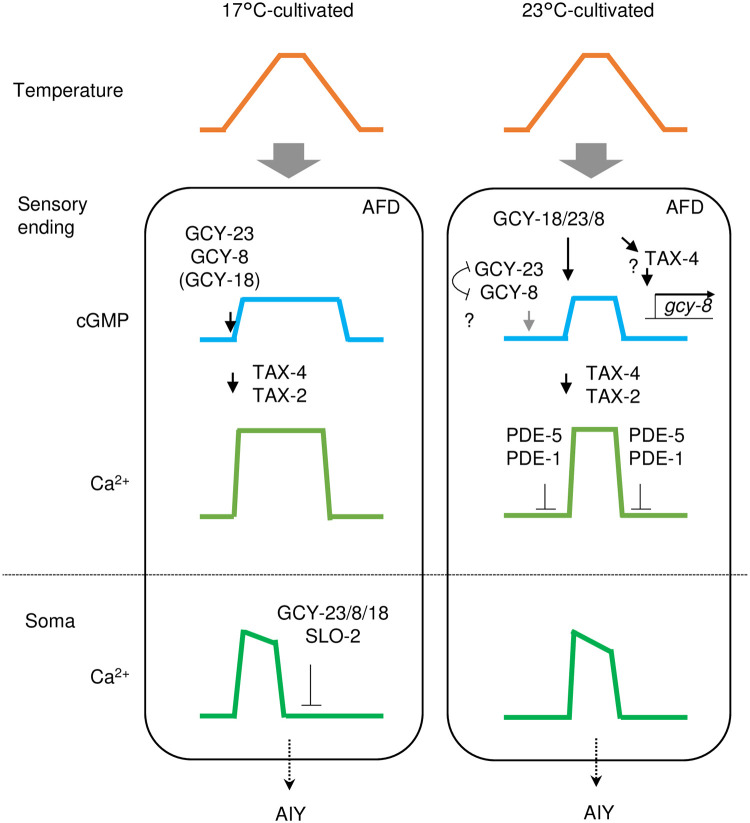
Living organisms including bacteria, plants and animals sense ambient temperature so that they can avoid noxious temperature or adapt to new environmental temperature. A nematode C. elegans can sense innocuous temperature, and navigate themselves towards memorize past cultivation temperature (Tc) of their preference. For this thermotaxis, AFD thermosensory neuron is pivotal, which stereotypically responds to warming by increasing intracellular Ca2+ level in a manner dependent on the remembered past Tc. We aimed to reveal how AFD encodes the information of temperature into neural activities. cGMP synthesis in AFD is crucial for thermosensation in AFD and thermotaxis behavior. Here we characterized the dynamic change of cGMP level in AFD by imaging animals expressing a fluorescence resonance energy transfer (FRET)-based cGMP probe specifically in AFD and found that cGMP dynamically responded to both warming and cooling in a manner dependent on past Tc. Moreover, we characterized mutant animals that lack guanylyl cyclases (GCYs) or phosphodiesterases (PDEs), which synthesize and hydrolyze cGMP, respectively, and uncovered how GCYs and PDEs contribute to cGMP and Ca2+ dynamics in AFD and to thermotaxis behavior.
Copyright: © 2022 Aok et al. This is an open access article distributed under the terms of the Creative Commons Attribution License, which permits unrestricted use, distribution, and reproduction in any medium, provided the original author and source are credited.
Conflict of interest statement
The authors have declared that no competing interests exist.
Figures
Similar articles
-
The C. elegans thermosensory neuron AFD responds to warming.Curr Biol. 2004 Jul 27;14(14):1291-5. doi: 10.1016/j.cub.2004.06.060. Curr Biol. 2004. PMID: 15268861
-
Identification of guanylyl cyclases that function in thermosensory neurons of Caenorhabditis elegans.Genetics. 2006 Apr;172(4):2239-52. doi: 10.1534/genetics.105.050013. Epub 2006 Jan 16. Genetics. 2006. PMID: 16415369 Free PMC article.
-
Genetic screens identified dual roles of microtubule-associated serine threonine kinase and CREB within a single thermosensory neuron in the regulation of Caenorhabditis elegans thermotaxis behavior.G3 (Bethesda). 2022 Nov 4;12(11):jkac248. doi: 10.1093/g3journal/jkac248. G3 (Bethesda). 2022. PMID: 36102820 Free PMC article.
-
Environmental-temperature and internal-state dependent thermotaxis plasticity of nematodes.Curr Opin Neurobiol. 2022 Jun;74:102541. doi: 10.1016/j.conb.2022.102541. Epub 2022 Apr 18. Curr Opin Neurobiol. 2022. PMID: 35447377 Review.
-
The extraordinary AFD thermosensor of C. elegans.Pflugers Arch. 2018 May;470(5):839-849. doi: 10.1007/s00424-017-2089-5. Epub 2017 Dec 8. Pflugers Arch. 2018. PMID: 29218454 Free PMC article. Review.
Cited by
-
Roles of Cyclic Nucleotide Phosphodiesterases in Signal Transduction Pathways in the Nematode Caenorhabditis elegans.Cells. 2025 Jul 30;14(15):1174. doi: 10.3390/cells14151174. Cells. 2025. PMID: 40801606 Free PMC article. Review.
-
Feedforward and feedback mechanisms cooperatively regulate rapid experience-dependent response adaptation in a single thermosensory neuron type.bioRxiv [Preprint]. 2023 Dec 6:2023.12.05.570166. doi: 10.1101/2023.12.05.570166. bioRxiv. 2023. Update in: Proc Natl Acad Sci U S A. 2024 Apr 2;121(14):e2321430121. doi: 10.1073/pnas.2321430121. PMID: 38168209 Free PMC article. Updated. Preprint.
-
Analyses of Neural Circuits Governing Behavioral Plasticity in the Nematode Caenorhabditis elegans.Methods Mol Biol. 2024;2794:321-330. doi: 10.1007/978-1-0716-3810-1_27. Methods Mol Biol. 2024. PMID: 38630241
-
AFD Thermosensory Neurons Mediate Tactile-Dependent Locomotion Modulation in C. elegans.bioRxiv [Preprint]. 2025 Feb 24:2025.02.19.639001. doi: 10.1101/2025.02.19.639001. bioRxiv. 2025. PMID: 40060420 Free PMC article. Preprint.
-
Correction: cGMP dynamics that underlies thermosensation in temperature-sensing neuron regulates thermotaxis behavior in C. elegans.PLoS One. 2024 May 31;19(5):e0305045. doi: 10.1371/journal.pone.0305045. eCollection 2024. PLoS One. 2024. PMID: 38820473 Free PMC article.
References
Publication types
MeSH terms
Grants and funding
LinkOut - more resources
Full Text Sources
Miscellaneous
