. 2022 Dec 6;15(763):eabn2743.
doi: 10.1126/scisignal.abn2743. Epub 2022 Dec 6.

Cross-talk between TSC2 and the extracellular matrix controls pulmonary vascular proliferation and pulmonary hypertension

Affiliations

Cross-talk between TSC2 and the extracellular matrix controls pulmonary vascular proliferation and pulmonary hypertension

Yuanjun Shen et al. Sci Signal. .

Abstract

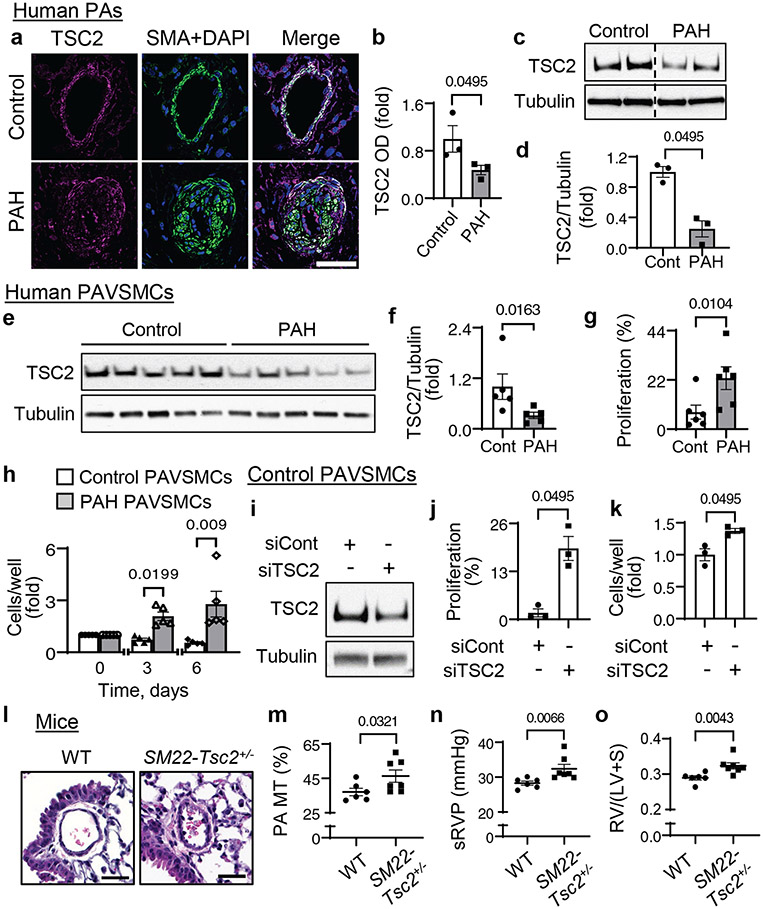
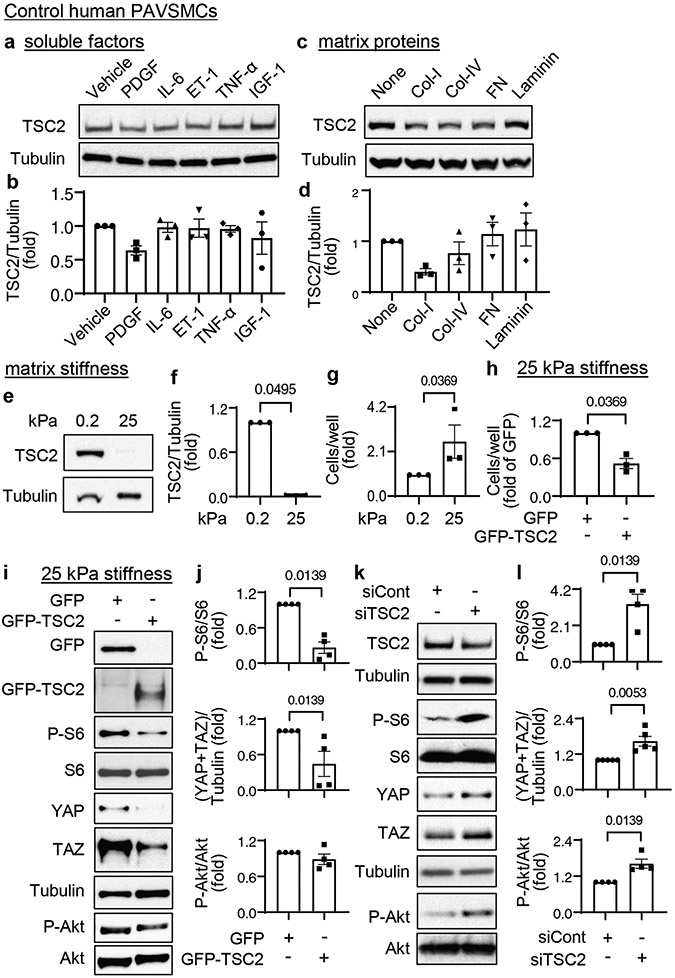
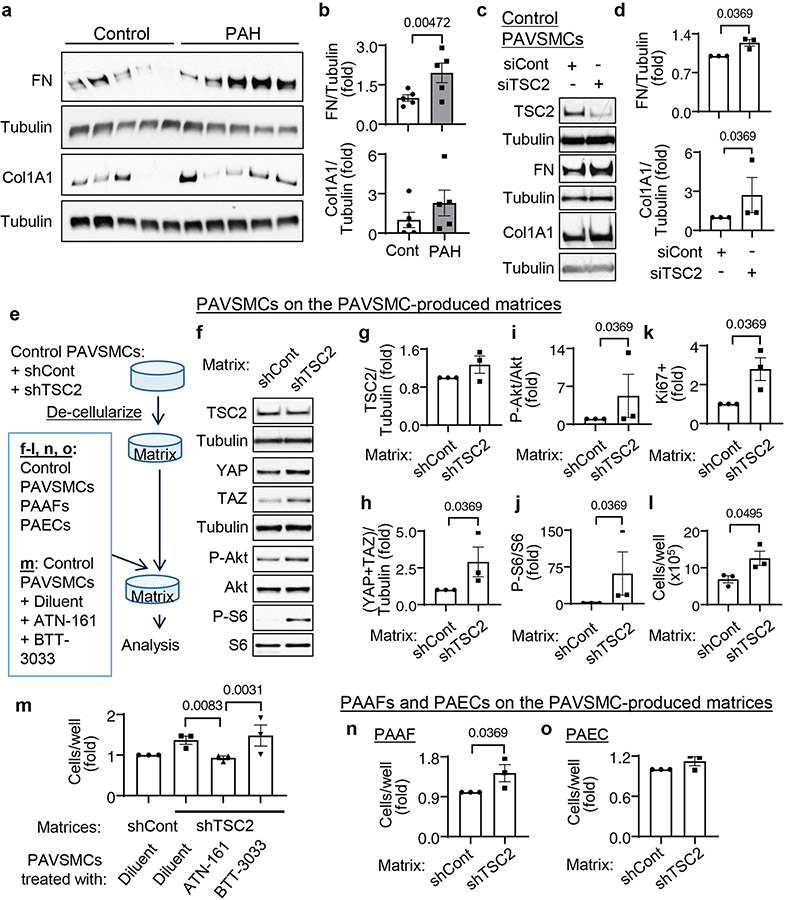
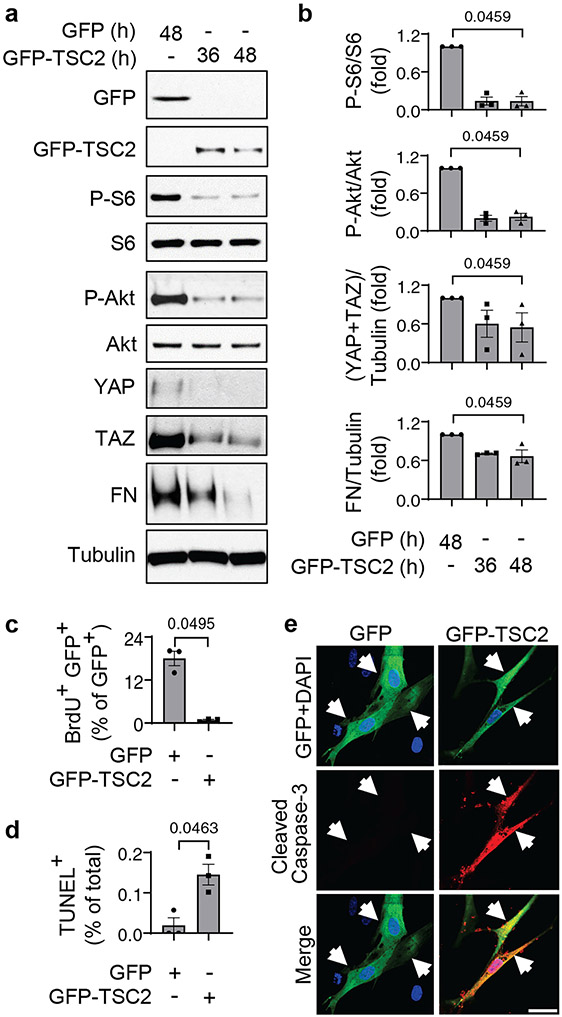
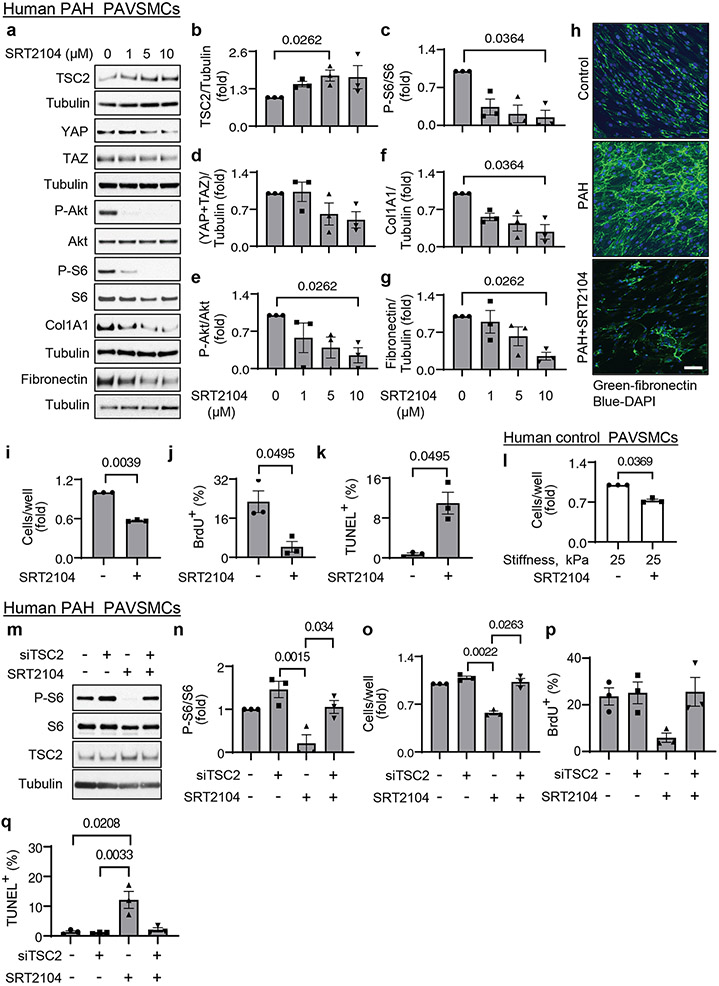
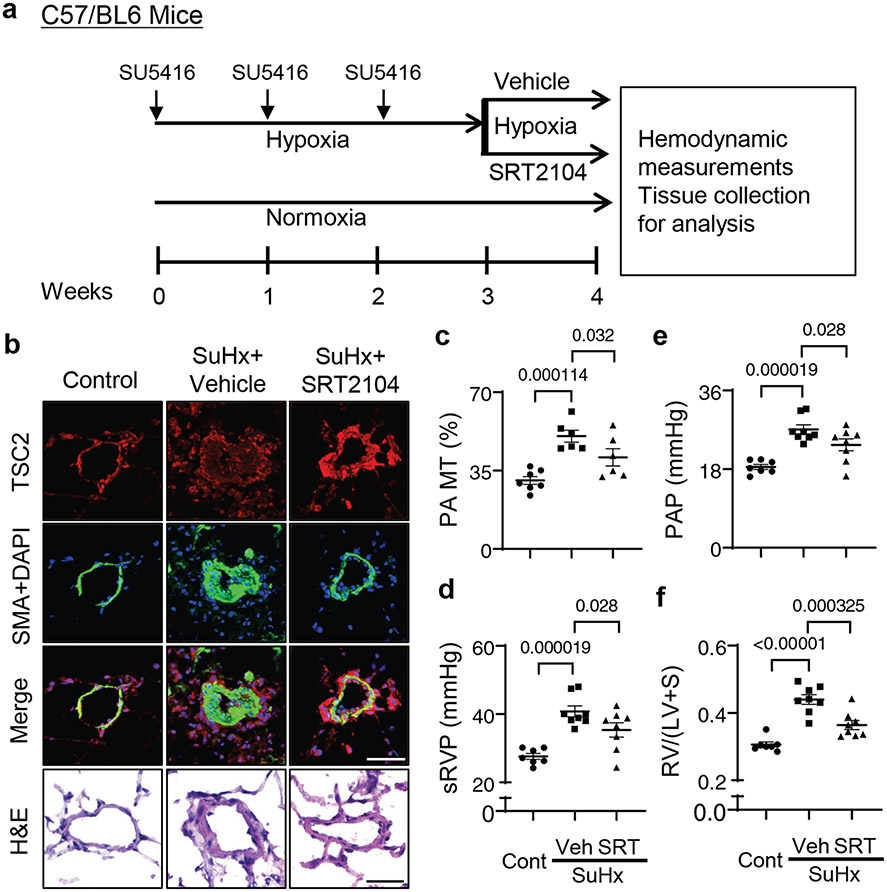
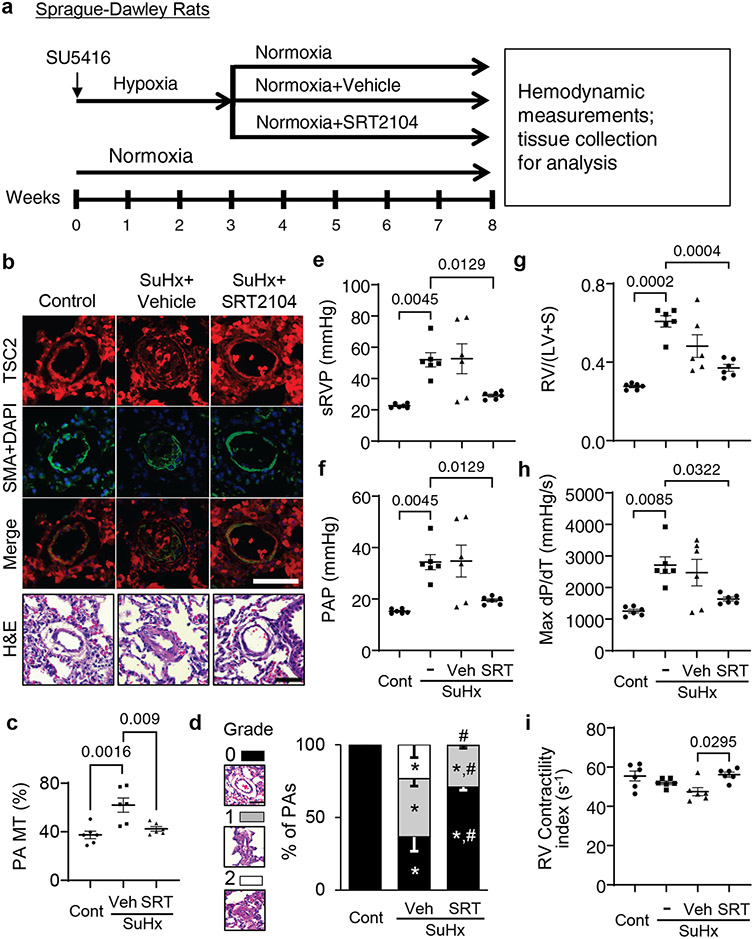
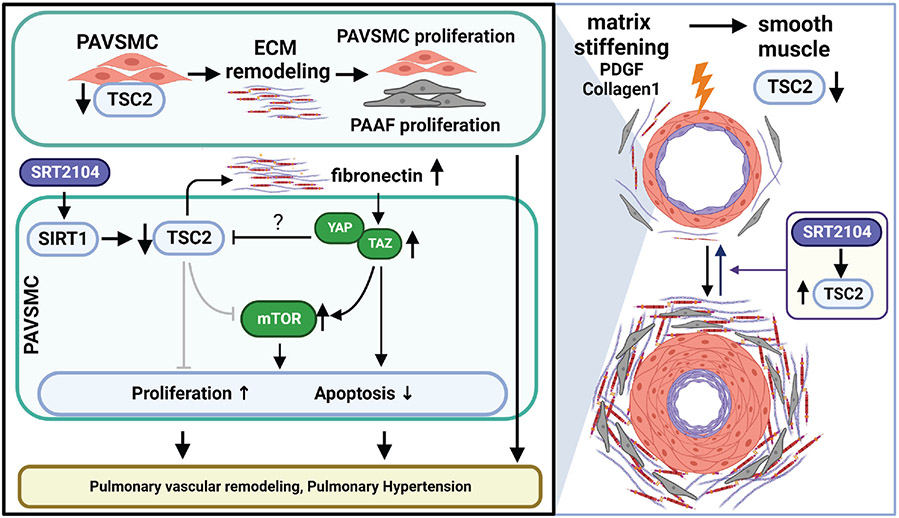
Increased proliferation and survival of cells in small pulmonary arteries (PAs) drive pulmonary arterial hypertension (PAH). Because cell growth mediated by the mTOR-containing mTORC1 complex is inhibited by tuberous sclerosis complex 2 (TSC2), we investigated the role of this GTPase-activating protein in PAH pathology. TSC2 abundance was decreased in remodeled small PAs and PA vascular smooth muscle cells (PAVSMCs) from patients with PAH or from rodent pulmonary hypertension (PH) models, as well as PAVSMCs maintained on substrates that reproduced pathology-induced stiffness. Accordingly, mice with smooth muscle-specific reduction in TSC2 developed PH. At the molecular level, decreased TSC2 abundance led to stiffness-induced PAVSMC proliferation, increased abundance of the mechanosensitive transcriptional coactivators YAP/TAZ, and enhanced mTOR kinase activity. Moreover, extracellular matrix (ECM) produced by TSC2-deficient PAVSMCs stimulated the proliferation of nondiseased PA adventitial fibroblasts and PAVSMCs through fibronectin and its receptor, the α5β1 integrin. Reconstituting TSC2 in PAVSMCs from patients with PAH through overexpression or treatment with the SIRT1 activator SRT2104 decreased YAP/TAZ abundance, mTOR activity, and ECM production, as well as inhibited proliferation and induced apoptosis. In two rodent models of PH, SRT2104 treatment restored TSC2 abundance, attenuated pulmonary vascular remodeling, and ameliorated PH. Thus, TSC2 in PAVSMCs integrates ECM composition and stiffness with pro-proliferative and survival signaling, and restoring TSC2 abundance could be an attractive therapeutic option to treat PH.


Figures

Figure 1.
Figure 1.. TSC2 deficiency results in increased PAVSMC proliferation, vascular remodeling and PH
a, b. (a) Immunohistochemical analysis of human lung tissue sections to detect TSC2 (magenta), SMA (green) and DAPI (blue). Bar, 100 μm. Images are representative from 3 subjects/group, 6 PAs/subject. (b) Optical density (OD) measurement of TSC2 fluorescent signal in SMA-positive regions of human small PAs. Data are means±SE from 3 subjects/group, 6 PAs/subject, 12 areas/PA. PAH was normalized to control, which was set at 1. P value for PAH compared to control was determined by Mann Whitney U test. Images from different parts of the same gel are separated by dotted line. c, d. Immunoblot analysis of small PAs. Data are means±SE from n=3 subjects/group. P value for PAH compared to control was determined by Mann Whitney U test. e, f. Immunoblot analysis of human non-diseased (control) (white bars) and PAH (grey bars) PAVSMCs. Data are means±SE. PAH was normalized to control which was set to 1. N=5 subjects/group. P value for PAH compared to control was determined by Mann Whitney U test. g. Proliferation of human control and PAH PAVSMCs as measured by Ki67 staining. Data represent % of Ki67-positive cells per total number of cells (as detected by DAPI) and are means±SE from n=6 subjects/group. P value for PAH compared to control was determined by Mann Whitney U test. h. Equal quantity of cells was plated on each well of 6-well plate (day 0), cell counts were performed at days 3 and 6. Data are fold change to day 0. Data are means±SE from n=5 subjects/group. P values for PAH compared to control were determined by Mann Whitney U test. i-k. Immunoblot (i), proliferation as measured by BrdU incorporation (j) or cell counting (k) performed on control human PAVSMCs transfected with siRNA directed against TSC2 (siTSC2) or control siRNA GLO (siCont) for 48 hours. Data are means±SE from n=3 subjects/group. P values for siTSC2 compared to siCont were determined by Mann Whitney U test. l-o. Morphological and hemodynamic analysis of nine week old male SM22-Tsc2+/− and wild-type (WT) mice. Images (l) are representative of 6 mice/group, 12 PAs/mouse. Scale bar, 30 μm. Graphs should PA medial thickness (PA MT) (m), systolic RV pressure (sRVP) (n), and Fulton index (right ventricle (RV)/(left ventricle (LV) + septum) (o). Data are means±SE for n=6 WT mice and n=7 SM22-Tsc2+/− mice. P values for SM22-Tsc2+/− compared to WT by Mann Whitney U test.
Figure 2.
Figure 2.. Decreased TSC2 content is induced by increased substrate stiffness and is required for YAP/TAZ accumulation, activation of Akt and mTOR, and increased PAVSMC proliferation.
a-d. Immunoblot analysis of control human PAVSMCs treated with the indicated soluble factors (a, b) or maintained on the indicated matrices (c,d) for 48 hours. Data are means±SE from n=3 subjects/group. Values were normalized to vehicle treatment or uncoated matrix, which were set at 1. P values were determined by Kruskal-Wallis test with Dunn’s pairwise comparison. e, f. Immunoblot analysis of control human PAVSMCs maintained on softwell hydrogels with normal (0.2 kPa) or pathological (25 kPa) stiffness for 48 hours. Data are means±SE from n=3 subjects/group. 25 kPa was normalized to 0.2 kPa, which was set at 1. P value for 25 kPa compared to 0.2 kPa was determined by Mann Whitney U test. g. Equal numbers of control human PAVSMCs were plated on hydrogels with 0.2 kPa or 25 kPa stiffness, and cell proliferation analysis was performed on day 4. Data are means±SE from n=3 subjects/group. 25 kPa was normalized to 0.2 kPa, which was set at 1. P value for 25 kPa compared to 0.2 kPa was determined by Mann Whitney U test. h-j. Human control PAVSMCs were plated on softwell hydrogels with 25 kPa stiffness and transfected with mammalian vectors expressing GFP or GFP-tagged human TSC2 for 36 hours. Cell proliferation (h) and immunoblot analyses (i-j) were performed. Data are means±SE from n=3 (cell counts) and 4 (immunoblots) subjects/group. GFP-TSC2 was normalized to GFP, which was set at 1. P values for GFP-TSC2 compared to GFP were determined by Mann Whitney U test. k, l. Human control PAVSMCs were transfected with siRNA directed against TSC2 (siTSC2) or control siRNA GLO (siCont) for 48 hours and were immunoblotted for the indicated proteins. Data are means±SE from n=4 or 5 subjects/group. siTSC2 was normalized to siCont, which was set at 1. P values for siTSC2 compared to siCont were determined by Mann Whitney U test.
Figure 3.
Figure 3.. Reduced TSC2 abundance in PAVSMCs promotes YAP/TAZ accumulation, mTOR activity, and proliferation of non-diseased pulmonary vascular cells through ECM remodeling
a, b. Human control and PAH PAVSMCs (from 5 subjects/group) were immunoblotted for fibronectin (FN) and collagen 1A1 (Col1A1). Data are means±SE. PAH was normalized to Cont, which was set at 1. P values for PAH compared to Cont were determined by Mann Whitney U test. c, d. Human control PAVSMCs were transfected with siRNA directed against TSC2 (siTSC2) or control siRNA GLO (siCont) and immunoblotted for FN and Col1A1. Data are means±SE from n=3 subjects/group. siTSC2 was normalized to siCont, which was set at 1. P values for siTSC2 compared to siCont were determined by Mann Whitney U test. e-o. Pre-confluent control PAVSMCs were infected with adenoviruses encoding control shRNA (shCont) or shRNA directed against TSC2 (shTSC2) for six days (e). Cells were removed and an equal amount of non-diseased (control) untreated PAVSMCs (f-l), PAVSMCs treated with diluent, 10μM ATN161 (α5β1 integrin inhibitor), or 10μM BTT3033 (α2β1 integrin inhibitor) (m), control PAAFs (n), or control PAECs (o) were plated on the matrices. Four days after plating, immunoblot (f-j) and proliferation analyses as measured by Ki67 staining (k) or cell counting (l-o) were performed. Data are means±SE from n=3 subjects/group. P values for siTSC2 compared to siCont were determined by Mann Whitney U test (significance) (g-l, n, o) and by Kruskal-Wallis test with Dunn’s pairwise comparison (m).
Figure 4.
Figure 4.. TSC2 reconstitution reduces YAP/TAZ accumulation and fibronectin production, suppresses proliferation, and induces apoptosis in human PAH PAVSMCs
a, b. Human PAH PAVSMCs were transfected with GFP or GFP-TSC2 for the indicated times and immunoblotted to detect the indicated proteins. Data are means±SE from 3 subjects/group. P values for GFP-TSC2 compared to GFP were determined by Kruskal-Wallis rank test with Dunn’s pairwise comparison. c-e. Proliferation (as measured BrdU incorporation) (c), apoptosis (as measured by TUNEL staining) (d), and immunocytochemical analysis to detect cleaved caspase 3 (red), GFP (green), and DAPI (blue) (e). Data are means±SE from 3 subjects/group. A minimum of 12 transfected cells/subject and condition were analyzed. P values for GFP-TSC2 compared to GFP were determined by Mann Whitney U test. Scale bar, 50 μm. White arrows indicate transfected cells.
Figure 5.
Figure 5.. SRT2104 restores functional TSC2, inhibits proliferation, and induces apoptosis in human PAH PAVSMCs
a-g. Human PAH PAVSMCs were treated with diluent (0) or the indicated concentrations of SRT2104 and immunoblotted for the indicated proteins. Data are means±SE from three experiments, each performed on the cells from a different subject. P values for SRT2104 treatment compared to diluent (0) were determined by Kruskal-Wallis rank test with Dunn’s pairwise comparison. h. Immunocytochemical analysis to detect fibronectin produced by human non-diseased (control) and PAH PAVSMCs treated with diluent or 10 μM SRT2104 for 48 hr. Scale bar, 100 μm. i-k. Human PAH PAVSMCs were treated with diluent (−) or 10 μM SRT2104 (+) for 48 hr. Proliferation assessed by cell counts (i) or BrdU incorporation (j) and apoptosis as determined by TUNEL staining (k) analyses were performed. Data are means±SE from three experiments, each performed on the cells from different subject. P values for SRT2104 treatment compared to diluent (0) were determined by Mann Whitney U test. l. Equal numbers of human control PAVSMCs were seeded on hydrogels with 25 kPa stiffness, treated with diluent (−) or 10 μM SRT2104 (+) for 48hr, and counted. Data are means±SE from three experiments, each performed on the cells from a different subject. P value for SRT2104 treatment compared to diluent (0) was determined by Mann Whitney U test. m-q. Immunoblot (m-n), proliferation (as measured by cell counting or BrdU incorporation) (o-p) and apoptosis (as measured by TUNEL staining) (q) analyses were performed on PAH PAVSMCs transfected with siContr or siTSC2 and treated with 10μM SRT2104 or diluent for 48hr. Data are means±SE from three experiments, each performed on the cells from a different subject. P values for SRT2104 and/or siTSC2 compared to siContr (Scr) and diluent were determined by Kruskal-Wallis rank test with Dunn’s pairwise comparison.
Figure 6.
Figure 6.. SRT2104 restores TSC2 in small PAs, attenuates PH, and reduces RV hypertrophy in mice
a. Six to eight week old male and female mice were maintained under hypoxia for three weeks and received SU5416 injection at the beginning of every week. Starting at week 4, mice kept under hypoxia were randomly assigned to receive SRT2104 (SRT) or vehicle (Veh) for 5 days/week for one week, and hemodynamic and morphological analyses were performed. Controls were same-age and -sex mice kept under normoxia. b. Immunohistochemical analysis to detect TSC2 (red), SMA (green), and DAPI (blue). Images are representative of 3 mice/group, 12 PAs/mice. Scale bar, 80 μm. For H&E staining, images are representative from 7 control mice and 6 SuHx+Vehicle or SuHx+SRT2104, 12 Pas/mouse. Scale bar, 30μm, c. PA medial thickness (PA MT) was calculated from 12-24 Pas/mouse. Data are means±SE from n=7 control mice (3 male, 4 female), n=6 PH mice (3 male, 3 female), n=6 PH+SRT2104 mice (3 male, 3 female) groups. P values were determined by one-way ANOVA with a Fisher’s LSD post hoc test. d-f. Systolic right ventricular pressure (sRVP) (d), pulmonary arterial pressure (PAP) (e), and Fulton index (RV/(LV + septum) weight ratio) (f) were calculated. Data are means±SE from n=7 control mice (3 male, 4 female), n=8 PH mice (4 male, 4 female), n=8 PH+SRT2104 mice (4 male, 4 female) groups. P values were determined by one-way ANOVA with a Fisher’s LSD post hoc test.
Figure 7.
Figure 7.. SRT2104 restores TSC2 in small PAs, attenuates PH, and reduces RV hypertrophy in rats
a. Male six to eight weeks old rats received one SU5416 injection and were maintained under hypoxia for three weeks. Starting week 4, rats were transferred to normoxia and were randomly assigned to receive SRT2104 (SRT) or vehicle (Veh) for five days/week for five weeks (days 21-56 of the experiment). Upon experiment termination, rats were subjected to hemodynamic and morphological analyses. Controls were same-age untreated male rats kept under normoxia for eight weeks or exposed to SU5416-hypoxia-normoxia without treatment. b. Immunohistochemistry was performed for TSC2 (red), SMA (green) and DAPI (blue) and H&E analyses. Scale bar, 50 μm. Images are representative from 6 rats/group, 12 PAs/rat. c-i: Percentage of fully (grade 2), partially (grade 1) and not occluded PAs (grade 0) was determined (c). Scale bar, 50 μm. PA MT (d), sRVP (e), PAP (f), Fulton index (g), RV contractility (Max(dP/dt)) (h), and RV contractility index (i) were measured on day 56. Data are means±SE from 6 rats/group. *p<0.05 compared to control, #p<0.05 compared to PH. P values were determined by one-way ANOVA with a Tukey’s post hoc test (c), one-way ANOVA with a Fisher’s LSD post hoc test (d), and Welch’s one-way ANOVA F test with Games-Howell post-hoc analysis (e-i).
Figure 8.
Figure 8.. Schematic representation of the mechanism by which decreased TSC2 abundance in PAVSMCs promotes pulmonary vascular remodeling and PH.
Decreased TSC2 abundance in PAH PAVSMCs, caused predominantly by the ECM stiffening, results in excessive production of fibronectin, ECM remodeling, over-accumulation of YAP/TAZ, and activation of mTOR, leading to increased proliferation of PAVSMCs and PAAFs, reduced apoptosis of PAVSMCs, pulmonary vascular remodeling, and pulmonary hypertension. The SIRT1 activator SRT2104 restores functional TSC2, resolves the molecular and cellular abnormalities caused by decreased TSC2 protein content, and attenuates pulmonary vascular remodeling and pulmonary hypertension.

References

    1. Humbert M, Morrell NW, Archer SL, Stenmark KR, MacLean MR, Lang IM, Christman BW, Weir EK, Eickelberg O, Voelkel NF, Rabinovitch M. Cellular and molecular pathobiology of pulmonary arterial hypertension. Journal of the American College of Cardiology 2004; 43: S13–S24. - PubMed
    1. Hyduk A, Croft JB, Ayala C, Zheng K, Zheng ZJ, Mensah GA. Pulmonary Hypertension Surveillance --- United States, 1980--2002. MMWR Surveillance Summaries 2005: 1–28. - PubMed
    1. George MG, Schieb LJ, Ayala C, Talwalkar A, Levant S. Pulmonary hypertension surveillance: United states, 2001 to 2010. Chest 2014; 146: 476–495. - PMC - PubMed
    1. Frost AE, Badesch DB, Barst RJ, Benza RL, Elliott CG, Farber HW, Krichman A, Liou TG, Raskob GE, Wason P, Feldkircher K, Turner M, McGoon MD. The Changing Picture of Patients With Pulmonary Arterial Hypertension in the United States. Chest 2011; 139: 128–137. - PubMed
    1. Guignabert C, Tu L, Le Hiress M, Ricard N, Sattler C, Seferian A, Huertas A, Humbert M, Montani D. Pathogenesis of pulmonary arterial hypertension: lessons from cancer. European Respiratory Review 2013; 22: 543–551. - PMC - PubMed

Publication types

Supplementary concepts