Gestational Glucose Intolerance and Risk of Future Diabetes
- PMID: 36473077
- PMCID: PMC9797650
- DOI: 10.2337/dc22-1390
Gestational Glucose Intolerance and Risk of Future Diabetes
Abstract
Objective: Pregnant individuals are universally screened for gestational diabetes mellitus (GDM). Gestational glucose intolerance (GGI) (an abnormal initial GDM screening test without a GDM diagnosis) is not a recognized diabetes risk factor. We tested for an association between GGI and diabetes after pregnancy.
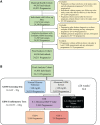
Research design and methods: We conducted a retrospective cohort study of individuals followed for prenatal and primary care. We defined GGI as an abnormal screening glucose-loading test result at ≥24 weeks' gestation with an oral glucose tolerance test (OGTT) that did not meet GDM criteria. The primary outcome was incident diabetes. We used Cox proportional hazards models with time-varying exposures and covariates to compare incident diabetes risk in individuals with GGI and normal glucose tolerance.
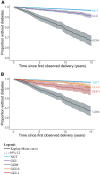
Results: Among 16,836 individuals, there were 20,359 pregnancies with normal glucose tolerance, 2,943 with GGI, and 909 with GDM. Over a median of 8.4 years of follow-up, 428 individuals developed diabetes. Individuals with GGI had increased diabetes risk compared to those with normal glucose tolerance in pregnancy (adjusted hazard ratio [aHR] 2.01 [95% CI 1.54-2.62], P < 0.001). Diabetes risk increased with the number of abnormal OGTT values (zero, aHR 1.54 [1.09-2.16], P = 0.01; one, aHR 2.97 [2.07-4.27], P < 0.001; GDM, aHR 8.26 [6.49-10.51], P < 0.001 for each compared with normal glucose tolerance). The fraction of cases of diabetes 10 years after delivery attributable to GGI and GDM was 8.5% and 28.1%, respectively.
Conclusions: GGI confers an increased risk of future diabetes. Routinely available clinical data identify an unrecognized group who may benefit from enhanced diabetes screening and prevention.
© 2022 by the American Diabetes Association.
Conflict of interest statement
Figures


Similar articles
-
Gestational Glucose Intolerance and Birth Weight-Related Complications.Obstet Gynecol. 2023 Sep 1;142(3):594-602. doi: 10.1097/AOG.0000000000005278. Epub 2023 Aug 3. Obstet Gynecol. 2023. PMID: 37539973 Free PMC article.
-
Glucose tolerance test with a single abnormal value in pregnancy and the risk of type-2 diabetes mellitus.Arch Gynecol Obstet. 2022 Apr;305(4):869-875. doi: 10.1007/s00404-021-06207-3. Epub 2021 Aug 30. Arch Gynecol Obstet. 2022. PMID: 34459970
-
Gestational diabetes mellitus and glucose intolerance among Mexican pregnant adolescents.J Pediatr Endocrinol Metab. 2003 Mar;16(3):401-5. doi: 10.1515/jpem.2003.16.3.401. J Pediatr Endocrinol Metab. 2003. PMID: 12705365
-
Screening and diagnosing gestational diabetes mellitus.Evid Rep Technol Assess (Full Rep). 2012 Oct;(210):1-327. Evid Rep Technol Assess (Full Rep). 2012. PMID: 24423035 Free PMC article. Review.
-
[Gestational diabetes mellitus (Update 2019)].Wien Klin Wochenschr. 2019 May;131(Suppl 1):91-102. doi: 10.1007/s00508-018-1419-8. Wien Klin Wochenschr. 2019. PMID: 30980150 Review. German.
Cited by
-
Gestational Glucose Intolerance and Birth Weight-Related Complications.Obstet Gynecol. 2023 Sep 1;142(3):594-602. doi: 10.1097/AOG.0000000000005278. Epub 2023 Aug 3. Obstet Gynecol. 2023. PMID: 37539973 Free PMC article.
-
Accelerating Medicines Partnership in Type 2 Diabetes and Common Metabolic Diseases: Collaborating to Maximize the Value of Genetic and Genomic Data.Diabetes. 2025 Jul 1;74(7):1089-1098. doi: 10.2337/db25-0042. Diabetes. 2025. PMID: 40272257 Free PMC article. Review.
-
Gestational glucose intolerance among pregnant women at the Cape Coast Teaching Hospital.BMC Pregnancy Childbirth. 2024 May 14;24(1):356. doi: 10.1186/s12884-024-06568-y. BMC Pregnancy Childbirth. 2024. PMID: 38745311 Free PMC article.
-
Are miR-26a and miR-26b microRNAs potent prognostic markers of gestational diabetes?Health Sci Rep. 2024 Jun 2;7(6):e2152. doi: 10.1002/hsr2.2152. eCollection 2024 Jun. Health Sci Rep. 2024. PMID: 38831779 Free PMC article.
-
Risk of Neonatal Hypoglycemia in Infants of Mothers With Gestational Glucose Intolerance.Diabetes Care. 2024 Jul 1;47(7):1194-1201. doi: 10.2337/dc23-2239. Diabetes Care. 2024. PMID: 38787410 Free PMC article.
References
-
- Centers for Disease Control and Prevention, U.S. Department of Health and Human Services . National Diabetes Statistics Report 2020: Estimates of Diabetes and Its Burden in the United States, 2020. Accessed 26 April 2022. Available from https://www.cdc.gov/diabetes/pdfs/data/statistics/national-diabetes-stat...
-
- Davidson KW, Barry MJ, Mangione CM, et al. .; US Preventive Services Task Force . Screening for prediabetes and type 2 diabetes: US Preventive Services Task Force recommendation statement. JAMA 2021;326:736–743 - PubMed
-
- American Diabetes Association Professional Practice Committee . 2. Classification and diagnosis of diabetes: Standards of Medical Care in Diabetes—2022. Diabetes Care 2022;45(Suppl. 1):S17–S38 - PubMed
-
- ACOG practice bulletin no. 190: gestational diabetes mellitus. Obstet Gynecol 2018;131:e49–e64 - PubMed

