Probing the Role of CYP2 Enzymes in the Atropselective Metabolism of Polychlorinated Biphenyls Using Liver Microsomes from Transgenic Mouse Models
- PMID: 36473170
- PMCID: PMC9957597
- DOI: 10.1021/acs.chemrestox.2c00276
Probing the Role of CYP2 Enzymes in the Atropselective Metabolism of Polychlorinated Biphenyls Using Liver Microsomes from Transgenic Mouse Models
Abstract
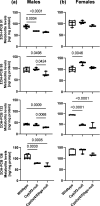
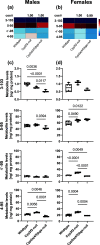
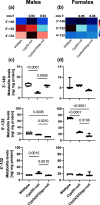
Chiral polychlorinated biphenyls (PCB) are environmentally relevant developmental neurotoxicants. Because their hydroxylated metabolites (OH-PCBs) are also neurotoxic, it is necessary to determine how PCB metabolism affects the developing brain, for example, in mouse models. Because the cytochrome P450 isoforms involved in the metabolism of chiral PCBs remain unexplored, we investigated the metabolism of PCB 91 (2,2',3,4',6-pentachlorobiphenyl), PCB 95 (2,2',3,5',6-pentachlorobiphenyl), PCB 132 (2,2',3,3',4,6'-hexachlorobiphenyl), and PCB 136 (2,2',3,3',6,6'-hexachlorobiphenyl) using liver microsomes from male and female Cyp2a(4/5)bgs-null, Cyp2f2-null, and wild-type mice. Microsomes, pooled by sex, were incubated with 50 μM PCB for 30 min, and the levels and enantiomeric fractions of the OH-PCBs were determined gas chromatographically. All four PCB congeners appear to be atropselectively metabolized by CYP2A(4/5)BGS and CYP2F2 enzymes in a congener- and sex-dependent manner. The OH-PCB metabolite profiles of PCB 91 and PCB 132, PCB congeners with one para-chlorine substituent, differed between null and wild-type mice. No differences in the metabolite profiles were observed for PCB 95 and PCB 136, PCB congeners without a para-chlorine group. These findings suggest that Cyp2a(4/5)bgs-null and Cyp2f2-null mice can be used to study how a loss of a specific metabolic function (e.g., deletion of Cyp2a(4/5)bgs or Cyp2f2) affects the toxicity of chiral PCB congeners.
Conflict of interest statement
The authors declare no competing financial interest.
Figures


Similar articles
-
Oxidation of polychlorinated biphenyls by liver tissue slices from phenobarbital-pretreated mice is congener-specific and atropselective.Chem Res Toxicol. 2013 Nov 18;26(11):1642-51. doi: 10.1021/tx400229e. Epub 2013 Oct 23. Chem Res Toxicol. 2013. PMID: 24107130 Free PMC article.
-
Human CYP2A6, CYP2B6, AND CYP2E1 Atropselectively Metabolize Polychlorinated Biphenyls to Hydroxylated Metabolites.Environ Sci Technol. 2019 Feb 19;53(4):2114-2123. doi: 10.1021/acs.est.8b05250. Epub 2019 Feb 8. Environ Sci Technol. 2019. PMID: 30576102 Free PMC article.
-
2,2',3,5',6-Pentachlorobiphenyl (PCB 95) Is Atropselectively Metabolized to para-Hydroxylated Metabolites by Human Liver Microsomes.Chem Res Toxicol. 2016 Dec 19;29(12):2108-2110. doi: 10.1021/acs.chemrestox.6b00371. Epub 2016 Nov 22. Chem Res Toxicol. 2016. PMID: 27989147 Free PMC article.
-
Human Liver Microsomes Atropselectively Metabolize 2,2',3,4',6-Pentachlorobiphenyl (PCB 91) to a 1,2-Shift Product as the Major Metabolite.Environ Sci Technol. 2018 May 15;52(10):6000-6008. doi: 10.1021/acs.est.8b00612. Epub 2018 Apr 27. Environ Sci Technol. 2018. PMID: 29659268 Free PMC article.
-
Chiral polychlorinated biphenyls: absorption, metabolism and excretion--a review.Environ Sci Pollut Res Int. 2016 Feb;23(3):2042-57. doi: 10.1007/s11356-015-4150-2. Epub 2015 Feb 6. Environ Sci Pollut Res Int. 2016. PMID: 25651810 Free PMC article. Review.
Cited by
-
Enantiomeric Fractions Reveal Differences in the Atropselective Disposition of 2,2',3,5',6-Pentachlorobiphenyl (PCB 95) in Wildtype, Cyp2abfgs-Null, and CYP2A6-Humanized Mice.Chem Res Toxicol. 2023 Aug 21;36(8):1386-1397. doi: 10.1021/acs.chemrestox.3c00128. Epub 2023 Jul 19. Chem Res Toxicol. 2023. PMID: 37467352 Free PMC article.
-
Polychlorinated biphenyl (PCB) exposure in adult female mice can influence bladder contractility.Am J Clin Exp Urol. 2023 Oct 15;11(5):367-384. eCollection 2023. Am J Clin Exp Urol. 2023. PMID: 37941647 Free PMC article.
-
Elucidating the Metabolism of Chiral PCB95 in Wildtype and Transgenic Mouse Models with Altered Cytochrome P450 Enzymes Using Intestinal Content Screening.Chem Res Toxicol. 2024 Dec 16;37(12):1989-2002. doi: 10.1021/acs.chemrestox.4c00350. Epub 2024 Nov 19. Chem Res Toxicol. 2024. PMID: 39561283 Free PMC article.
References
-
- Schettgen T.; Esser A.; Alt A.; Randerath I.; Kraus T.; Ziegler P. Decomposition products of the initiator bis(2,4-dichlorobenzoyl)peroxide in the silicone industry: Human biomonitoring in plasma and urine of workers. Environ. Sci. Technol. 2022, 56, 8518–8527. 10.1021/acs.est.2c01530. - DOI - PubMed
Publication types
MeSH terms
Substances
Grants and funding
LinkOut - more resources
Full Text Sources

