. 2022 Dec 6:11:e80859.
doi: 10.7554/eLife.80859.

Desiccation resistance differences in Drosophila species can be largely explained by variations in cuticular hydrocarbons

Affiliations

Desiccation resistance differences in Drosophila species can be largely explained by variations in cuticular hydrocarbons

Zinan Wang et al. Elife. .

Abstract

Maintaining water balance is a universal challenge for organisms living in terrestrial environments, especially for insects, which have essential roles in our ecosystem. Although the high surface area to volume ratio in insects makes them vulnerable to water loss, insects have evolved different levels of desiccation resistance to adapt to diverse environments. To withstand desiccation, insects use a lipid layer called cuticular hydrocarbons (CHCs) to reduce water evaporation from the body surface. It has long been hypothesized that the water-proofing capability of this CHC layer, which can confer different levels of desiccation resistance, depends on its chemical composition. However, it is unknown which CHC components are important contributors to desiccation resistance and how these components can determine differences in desiccation resistance. In this study, we used machine-learning algorithms, correlation analyses, and synthetic CHCs to investigate how different CHC components affect desiccation resistance in 50 Drosophila and related species. We showed that desiccation resistance differences across these species can be largely explained by variation in CHC composition. In particular, length variation in a subset of CHCs, the methyl-branched CHCs (mbCHCs), is a key determinant of desiccation resistance. There is also a significant correlation between the evolution of longer mbCHCs and higher desiccation resistance in these species. Given that CHCs are almost ubiquitous in insects, we suggest that evolutionary changes in insect CHC components can be a general mechanism for the evolution of desiccation resistance and adaptation to diverse and changing environments.

Keywords: D. melanogaster; Drosophila species; ecology; evolutionary biology; methyl-branched cuticular hydrocarbons; none; random forest.


Conflict of interest statement

ZW, JR, JP, HC, CR, ML, HC No competing interests declared

Figures

Figure 1.
Figure 1.. A cohort-based experimental design.
A cohort-based experimental design can facilitate determining the correlation between desiccation resistance, cuticular hydrocarbons (CHCs), and body weight. Five to six cohorts of each species were established.
Figure 1—figure supplement 1.
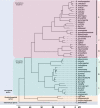
Figure 1—figure supplement 1.. The phylogeny of 50 Drosophila and related species used in this study.
Fifty species representing 46 Drosophila species (18 from Drosophila subgenus, 28 from Sophophora subgenus) and 4 species (3 Scaptodrosophila species and 1 Chymomyza species) as outgroup were used in our study. The 46 Drosophila species represent some of the main groups in the Drosophila genus: (1) melanogaster group, (2) obscura group, (3) willistoni group, (4) nasuta group, (5) virilis group, and (6) repleta group.
Figure 1—figure supplement 2.
Figure 1—figure supplement 2.. Chromatogram of the authentic standard n-alkane mixture which contains 34 n-alkanes from C7 to C40 at the same concentration.
The authentic standard n-alkane mixture (C7–C40; Supelco 49,452U) was obtained from Sigma-Aldrich (St. Louis, MO). C7–C14 were excluded in the chromatogram due to the solvent delay in the gas chromatography–mass spectrometry (GC–MS) program. The integration of peak areas on longer cuticular hydrocarbons (CHCs) is biased to have lower values. To address this issue, we corrected the peak areas of CHCs based on the carbon-chain lengths using the integration from this standard n-alkane mixture.
Figure 2.
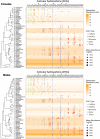
Figure 2.. Desiccation resistance and cuticular hydrocarbon (CHC) composition in 46 Drosophila species and 4 outgroup species.
Desiccation resistance and CHC composition of each species were plotted together. Males and females are shown separately. The shading intensity of each species represents the number of hours of desiccation resistance, while the size and color of each circle represent the type of CHC and its quantity. n-Alkanes are only present in some species from the melanogaster group.
Figure 2—figure supplement 1.
Figure 2—figure supplement 1.. Desiccation resistance and body weight in 46 Drosophila species and 4 outgroup species.
Desiccation resistance and body weight are shown in separate graphs.
Figure 2—figure supplement 2.
Figure 2—figure supplement 2.. The melting temperature of cuticular hydrocarbons (CHCs) is determined by methyl group, double bonds, and carbon-chain length.
Five types of CHCs are detected in this study. Due to their chemical structures, n-alkanes have the highest melting temperatures followed by mbCHCs, monoenes, dienes, and trienes. Increasing length of the carbon-chain can also increase melting temperature. The positions of double bonds in this figure are for illustrative purposes and were not determined in this study.
Figure 3.
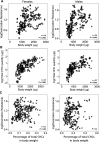
Figure 3.. Higher amounts of cuticular hydrocarbons (CHCs) do not contribute to higher desiccation resistance.
(A) Body weight is positively correlated with desiccation resistance (Females: r = 0.4, p < 0.001, Males: r = 0.5, p < 0.001). (B) Total amount of CHCs is correlated with having higher body weight (Females: r = 0.7, p < 0.001, Males: r = 0.7, p < 0.001). (C) A weak positive correlation between desiccation resistance and CHCs as a percentage of body weight in females, while no correlation in males (Females: r = 0.1, p = 0.03, Males: p = 0.1). All correlation analyses were conducted using Pearson’s method.
Figure 3—figure supplement 1.
Figure 3—figure supplement 1.. Cuticular hydrocarbon (CHC) quantity as a percentage of body weight.
As Drosophila species largely vary in size, we normalized the total CHCs as a percentage of body weight. CHCs account from 0.02% to 0.5% of the total body weight of different species.
Figure 4.
Figure 4.. Cuticular hydrocarbon (CHC) composition can be used to predict desiccation resistance.
(A) Random Forest regression modeling of CHC abundance was able to explain 85.5% of the variation in time to desiccation with a root mean square error (RMSE) of 4.5. (B) The abundance of four mbCHCs, 2MeC30, 2MeC28, 2MeC32, and 2MeC26, has the highest importance to the desiccation resistance in the random forest regression model, while most of CHCs have less contribution to the accuracy of the model for desiccation resistance.
Figure 4—figure supplement 1.
Figure 4—figure supplement 1.. The composition of cuticular hydrocarbons (CHCs) significantly differed across the increasing desiccation resistance.
The non-metric multidimensional scaling (NMDS) plot showing the beta diversity of CHCs differs significantly across the increasing desiccation resistance (permutational multivariate analysis of variance [PERMANOVA]: r2 = 0.1, p < 0.001), suggesting CHC composition could affect desiccation resistance in the 50 Drosophila and selected species.
Figure 4—figure supplement 2.
Figure 4—figure supplement 2.. Cross-validation of the random forest regression model has a similar performance to the regression model using the full dataset.
A 70:30 training/test split in the dataset (n = 382, n = 164) was used to evaluate the performance of the random forest regression model. The out of bag estimate of the root mean square error (RMSE) in the split dataset is 5.4, which is similar to the RMSE using the full dataset (RNMSE = 4.5).
Figure 5.
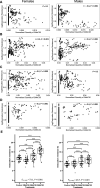
Figure 5.. Longer mbCHCs are associated with higher desiccation resistance.
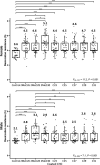
(A) Quantity of 2MeC26 is negatively correlated with desiccation resistance in males, but no correlation in females (Females: p = 0.1, Males: r = −0.4, p < 0.001). (B) Quantity of 2MeC28 is positively correlated with desiccation resistance (Females: r = 0.4, p < 0.001, Males: r = 0.4, p < 0.001). (C) Quantity of 2MeC30 is positively correlated with desiccation resistance in females, but no correlation in males (Females: r = 0.2, p = 0.009, Males: p = 0.2). (D) Quantity of 2MeC32 is positively correlated with desiccation resistance (Females: r = 0.3, p < 0.001, Males: r = 0.4, p < 0.001). Correlations between the quantities of each mbCHC and desiccation resistance were determined using Pearson’s method. (E) D. melanogaster coated with longer mbCHCs have higher desiccation resistance. Coating of synthetic mbCHCs on D. melanogaster showed that 2MeC26 does not influence desiccation resistance. 2MeC30 increases desiccation resistance in female D. melanogaster while both 2MeC28 and 2MeC30 in increases desiccation resistance in male D. melanogaster. The bold horizontal line within each box plot corresponds to the median value, the box length to the interquartile range, and the lines emanating from the box (whiskers) extend to the smallest and largest observations. One-way analysis of variance (ANOVA) showed significant differences between D. melanogaster flies coated with different mbCHCs (Female: F(3,189) = 73.1, p < 0.001, Male: F(3,191) = 23.7, p < 0.001). Post hoc comparison was conducted using Tukey’s method. ***p < 0.001; n.s. refers to not significant.
Figure 5—figure supplement 1.
Figure 5—figure supplement 1.. Correlation between different mbCHCs in 50 Drosophila and related species.
Correlation between different mbCHCs was determined using Pearson’s method. Significant correlations between each pairs of mbCHCs were labeled with stars following with the correlation coefficients. The lines on the diagonals represent the distribution of the data for each mbCHC. **p < 0.01; ***p < 0.001.
Figure 5—figure supplement 2.
Figure 5—figure supplement 2.. The length of coated mbCHCs on D. melanogaster attP40 flies is positively correlated with desiccation resistance in both females and males.
Pearson’s correlation: Female, r = 0.7, p < 0.001; Male, r = 0.5, p < 0.001.
Figure 5—figure supplement 3.
Figure 5—figure supplement 3.. Desiccation resistance of D. melanogaster attP40 flies coated with individual n-alkanes (C23, C25, C27, C29, and C31).
One-way analysis of variance (ANOVA) was applied to test the differences in desiccation resistance between the coating of different n-alkanes (Female: F(5, 277) = 17.1, p < 0.001, Male: F(5, 287) = 8.0, p < 0.001), following with post hoc comparison using Tukey’s method at alpha = 0.05. *p < 0.05; **p < 0.01; ***p < 0.001; n.s. refers to not significant. The bold horizontal line within each box plot corresponds to the median value, the box length to the interquartile range, and the lines emanating from the box (whiskers) extend to the smallest and largest observations. Numbers on top of the boxplots are the mean in each treatment.
Figure 5—figure supplement 4.
Figure 5—figure supplement 4.. The length of coated n-alkanes on D. melanogaster attP40 flies is positively correlated with desiccation resistance in both females and males.
Pearson’s correlation: Female, r = 0.4, p < 0.001; Male, r = 0.1, p = 0.02.
Figure 5—figure supplement 5.
Figure 5—figure supplement 5.. Desiccation resistance of CHC- D. melanogaster flies coated with individual mbCHCs (2MeC26, 2MeC28, 2MeC30) or n-alkanes (C23, C25, C27, C29, and C31).
One-way analysis of variance (ANOVA) was applied to test the difference of desiccation resistance between the coating of different mbCHCs and n-alkanes (Female: F(8, 417) = 11.2, p < 0.001, Male: F(8, 408) = 7.1, p < 0.001), following with post hoc comparison using Tukey’s method at alpha = 0.05. *p < 0.05; **p < 0.01; ***p < 0.001. The bold horizontal line within each box plot corresponds to the median value, the box length to the interquartile range, and the lines emanating from the box (whiskers) extend to the smallest and largest observations. Numbers on top of the boxplots are the mean in each treatment.
Figure 5—figure supplement 6.
Figure 5—figure supplement 6.. The length of coated mbCHCs on CHC- flies has a weak positive correlation with desiccation resistance in females but did not correlate with the levels of desiccation resistance in males.
Pearson’s correlation: Female, r = 0.2, p = 0.004; Male, p = 0.9.
Figure 5—figure supplement 7.
Figure 5—figure supplement 7.. The length of coated n-alkanes on CHC- flies did not correlate with desiccation resistance.
Pearson’s correlation: Female, p = 0.4; Male, p = 1.0.
Figure 5—figure supplement 8.
Figure 5—figure supplement 8.. Pathway for the synthesis of branched cuticular hydrocarbons (mbCHCs) and linear CHCs (n-alkanes, monoenes, and dienes).
All CHCs are synthesized via the fatty acyl-CoA synthesis pathway from acetyl-CoA. The pathway splits early due to the action of two fatty acid synthetases (FAS) into the branched CHC pathway or the linear CHC pathway. The precursors of each pathway are modified by synthesis enzymes such as elongases (Elo), reductases (FAR), and the terminal P450 decarbonylase (CYP4G) into CHCs. For linear CHCs, additional enzymes such as desaturases (Desat) incorporate double bonds during synthesis. The diagram was modified from Chung and Carroll, 2015.
Figure 5—figure supplement 9.
Figure 5—figure supplement 9.. Gas chromatography–mass spectrometry (GC–MS) chromatograms of 5′mFAS-GAL4, UAS-Cyp4g1-RNAi, and the F1 offspring from 5′mFAS-GAL4 × UAS-Cyp4g1-RNAi.
CHC- D. melanogaster flies are generated by crossing 5′mFAS-GAL4 and UAS-Cyp4g1-RNAi, resulting in adult oenocyte specific knockdown of Cyp4g1 and loss of cuticular hydrocarbon (CHC) production. IS = internal standard spiked in for quantification (C26). cVA = cis-vaccenyl acetate, a lipid produced in the male ejaculatory bulb not affected by the RNAi knockdown of Cyp4g1 in the oenocytes.
Figure 6.
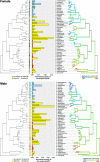
Figure 6.. Evolution of longer mbCHCs is significantly correlated with evolution of higher desiccation resistance.
Patterns in the normalized quantities of the longest mbCHCs and desiccation resistance for females (top) and males (bottom) were listed across the phylogeny of the 50 Drosophila and related species. Phylogenetic Generalized Linear Square (PGLS) analysis between the longest mbCHCs and desiccation resistance showed both the higher quantity and longer length of the longest mbCHC affect desiccation resistance (interaction term, Female: t = 3.5, p < 0.001; Male: t = 2.2, p = 0.03).
Figure 6—figure supplement 1.
Figure 6—figure supplement 1.. Ancestral state reconstruction of mbCHC for the Drosophila genus.
Bar plots on the right were the derived ancestral state of female and male mbCHC profiles for the common ancestor of the Drosophila genus (A), the Sophophora subgenus (B), the Drosophila subgenus (C), the melanogaster group (D), the willistoni group (E), the nasuta group (F), the virilis group (G), the repleta group (H), the clade of D. melanogaster, D. simulans, and D. mauritiana (I), and the clade of D. mojavensis and D. arizonae (J). 2MeC28 and 2MeC30 were the major cuticular hydrocarbons (CHCs) in the derived ancestral state (A).

Similar articles

Cited by

References

    1. Altmann A, Toloşi L, Sander O, Lengauer T. Permutation importance: a corrected feature importance measure. Bioinformatics. 2010;26:1340–1347. doi: 10.1093/bioinformatics/btq134. - DOI - PubMed
    1. Anderson MJ, Ellingsen KE, McArdle BH. Multivariate dispersion as a measure of beta diversity. Ecology Letters. 2006;9:683–693. doi: 10.1111/j.1461-0248.2006.00926.x. - DOI - PubMed
    1. Ando T, Inomata S, Yamamoto M. In: The Chemistry of Pheromones and Other Semiochemicals I. Schulz S, editor. Springer; 2004. Lepidopteran sex pheromones; pp. 51–96. - DOI - PubMed
    1. Belsley DA, Kuh E, Welsch RE. Regression diagnostics: Identifying influential data and sources of collinearity. John Wiley & Sons; 2005. - DOI
    1. Billeter JC, Atallah J, Krupp JJ, Millar JG, Levine JD. Specialized cells tag sexual and species identity in Drosophila melanogaster. Nature. 2009;461:987–991. doi: 10.1038/nature08495. - DOI - PubMed

Publication types

LinkOut - more resources