. 2022 Dec 5;57(23):2623-2637.e8.
doi: 10.1016/j.devcel.2022.11.007.

Lipolysis-derived linoleic acid drives beige fat progenitor cell proliferation

Affiliations

Lipolysis-derived linoleic acid drives beige fat progenitor cell proliferation

Ichitaro Abe et al. Dev Cell. .

Abstract

De novo beige adipocyte biogenesis involves the proliferation of progenitor cells in white adipose tissue (WAT); however, what regulates this process remains unclear. Here, we report that in mouse models but also in human tissues, WAT lipolysis-derived linoleic acid triggers beige progenitor cell proliferation following cold acclimation, β3-adrenoceptor activation, and burn injury. A subset of adipocyte progenitors, as marked by cell surface markers PDGFRα or Sca1 and CD81, harbored cristae-rich mitochondria and actively imported linoleic acid via a fatty acid transporter CD36. Linoleic acid not only was oxidized as fuel in the mitochondria but also was utilized for the synthesis of arachidonic acid-derived signaling entities such as prostaglandin D2. Oral supplementation of linoleic acid was sufficient to stimulate beige progenitor cell proliferation, even under thermoneutral conditions, in a CD36-dependent manner. Together, this study provides mechanistic insights into how diverse pathophysiological stimuli, such as cold and burn injury, promote de novo beige fat biogenesis.

Keywords: adipose tissue development; beige adipocytes; bioenergetics; brown adipose tissue; lipolysis; metabolic disease; progenitor cells; white adipose tissue.


Conflict of interest statement

Declaration of interests The authors declare no competing interests.

Figures
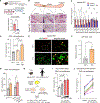
Figure 1.
Figure 1.. Cold and β3-AR stimuli induce CD81+ APC proliferation
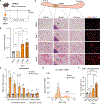
(A) Top: schematic illustration. Male mice at 10 weeks old were treated with tamoxifen at 30°C and exposed to 8°C for 3 days. Bottom: relative mRNA levels of Pparg in isolated CD81+ cells. n = 4. (B) Representative H&E staining of the inguinal WAT in (A). LN, lymph node. Scale bars, 100 μm. (C) Relative mRNA levels of indicated genes in the inguinal WAT following cold exposure. n = 6 for PpargCD81 KO, n = 4 controls. (D) Quantification of Ki67+ CD81+ cells in the inguinal WAT of mice at 30°C and 8°C for 1 day and 4 days. n = 5 for 30°C and 8°C for 1 day, n = 8 for 8°C for 4 days. (E) Left: representative immunofluorescent staining for GFP (Green)/Ki67 (Red) in the inguinal WAT of Cd81-lineage reporter mice following cold exposure. Scale bars, 100 μm. Right: magnified images. The arrowheads show GFP+ Ki67+ cells. Scale bars, 50 μm. (F) Quantification of GFP+ Ki67+ cells in (E). n = 4. (G) Quantification of Ki67+ CD81+ cells in the inguinal WAT of mice. Left: mice kept at 30°C or 8°C for 3 days. Right: mice treated with vehicle or CL316,243 for 3 days. n = 4. (H) Schematic illustration of ex vivo studies. Mouse inguinal WAT or human subcutaneous WAT were cultured with CL316,243 (0.1–1 μM in mice, 1 μM in human sample). Ki67+ CD81+ cells in the WAT samples were quantified by FACS. (I) Quantification of mouse Ki67+ CD81+ cells in (H). n = 3. (J) Quantification of human Ki67+ CD81+ cells in (H). n = 3 technical replicates for each biopsied sample (7 pairs). p value was determined by multilevel analysis. (A, C, F, and G) *p < 0.05, **p < 0.01, by two-tailed unpaired Student’s t test. (D and I) *p < 0.05, ****p < 0.0001, by one-way ANOVA followed by the Tukey-Kramer’s post hoc test. ns, not significant.
Figure 2.
Figure 2.. Burn injury stimulates CD81+ APC proliferation
(A) Schematic illustration of burn injury experiments. (B) Concentrations of free fatty acids (FFAs) at indicated time points of post-burn injury. n = 5. (C) Representative H&E staining and immunofluorescent staining for UCP1 (red)/DAPI (blue) in the inguinal WAT of mice at indicated time points of post-burn injury. LN, lymph node. Scale bars, 100 μm. (D) Relative mRNA levels of indicated genes in the inguinal WAT at day 7 post-burn injury. n = 4. *p < 0.05, **p < 0.01, by two-tailed unpaired Student’s t test. (E) Representative FACS histogram images of Ki67+ CD81+ cell population in the inguinal WAT of sham and burn injury at day 7 post-burn injury. (F) Quantification of Ki67+ CD81+ cells in the inguinal WAT of mice. n = 5. (B and F) *p < 0.05, **p < 0.01, ****p < 0.0001, by one-way ANOVA followed by the Tukey-Kramer’s post hoc test.
Figure 3.
Figure 3.. Lipolysis is required for CD81+ APC proliferation
(A) Schematic illustration of the experiments. (B) Relative mRNA levels of Pnpla2 in indicated tissues. n = 4. (C) Representative H&E staining and immunofluorescent staining for UCP1 (red)/DAPI (blue) in the inguinal WAT of mice. LN, lymph node. Scale bars, 100 μm. (D) Relative mRNA levels of indicated genes in the inguinal WAT. n = 6 for Adipo-ATGL KO mice, n = 4 for controls. (E) Quantification of Ki67+ CD81+ cells in the inguinal WAT. n = 5 at 30°C, n=7 at 8°C. (F) Quantification of Ki67+ CD81+ cells in ex vivo cultured inguinal WAT. Adipose tissues were treated with vehicle or CL316,243 at 1 μM. n = 3. (G) Quantification of Ki67+ CD81+ cells in ex vivo cultured inguinal WAT that were treated with atglistatin at 50 μM and/or CL316,243 at 1 μM. n = 4 for vehicle, and n = 5 for CL316,243. (B and D) *p < 0.05, **p < 0.01, ***p < 0.001, by two-tailed unpaired Student’s t test. (E–G) *p < 0.05, **p < 0.01, ***p < 0.001, by one-way ANOVA followed by the Tukey-Kramer’s post hoc test.
Figure 4.
Figure 4.. Linoleic acid stimulates CD81+ APC proliferation
(A) Schematic illustration of the experiments. See text for details. (B) Relative cell number (normalized to each vehicle) of inguinal WAT-derived CD81+ cells in (A). n = 4. (C) Candidates of fatty acids studied in the study. (D) Heatmap of cell numbers in CD81+ cells treated with indicated fatty acids for 4 days. The color scale shows Z score levels of the relative cell number. n = 4. p value by two-way repeated-measures ANOVA is shown in each panel. (E) Quantification of CD81+ cells in indicated cell cycle phases. n = 3. (F) The cell number of inguinal WAT-derived CD81+ cells treated with indicated molecules for 4 days. n = 4. ***p < 0.001 by one-way ANOVA followed by the Tukey-Kramer’s post hoc test. (G) Schematic illustration of linoleic acid supplementation. (H) Quantification of Ki67+ CD81+ cells in the inguinal WAT following linoleic acid supplementation at 30°C. n = 7. (I) Relative mRNA levels of indicated genes in the inguinal WAT following cold exposure. n = 9. (J) Representative immunofluorescent staining for GFP (green)/UCP1 (red) in the inguinal WAT of Cd81-lineage reporter mice following linoleic acid supplementation and cold exposure. Scale bars, 100 μm. (K) Relative mRNA levels of indicated genes in the inguinal WAT following linoleic acid supplementation and cold exposure. n = 6. (L) Representative H&E staining in the inguinal WAT. LN, lymph node. Scale bars, 100 μm. (B,E, H, I, and K) *p < 0.05, **p < 0.01, ***p < 0.001, by two-tailed unpaired Student’s t test. ns, not significant.
Figure 5.
Figure 5.. CD81+ APC is enriched in mitochondrial metabolism and arachidonic acid pathway
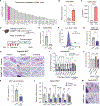
(A) Heatmap of transcriptome in CD81+ cells and CD81 cells from the inguinal WAT. The color scale shows Z score levels of each gene. n = 4. (B) Representative transmission electron microscopy images of CD81+ cells and CD81 cells in the inguinal WAT. Yellow arrowheads indicate the mitochondria. Scale bars, 2 μm. Inset: magnified images of the mitochondria. Scale bars, 0.5 μm. (C) Changes in OCR in inguinal WAT-derived CD81+ cells and CD81 cells treated with indicated compounds. n = 8 for CD81+ cells, n = 10 for CD81 cells. **p < 0.01, ***p < 0.001, by two-way repeated-measures ANOVA followed by two-tailed unpaired Student’s t test. (D) Changes in OCR in inguinal WAT-derived CD81+ cells treated with indicated molecules. n = 5. *p < 0.05, **p < 0.01, ****p < 0.0001 (versus vehicle), and ☨☨p < 0.01, ☨☨☨☨p < 0.0001 (versus linoleic acid), by two-way repeated-measures ANOVA followed by two-tailed unpaired Student’s t test. (E) Left: upregulated (red) and downregulated (blue) genes in CD81+ cells relative to CD81 cells. Right: heatmap of indicated genes as shown by Z score levels. n = 4. (F) Heatmap of indicated arachidonic acid-derived lipids in CD81+ cells and CD81 cells isolated from mice following cold exposure. n = 3. (G) Relative levels of PGD2 in primary CD81+ cells and released PGD2 into the media. Cells were incubated with linoleic acid with or without a Cox2 inhibitor NS-398. n = 4. (H and I) The number of inguinal WAT-derived CD81+ cells treated with indicated compounds. n = 4. (J) Quantification of Ki67+ CD81+ cells in the inguinal WAT of mice treated with vehicle or celecoxib. n = 7 for 30°C, n = 10 at 8°C. (A and E–G) *p < 0.05, ****p < 0.0001, by two-tailed unpaired Student’s t test. (H–J) **p < 0.01, ***p < 0.001, ****p < 0.0001, by one-way ANOVA followed by the Tukey-Kramer’s post hoc test.
Figure 6.
Figure 6.. CD36 is required for CD81+ APC proliferation
(A) Relative expression levels of indicated genes enriched in inguinal WAT-derived CD81+ cells relative to CD81 cells. (B) Relative mRNA levels of Cd36 in CD81+ cells and CD81 cells. n = 4. (C) Relative Cd36 protein expression in CD81+ cells and CD81 cells. n = 4. (D) Schematic illustration of the experiments. (E) Relative mRNA levels of Cd36 in the inguinal WAT-derived CD81+ cells. n = 4. (F) Representative FACS histogram of Ki67+ CD81+ cells in (D). (G) Quantification of Ki67+ CD81+ cells in (F). n = 6. (H) Representative H&E staining in the inguinal WAT of mice in (D). LN, lymph node. Scale bars, 100 μm. (I) Relative mRNA levels of indicated genes in the inguinal WAT. n = 6. (J) The number of primary CD81+ cells treated with vehicle or linoleic acid for 4 days. n = 4. ***p < 0.001 by one-way ANOVA followed by the Tukey-Kramer’s post hoc test. (K) Quantitative analysis of Ki67+ CD81+ cells in the inguinal WAT following linoleic acid supplementation at 30°C. n = 6. (L) Relative mRNA levels of indicated genes in the inguinal WAT following linoleic acid supplementation and cold exposure. n = 6. (M) Representative H&E staining in the inguinal WAT. Scale bars, 100 μm. (B, C, E, G, I, K, and L) *p < 0.05, **p < 0.01, ****p < 0.0001, by two-tailed unpaired Student’s t test. ns, not significant.
Figure 7.
Figure 7.. A model of de novo beige fat biogenesis
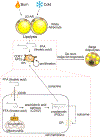
Cold, β3-AR agonist, and burn injury trigger WAT lipolysis and the release of free fatty acids. CD81+ beige progenitor cells actively uptake linoleic acid through the plasma membrane fatty acid transporter CD36 for mitochondrial β-oxidation and also for the synthesis of arachidonic-acid-derived metabolites, including PGD2 via the Cox2 pathway. PGD2 stimulates CD81+ cell proliferation by paracrine or autocrine manner via the receptor DP1.

References

    1. Chouchani ET, and Kajimura S (2019). Metabolic adaptation and maladaptation in adipose tissue. Nat. Metab 1, 189–200. 10.1038/s42255-018-0021-8. - DOI - PMC - PubMed
    1. Ikeda K, Maretich P, and Kajimura S (2018). The Common and distinct features of brown and beige adipocytes. Trends Endocrinol. Metab 29, 191–200. 10.1016/j.tem.2018.01.001. - DOI - PMC - PubMed
    1. Cohen P, and Kajimura S (2021). The cellular and functional complexity of thermogenic fat. Nat. Rev. Mol. Cell Biol 22, 393–409. 10.1038/s41580-021-00350-0. - DOI - PMC - PubMed
    1. Finlin BS, Memetimin H, Zhu B, Confides AL, Vekaria HJ, El Khouli RH, Johnson ZR, Westgate PM, Chen J, Morris AJ, et al. (2020). The beta3-adrenergic receptor agonist mirabegron improves glucose homeostasis in obese humans. J. Clin. Invest 130, 2319–2331. 10.1172/JCI134892. - DOI - PMC - PubMed
    1. Finlin BS, Memetimin H, Confides AL, Kasza I, Zhu B, Vekaria HJ, Harfmann B, Jones KA, Johnson ZR, Westgate PM, et al. (2018). Human adipose beiging in response to cold and mirabegron. JCI Insight 3, e121510. 10.1172/jci.insight.121510. - DOI - PMC - PubMed

Publication types