. 2023 Jan;613(7945):735-742.
doi: 10.1038/s41586-022-05609-w. Epub 2022 Dec 6.

Antibody feedback regulates immune memory after SARS-CoV-2 mRNA vaccination

Affiliations

Antibody feedback regulates immune memory after SARS-CoV-2 mRNA vaccination

Dennis Schaefer-Babajew et al. Nature. 2023 Jan.

Abstract

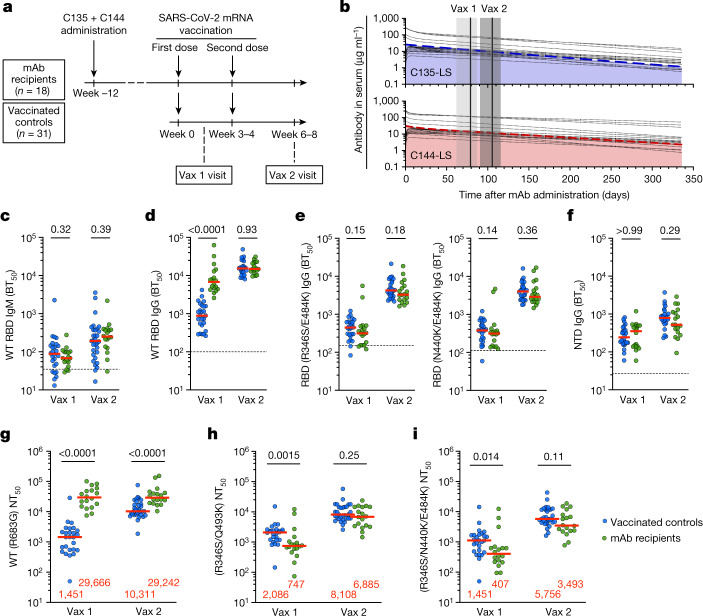
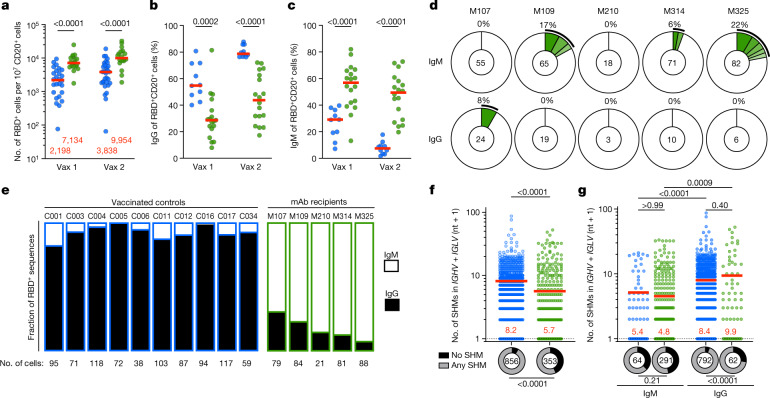
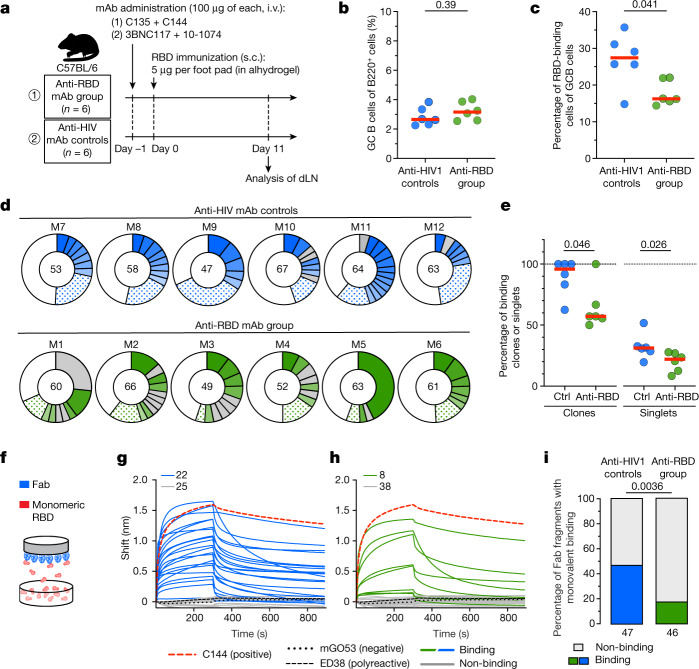
Feedback inhibition of humoral immunity by antibodies was first documented in 19091. Subsequent studies showed that, depending on the context, antibodies can enhance or inhibit immune responses2,3. However, little is known about how pre-existing antibodies influence the development of memory B cells. Here we examined the memory B cell response in individuals who received two high-affinity anti-SARS-CoV-2 monoclonal antibodies and subsequently two doses of an mRNA vaccine4-8. We found that the recipients of the monoclonal antibodies produced antigen-binding and neutralizing titres that were only fractionally lower compared than in control individuals. However, the memory B cells of the individuals who received the monoclonal antibodies differed from those of control individuals in that they predominantly expressed low-affinity IgM antibodies that carried small numbers of somatic mutations and showed altered receptor binding domain (RBD) target specificity, consistent with epitope masking. Moreover, only 1 out of 77 anti-RBD memory antibodies tested neutralized the virus. The mechanism underlying these findings was examined in experiments in mice that showed that germinal centres formed in the presence of the same antibodies were dominated by low-affinity B cells. Our results indicate that pre-existing high-affinity antibodies bias germinal centre and memory B cell selection through two distinct mechanisms: (1) by lowering the activation threshold for B cells, thereby permitting abundant lower-affinity clones to participate in the immune response; and (2) through direct masking of their cognate epitopes. This may in part explain the shifting target profile of memory antibodies elicited by booster vaccinations9.


Conflict of interest statement

The Rockefeller University has filed a provisional patent application in connection with this work, on which M.C.N. is listed as an inventor (US patent 63/021,387). The patent has been licensed by Rockefeller University to Bristol Meyers Squib. P.D.B. has received remuneration from Pfizer for consulting services related to SARS-CoV-2 vaccines.

Figures

Fig. 1
Fig. 1. Study design and plasma antibody activity.
a, Schematic of the study design, with markers denoting weeks relative to the time of the first vaccine dose. mAb, monoclonal antibody. b, Serum levels of C135-LS (top, blue) and C144-LS (bottom, red) over time are shown. The thick coloured dashed lines indicate the median serum concentrations among monoclonal antibody recipients (n = 18), and the thin dotted black lines represent individual participants. The two solid vertical lines indicate the median value and the grey shaded areas indicate the range of time from monoclonal antibody administration to vaccination. cf, The half-maximal plasma binding titre (BT50) to RBD after one (vax 1) and two doses (vax 2) of mRNA vaccination for monoclonal antibody recipients (n = 18, green) and controls (n = 26, blue). Each dot represents one individual. The dashed horizontal lines represent the median binding activity of pre-pandemic plasma samples from healthy individuals that were used as negative controls. c,d, IgM (c) and IgG (d) binding titres to WT RBD. e, IgG binding to R346S/E484K (left) and N440K/E484K RBDs (Extended Data Fig. 1). f, IgG binding to the NTD. gi, Plasma half-maximal neutralizing titre (NT50) values for monoclonal antibody recipients (n = 18, green) and controls (n = 26, blue) against HIV-1 pseudotyped with SARS-CoV-2 WT S (g), R346S/Q493K mutant S (h) and R346S/N440K/E484K mutant S (i) (Extended Data Fig. 2). The S protein in the pseudoviruses in gi contained an R683G substitution. The red horizontal bars in ci and the red numbers in gi represent the median values. Statistical significance in ci was determined using two-tailed Mann–Whitney U-tests comparing the differences between monoclonal antibody recipients and controls for each timepoint independently; P values are shown above the plots. All of the experiments were performed at least in duplicate.
Fig. 2
Fig. 2. Anti-SARS-CoV-2 RBD memory B cells from vaccinated monoclonal antibody recipients.
ac, Flow cytometry enumeration and surface immunoglobulin expression of SARS-CoV-2 RBD-specific memory B cells after vax 1 and vax 2, isolated from monoclonal antibody recipients (green, n = 18) and control individuals, (blue). n = 26 for vax 1 and n = 31 for vax 2 (a), and n = 10 (b and c). Each dot represents one individual. The red horizontal bars (and the numbers in a) show the median values. a, The number of WT RBD-specific memory B cells per 10 million CD20+ B cells (Extended Data Fig. 3a,b). b,c, The percentage of cells among WT RBD-binding CD20+ B cells that express cell surface IgG (b) or IgM (c). d, The distribution of antibody sequences derived from cells isolated from five vaccinated monoclonal antibody recipients after vax 2 (Extended Data Fig. 4a–d). The numbers in the inner circles indicate the number of sequences analysed for the respective individual. The green coloured slices indicate clonally expanded cells (same IGHV and IGLV genes, with highly similar CDR3s) within an individual. Slice size is proportional to the number of clonally related sequences, with the fraction of clonally expanded sequences summarized as a percentage (black outline). The white areas of the pie chart indicate the proportion of sequences that were isolated only once. e, The fraction of cells containing IgG (black) versus IgM (white) transcripts per individual (see also Extended Data Fig. 4e and refs. ,). f,g, Somatic hypermutation (SHM) shown as combined heavy- and light-chain variable region nucleotide (nt) substitutions plus one (IGVH + IGVL + 1), with each dot representing one sequence from monoclonal antibody recipients (green) or controls (blue). The ring plots at the bottom show the fraction of sequences with no (IGVH + IGVL + 1 = 1) versus any (IGVH + IGVL + 1 > 1) somatic hypermutation, and the encircled numbers indicate the number of sequences analysed for all cells irrespective of isotype (f), and for IgM and IgG analysed independently (g). The red horizontal bars and numbers in f and g indicate the mean values. Statistical significance was determined using two-tailed Mann–Whitney U-tests (ac and f), Kruskal–Wallis tests with subsequent Dunn’s correction for multiple comparisons (g) and two-sided Fisher’s exact tests to compare fractions (f and g).
Fig. 3
Fig. 3. Anti-SARS-CoV-2 RBD memory antibodies from vaccinated monoclonal antibody recipients.
ac, Monoclonal antibody binding to WT RBD. a, ELISA binding of monoclonal memory antibodies derived from monoclonal antibody recipients is shown. Each curve represents one antibody. The green curves show EC50 values of <10 µg ml−1; the grey dashed lines show EC50 values of >10 µg ml−1; the solid black lines are antibodies that were below or equal to the negative control anti-HIV1 antibody 3BNC117 (thick yellow dashed line). C144 (thick, red dashed line) was used as a positive control. b, EC50 values derived from a for monoclonal antibody recipients (green) and controls (blue) for all antibodies, irrespective of isotype. c, EC50 values as in b, but IgM and IgG were analysed independently. The grey shaded area between the horizontal dotted lines indicates antibodies with EC50 > 10 µg ml−1 (poor binding) and non-binding antibodies, arbitrarily grouped at 10 and 20 µg ml−1, respectively. The ring plots summarize the fraction of all antibodies tested for the respective groups (encircled number). d, IC50 values for all monoclonal antibodies isolated from vaccinated monoclonal antibody recipients (green) or control individuals (blue). The ring plots illustrate the fraction of non-neutralizing (non-neut.; IC50 > 1,000 ng ml−1) antibodies (black slices) among all antibodies tested for the respective group (encircled number). e, IC50 values as described in d, but IgM and IgG antibodies were analysed independently. fl, Monoclonal antibody binding to monomeric and multimerized antigen by BLI. f, Schematic of monomeric binding measurements in which IgG was immobilized onto the biosensor chip and subsequently exposed to monomeric RBD (top), and multimeric binding using 6P-stabilized WT SARS-CoV-2 S protein trimers that had been tetramerized using streptavidin (bottom). g, BLI traces obtained under monovalent conditions as shown in f (top). Each curve represents one antibody. The coloured solid lines denote binding above the background represented by polyreactive antibody ED38 (dotted black line) and anti-HIV-1 antibody 3BNC117 (dashed black line). The grey lines show non-binding antibodies. C144 (thick, red dashed line) was used as a positive control. h, BLI traces as described in g for antibodies that showed no measurable binding in g and were subsequently tested for binding under polyvalent conditions as illustrated in f (bottom). i, The percentage of binding antibodies under monovalent conditions for all antibodies and by isotype. The values below the bars indicate the number of antibodies tested. j, The percentage of binding antibodies as described in i for the antibodies shown in h. k, Kd values derived under monomeric binding conditions in g for monoclonal antibody recipients (green) and controls (blue) irrespective of isotype. The ring plots illustrate the fraction of antibodies tested for the respective group (encircled number) that measurably bound to monomeric RBD (binding, white) and those for which a Kd value could not be established (no Kd, black). l, Kd values as described in k were analysed independently for IgM and IgG. m, Schematic of the BLI competition experiment: (1) the capture antibody of known epitope specificity (class-reference antibody) was bound to the biosensor chip; (2) exposed to antigen; and (3) the antibody of interest was added to the chip. n, The distribution of the epitopes targeted. The number in the centre is the number of antibodies tested. Slices coloured in shades of red and blue represent class 1, 2 and 3 or combined epitopes, and shades of grey represent class-4-containing epitopes or epitopes that could not be classified. For be, k and l, the red horizontal bars and numbers represent the median values. ND, not determined. Statistical significance was determined using two-tailed Mann–Whitney U-tests (b, d and k), Kruskal–Wallis tests with subsequent Dunn’s correction for multiple comparisons (c, e and l), two-sided Fisher’s exact tests (d, e, k and l) and the two-sided χ2 contingency statistic (b, c and n).
Fig. 4
Fig. 4. Germinal centre responses in mice pretreated with monoclonal antibodies.
a, Schematic of the experimental set-up. Pooled popliteal lymph nodes (dLN) were analysed using flow cytometry (Extended Data Fig. 7 and Methods). b,c, Enumeration of germinal centre B cells (CD38FAS+GL7+) as a fraction of all B220+ B cells (b) and RBD-binding cells as a fraction of germinal centre B (GCB) cells (c). d,e, Antibody sequences from single germinal centre B cells. d, The distribution of antibody sequences. The encircled numbers indicate the number of sequences analysed per animal. Solid pie chart slices indicate clonally expanded sequences, with slices coloured in shades of blue (controls) or green (anti-RBD monoclonal antibody group) indicating binding clones (Extended Data Fig. 7b and Supplementary Table 5). The grey slices denote non-binding clones. Sequences appearing only once are stippled (binding) or white (non-binding). e, The relative contribution of binding clones and singlets in d. fi, Binding of monoclonal germinal centre B-cell-derived Fab fragments to monomeric RBD as determined using BLI. f, The BLI set-up. g,h, Traces of Fab fragments derived from controls (g) and anti-RBD-treated mice (h). Each curve represents one Fab. The coloured solid lines denote binding above the background represented by polyreactive antibody ED38 (dashed black line) and negative control antibody mGO53 (dotted black line). The grey lines show non-binding antibodies. C144 (thick, red-dashed line) was used as the positive control. i, The percentage of binding Fab fragments, with the total number of Fab fragments tested from the control (n = 47) and anti-RBD monoclonal antibody group (n = 46) denoted below. For bi, control mice pretreated with irrelevant anti-HIV monoclonal antibodies (3BNC117 and 10-1074, n = 6) are shown in blue, and mice that received a combination of C135 and C144 (n = 6) are shown in green. For b, c and e, the coloured dots represent individual mice and the red horizontal lines indicate the median values. Statistical significance was determined using two-tailed Mann–Whitney U-tests (b, c and e) and two-sided Fisher’s exact tests (i).
Extended Data Fig. 1
Extended Data Fig. 1. C135 and C144 – selectively abrogated binding to mutant RBDs and correlations with plasma reactivity.
a-f, Monoclonal antibody binding to mutant forms of RBD. a-c, Graphs show concentration-dependent antibody binding to (a) WT, (b) R436S/E484K, and (c) N440K/E484K RBDs by C144, C135, and Class 1 (C105), Class 2 (C952), Class 3 (C881), and Class 4 (C149),,,. d-f, Graphs show concentration dependent pre-pandemic healthy donor plasma binding to (d) WT, (e) R436S/E484K, and (e) N440K/E484K RBDs in the presence (purple) or absence (dotted lines) of 100 mg ml−1 of C135 and C144. Addition of C144 and C135 to plasma increases the binding activity of plasma against the WT but not the 2 mutant RBDs. g-h, Panels show the correlation of C135-LS (g) and C144-LS (h) serum levels at day 84 post-administration (around the times of vaccination as seen in Fig. 1b) with the total anti-WT RBD IgG antibody titre of mAb recipients (n = 18) after one (empty green circles) and two doses (solid green dots) of mRNA vaccination. Statistical significance in g (r = 0.9097 and r = 0.5891 with p < 0.0001 and p = 0.0101 for vax1 and vax2, respectively) and h (r = 0.8772 and r = 0.5483 with p < 0.0001 and p = 0.0185 for vax1 and vax2, respectively) was determined using the two-tailed Pearson correlation statistic. All experiments were performed at least in duplicate.
Extended Data Fig. 2
Extended Data Fig. 2. SARS-CoV-2 R346S/Q493K and R346S/N440K/E484K pseudotype virus neutralization by C135-LS and C144-LS, and BA.4/5 pseudotype neutralization by plasma.
a, Graphs show concentration-dependent neutralization curves for SARS-CoV-2 pseudoviruses by monoclonal antibodies. C144 (red), C135 (blue), and their equimolar combination (purple). b, Pre-pandemic plasma (squares) neutralization of WT or R346S/Q493K or R346S/N440K/E484K pseudoviruses in the absence or presence of 5 (purple dashed circles) or 100 µg ml−1 (purple solid circles) of C135 and C144. c-d, As in (b) but for convalescent plasma with intermediate (c, COV157) or strong (d, COV31) neutralizing activity. The horizontal lines in all panels indicate half-maximal neutralization. e, Plasma half-maximal neutralizing titre (NT50s) against HIV-1 pseudotyped with the BA.4/5 S. Each dot represents one individual from the control group (n = 31, blue) or from the mAb recipient group (n = 18, green). Red horizontal bars and red numbers represent median values. Statistical significance was determined using the two-tailed Mann-Whitney. For a-d, individual symbols represent the mean of two independent experiments and error bars the standard deviation. All experiments were performed at least in duplicate.
Extended Data Fig. 3
Extended Data Fig. 3. Flow-cytometry of human anti-RBD memory B cells.
a, Gating strategy for flow-cytometry phenotyping. Gating was on single lymphocytes that were CD19+ and CD20+, and CD3 CD8 CD16 Ova without uptake of live-dead dye (L/D). Antigen-specific cells were those with dual binding to Wuhan-Hu1 RBD-PE and RBD-AF647. Anti-IgG, -IgM were used to phenotype dual RBD-labelled B cells. b,c, Representative flow-cytometry plots of Wuhan Hu-1 RBD-binding memory B cells from mAb recipients after one and two doses of vaccination (b) and pre-pandemic health donors (c) serving as negative controls. Numbers in RBD-gate denote percentage of RBD dual-labelled cells of parent gate (see a). Corresponding flow-cytometry plots and gating strategy for vaccinated controls can be found in. d-e, Number of IgG- (d) and IgM-expressing (e) WT RBD-specific memory B cells per 10 million CD20+ B cells. Each dot represents one individual from the mAb recipient (green, n = 18) and control group (blue, n = 10),. Horizontal red bars denote median values. f-i, Panels show the correlation of C135-LS (f, g) and C144-LS (h,i) serum levels at day 84 post-administration (around the times of vaccination as seen in Fig. 1b) with the percentage of WT RBD-specific memory B cells expressing either IgG (f, h) or IgM (g, i) after two vaccine doses as assessed by flow-cytometry. Green dots represent individual mAb recipients (n = 18). Statistical significance was determined using the two-tailed Mann-Whitney for d and e, and the Pearson r correlation statistic was used for f-i.
Extended Data Fig. 4
Extended Data Fig. 4. Fluorescence-activated cell sorting (FACS) of human anti-RBD memory B cells and subsequent BCR sequencing.
a-b, Panels showing IgG (a) and IgM (b) surface expression of anti-RBD memory cells exactly as in Fig. 2b and c, but with the 5 representative individuals from whom cells were subsequently sorted highlighted in yellow. c, Gating strategy for single-cell sorting of RBD-specific memory B cells. Dual-labelled (RBD-PE+/-AF647+) CD20+ CD3 CD8 CD16 Ova cells were sorted. d, Representative flow cytometry plots show RBD-binding cells that were sorted from the 5 mAb recipients. e, Pie charts show the distribution of antibody sequences derived from cells isolated from 10 vaccinated control individual after vax2. The upper panel shows IgM, and the lower panel depicts IgG sequences,. The number in the inner circle indicates the number of sequences analysed for the individual denoted above the circle. Slices coloured in shades of blue indicate cells that are clonally expanded (same IGHV and IGLV genes, with highly similar CDR3s). Pie slice size is proportional to the number of clonally related sequences. The black outline and % value indicate the frequency of clonally expanded sequences detected within an individual. White pie areas indicate the proportion of sequences isolated only once. For C005, there were no IgM transcripts amplified at the timepoint assayed. f-h, Comparison of the frequency distribution of V gene usage for the IgH and IgL among antibodies isolated from mRNA-vaccinated mAb recipients (this study) and controls,, after vax2, and from database of shared clonotypes of human antibodies from Soto et al.. Graphs show relative abundance of human IGHV (f), IGKV (g), and IGLV (h) genes within the human V gene database (in grey, Sequence Read Archive accession SRP010970), antibodies isolated from mAb recipients (in green) or vaccinated controls (in blue). Colours of stars indicate levels of statistical significance for the following frequency comparisons: black – vaccinated controls vs. database; red – mAb recipients vs. database; blue – mAb recipients vs. vaccinated controls.
Extended Data Fig. 5
Extended Data Fig. 5. WT RBD binding and WT SARS-Cov-2 neutralization by monoclonal pentameric IgM antibodies.
a-b, Panels depict WT RBD binding and WT SARS-CoV-2 S pseudotype neutralizing activity of a representative panels of monoclonal antibodies derived from IgM-expressing RBD-specific memory B cells expressed either as human IgG1 (IgG, as in Fig. 3a–c) or pentameric IgM (IgM5). a, Panel shows WT RBD EC50s of 15 monoclonal antibodies isolated from vaccinated mAb recipients (also see Supplementary Table 4). Grey shaded area between horizontal dotted lines indicates antibodies with EC50s >10 µg ml−1 (poor binding) and non-binding antibodies arbitrarily grouped at 10 and 20 µg ml−1, respectively. b, Plots show IC50s of 2 IgM-derived control antibodies (covering a wide range of neutralizing activity) in blue and 15 IgM-derived monoclonal antibodies from mAb recipients (as in a) in green, expressed as human IgG1 (IgG) or pentameric IgM (IgM5). For both panels (a, b), ring plots summarize the fraction of antibodies in the indicated category among all tested (encircled number). Red horizontal bars and numbers indicate median values. For panel a, statistical significance was determined using the two-tailed Wilcoxon matched-pairs rank test to compare differences between the same monoclonal antibodies expressed as IgG or pentameric IgM, and the Chi-squared contingency statistic was used to compare categorical distributions from ring plots.
Extended Data Fig. 6
Extended Data Fig. 6. Competition BLI.
a-d, BLI traces of antibodies assayed for competition with class-reference antibodies. Traces show initial association curve (antigen capture phase of the primary antibody) and subsequent addition of secondary antibodies of unknown class. Thin solid black lines represent antibodies isolated from mAb recipients or vaccinated controls. Thick dashed lines are self-competition traces of C105 (green in a), C144 (red in b), C135 (blue in c) and C2172 (purple in d) for classes 1–4, respectively. e, Heat-map of relative inhibition of secondary antibody binding to the preformed capture antibody-RBD complexes (grey=no binding, red=unimpaired binding, orange=indeterminate). The left panel shows antibodies from mAb recipients, while the right panel shows IgM antibodies from vaccinated controls isolated in this study (both after vax2). Details on IgG antibodies isolated from vaccinated controls can be found in,. f, BLI traces defining C2172 as Class 4. C2172 is the primary/capture antibody (in dashed purple). The addition of known class-defining antibodies C105 (in green, Class 18), C144 (in red, Class 28), C135 (in blue, Class 38), and C118 (in orange, Class 1/4) establish C2172 as a bona fide Class 4 antibody.
Extended Data Fig. 7
Extended Data Fig. 7. Flow-cytometry of germinal center responses in mAb pre-treated mice and molecular characterization of germinal-centre-derived monoclonal antibodies.
a, Gating strategy for flow-cytometry phenotyping of germinal centre B cells isolated from the draining (popliteal) lymph nodes of WT C57BL/6 mice immunized with recombinant SARS-Cov-2 RBD 11 days prior (as illustrated in Fig. 4a). Gating was on single lymphocytes that were B220+ and CD4 CD8a NK1.1 F4/80 (lineage-negative) without uptake of live-dead dye (L/D). Germinal centre B cells were those that were CD38 GL7+ CD95 (Fas)+. Antigen-specific cells were those with dual binding to Wuhan-Hu1 RBD-PE and RBD-AF647. b, Representative flow-cytometry plots of Wuhan Hu-1 RBD-binding germinal centre B cells from mice that had either received the combination of C135 and C144 (anti-RBD mAb group) or the irrelevant anti-HIV control antibodies 3BNC117 and 10–1074 (anti-HIV mAb controls) one day prior to immunization, with the percentage of binding cells denoted within the respective gate. c-d, Panels show the total number of CD38 GL7+ CD95 (Fas)+ germinal centre B cells (c) and RBD-binding germinal centre B cells (d) isolated from anti-RBD mAb pre-treated (n = 6, green) and control mice (n = 6, blue), with each dot corresponding to an individual mouse. e, Somatic hypermutation (SHM) levels of germinal centre B-cell-derived monoclonal antibodies shown as combined heavy- and light-chain variable region nucleotide substitutions plus one (IGVH+IGVL+1), with each dot representing one sequence from anti-RBD mAb pre-treated mice (green) or controls (blue). Ring plots below each column show the fraction of sequences with no (IGVH+IGVL+1 = 1) vs. any (IGVH+IGVL+1 > 1) SHM among all sequences analysed (encircled number) for the respective group. f, Percentage of sequences belonging to clones, defined as 2 or more sequences with the same IGHV and IGLV genes and with highly similar CDR3s, among all sequences obtained from the respective animal (as in Fig. 4d). Each dot represents one individual mouse from the anti-RBD mAb (n = 6, green) or control group (n = 6, blue). g, Affinity constants (Kd) of germinal centre B-cell-derived Fabs for WT SARS-CoV-2 RBD, as established from the monovalent interaction of Fabs with RBD monomers by BLI (also see Fig. 4f–i, Supplementary Table 6 and methods). Each dot represents a single Fab from the anti-RBD mAb (n = 8, green) or control group (n = 22, blue). Red horizontal bars (c-g) and numbers (e, g) indicate median (c, d, f, g) and mean (e) values. Statistical significance was determined using the two-tailed Mann-Whitney test for c-g d, and the two-sided Fisher’s exact test was used to test the relative contribution of mutated and unmutated sequences in e.

Update of

References

    1. Smith T. Active immunity produced by so called balanced or neutral mixtures of diphtheria toxin and antitoxin. J. Exp. Med. 1909;11:241–256. doi: 10.1084/jem.11.2.241. - DOI - PMC - PubMed
    1. Heyman B. Regulation of antibody responses via antibodies, complement, and Fc receptors. Annu. Rev. Immunol. 2000;18:709–737. doi: 10.1146/annurev.immunol.18.1.709. - DOI - PubMed
    1. Bournazos S, Ravetch JV. Fcgamma receptor function and the design of vaccination strategies. Immunity. 2017;47:224–233. doi: 10.1016/j.immuni.2017.07.009. - DOI - PMC - PubMed
    1. Brouwer PJM, et al. Potent neutralizing antibodies from COVID-19 patients define multiple targets of vulnerability. Science. 2020;369:643–650. doi: 10.1126/science.abc5902. - DOI - PMC - PubMed
    1. Robbiani DF, et al. Convergent antibody responses to SARS-CoV-2 in convalescent individuals. Nature. 2020;584:437–442. doi: 10.1038/s41586-020-2456-9. - DOI - PMC - PubMed

Publication types

MeSH terms