. 2022 Dec 6;13(1):7500.
doi: 10.1038/s41467-022-35330-1.

Extracellular traps from activated vascular smooth muscle cells drive the progression of atherosclerosis

Affiliations

Extracellular traps from activated vascular smooth muscle cells drive the progression of atherosclerosis

Ming Zhai et al. Nat Commun. .

Abstract

Extracellular DNA traps (ETs) represent an immune response by which cells release essential materials like chromatin and granular proteins. Previous studies have demonstrated that the transdifferentiation of vascular smooth muscle cells (VSMCs) plays a crucial role in atherosclerosis. This study seeks to investigate the interaction between CD68+ VSMCs and the formation of ETs and highlight its function in atherosclerosis. Here we show that ETs are inhibited, and atherosclerotic plaque formation is alleviated in male Myh11CrePad4flox/flox mice undergoing an adeno-associated-virus-8 (AAV8) mediating overexpression of proprotein convertase subtilisin/kexin type 9 mutation (PCSK9) injection and being challenged with a high-fat diet. Obvious ETs generated from CD68+ VSMCs are inhibited by Cl-amidine and DNase I in vitro. By utilizing VSMCs-lineage tracing technology and single-cell RNA sequencing (scRNA-seq), we demonstrate that the ETs from CD68+ VSMCs influence the progress of atherosclerosis by regulating the direction of VSMCs' transdifferentiation through STING-SOCS1 or TLR4 signaling pathway.


Conflict of interest statement

The authors declare no competing interests.

Figures

Fig. 1
Fig. 1. Neutrophil extracellular traps (NETs) or Macrophage extracellular traps (METs) were Generated in a Time-dependent Manner in the Development of Atherosclerosis Plaque.
a Regions of 10 weeks, 15 weeks, and 20 weeks HFD-fed mice’s adjacent series sections plaque had neutrophils (LY6G) co-located with H3CIT, or macrophages (CD68) co-localized with citrullinated histone H3 (H3CIT). Scale bar = 200 μm, 100μm, 25μm respectively. The white arrow showed the H3CIT+ cells of Macrophages or Neutrophils. b Quantification of the ratio of ETs+ neutrophil area/ETs+ total area within plaque lesions harvested from three-time points HFD fed Ldlr-/- mice (each time point, n = 5 mice). (10w vs 15w ****p < 0.0001; 10w vs 20w ****p < 0.0001) c Quantification of ETs+ macrophage area/ETs+ total area (each time point, n = 5 mice). (10w vs 15w ****p < 0.0001; 10w vs 20w ****p < 0.0001). d Gating strategy for CD68+ ETs+ macrophages, LY6G+ ETs+ Neutrophils, and α-SMA+ CD68+ ETs+ VSMCs. e Quantification of CD68+ ETs+ macrophages, LY6G+ ETs+ neutrophils, and α-SMA+ CD68+ ETs+ vascular smooth muscle cells (VSMCs) in the plaque harvested from n = 5, 24 weeks HFD fed mice. (CD68+ ETs+ vs LY6G+ ETs+ ****p < 0.0001; α-SMA+ CD68+ ETs+ vs α-SMA- CD68+ ETs+ ****p < 0.0001). f Representative images within plaque from HFD fed Ldlr-/- mice’s ascending aorta. Scale bar = 30 μm. The white arrow showed the α-SMA+ H3CIT+ CD68+ cells. g Immunofluorescence staining (IF) within plaque from human artery aspiration plaque. Scale bar = 10 μm. h, i IF staining of H3CIT and CD68 on the early or late stage of aortic arch plaque harvested from B6-G/R Myh11Cre mice fed on HFD diet, Scale bar = 200 μm, 50 μm, respectively. White arrows are pointed at the H3CIT positive cells within the plaque. The side of the white star represents the lumen side. For all panels, error bars represent SD. p-value was determined by unpaired two-tailed Student’s t-test (e) or one-way ANOVA with Bonferroni post-test (b, c). Source data are provided as a Source Data file. Each experiment was repeated independently 3 times for (fi).
Fig. 2
Fig. 2. Low-density lipoprotein induced CD68+ VSMCs generated ETs in Vitro.
a Oil red O staining in VSMCs. Scale bar = 50 μm. b Quantitation of a (n = 3 independent experiments). (5 vs 10, ***p = 0.0009, 5 vs 20, ****p < 0.0001; 5 vs 40, ****p < 0.0001). c CCK8 results (n = 3 independent experiments) (5 vs 10 p = 0.2341, 5 vs 20 p = 0.0827, 5 vs 40****p < 0.0001). d mRNA expression of Cd68 (**p = 0.0089), Abca1 (p = 0.1439), Mac2 (*p = 0.0466), and Cx3cr1 (**p = 0.0024), Acta2 (**p = 0.0018), Myh11 (**p = 0.0017), and Cnn1(***p = 0.0004) (n = 3 independent experiments). e CD68, α-SMA expression levels. f (**p = 0.0032) and g (****p < 0.0001), quantitation of e (n = 4 independent experiments). h PAD4 mRNA expression (n = 5 independent experiments). (**p = 0.0082). i the Expression level of PAD4 of different cells. j Quantitation of i (n = 3 independent experiments). (**p = 0.0013; ****p < 0.0001). k IF of PAD4 and α-SMA. Scale bar = 20 μm. l H3CIT’s expression of different time points. m Quantitation of l (n = 3 independent experiments). (NS p > 0.05, ****p < 0.0001; **p = 0.0097). n Released dsDNA concentration. (n = 5 independent experiments). (****p < 0.0001; *p = 0.0472). o IF of ETs from CD68+ VSMCs. Scale bar = 20 μm. p The ETs were suppressed by DNase I. q Quantitation of p (n = 3 independent experiments).NS p > 0.05, ***p = 0.0004. r Supernatant dsDNA concentration after DNase I intervened (n = 3 independent experiments). (****p < 0.0001 and ***p = 0.0008). s After siPAD4 intervened, ETs were suppressed. t, u Quantitation of s (n = 3 independent experiments) t, NS p > 0.05, ***p = 0.0007 and ***p = 0.0008; u, ****p < 0.0001. For all panels, error bars represent SD. Source data are provided as a Source Data file. p-value was determined by unpaired two-tailed Student’s t-test (d, fh) or one-way ANOVA with Bonferroni post test (b, c, j, m, n, q, r, t, u). Each experiment was repeated independently three times for (k, o). Cholesterol (chol).
Fig. 3
Fig. 3. VSMCs Specific PAD4 Deficiency Alleviated Atherosclerosis Plaque Formation and Improved the Plaque Stability.
a The procedure of mouse model. b, c Oil red O-stained results from 2 groups of mice. Scale bar = 100 μm. d Quantification b&c (each group and each time point, n = 5 mice). ****P < 0.0001. e, f Oil red O-stained aortas of mice (each group and each time point, n = 3 mice), and quantification (f) ***p = 0.0003 **p = 0.0044. Scale bar = 0.5 cm. g DsDNA concentration within plasma (each group n = 5 mice). (**p = 0.0051). h, i IF results in plaque. Scale bar = 20 μm. j Ratio H3CIT positive area/lesion area in the brachiocephalic artery (BCA) (each group n = 4 mice) or aortic root (each group n = 5 mice). ***p = 0.0003. ****p < 0.0001. k The ratio of H3CIT+, CD68+, and α-SMA+ area/lesion area in the BCA (each group n = 4 mice) or aortic root (each group n = 5 mice). ****p < 0.0001. l The ratio of H3CIT+, CD68+, and α-SMA- area/lesion area in the BCA (each group n = 4 mice), p = 0.4586 or aortic root (each group n = 5 mice), p = 0.8971. m, n HE staining and ratio of necrotic core area/plaque area in the BCA (each group n = 3 mice). Scale bar = 100 μm. The dotted area represents the necrotic area. **p = 0.0022. o, p Masson staining, and the ratio fibrous area/plaque area in BCA (each group n = 3 mice). Scale bar = 100 μm. ****p < 0.0001. q, r CD68 stained, and the ratio CD68+ area/plaque area in BCA (each group n = 3 mice). Scale bar = 50 μm. ***p = 0.0009. s, t MMP9 stained, and the ratio MMP9+ area/plaque area in BCA (each group n = 3 mice). ****p < 0.0001. Scale bar = 50 μm. NS. means no significance. White arrow means H3CIT positive cells. White star represented the lumen side. All panels, error bars represent SD. Source data are provided as a Source Data file. p-value was determined by unpaired two-tailed Student’s t-test.
Fig. 4
Fig. 4. ET Inhibition Reduced the CD68+ VSMCs and scRNA-seq Identified Multiple VSMCs-derived Cell Types During Advanced Atherosclerosis Plaque.
a Schematic diagram of the procedure of HFD fed B6-G/R Myh11CrePad4flox/flox mice and B6-G/R Myh11Cre mice for both time points. b, c Oil red O-stained aortas isolated from 24 weeks HFD-fed mice between 2 groups and related quantification (each group n = 5 mice). ****p < 0.0001. Scale bar = 0.5 cm. d The concentration of plasma dsDNA harvested from mice between groups (each group n = 3 mice). *p = 0.0265. e, f IF staining of H3CIT or CD68 in BCA plaque lesions between groups, respectively. Scale bar = 50 μm. g The percentage of H3CIT+ Tdtomato+ and CD68+ area in the total lesion area of the BCAs and the percentage of the number of CD68+ Tdtomato+ cells in the total number of CD68+ Cells (each group n = 4 mice). ****p < 0.0001. h, i Uniform manifold approximation and projection(UMAP) visualization of all single cell RNA sequencing (scRNA-seq) data from B6-G/R Myh11Cre and B6-G/R Myh11CrePad4flox/flox mice, including both Tdtomato+ and ZsGreen+ cells. For combined data of 4 samples, representative cell types for each cluster (h) and Tdtomato+ or ZsGreen+ status of cell clusters (i) were indicated. j A diagram of ratio change in Tdtomato+ cells or ZsGreen+ cells between two groups. k, l UMAP visualization of all scRNA-seq data of Tdtomato+ cells from B6-G/R Myh11Cre and B6-G/R Myh11CrePad4flox/flox mice. For combined data of 2 samples, representative cell types for each cluster (k) and cell clusters from 2 groups (l) are indicated. m Showed a diagram of ratio changes between two groups within Tdtomato+ cells. For all panels, error bars represent SD. Source data are provided as a Source Data file. p-value was determined by unpaired two-tailed Student’s t-test. BCA: brachiocephalic artery.
Fig. 5
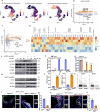
Fig. 5. PAD4 (hi) CD68+ VSMCs exhibited complex molecular and cellular functions.
a Individual cell area-under-the-curve (AUC) values overlay for selected differential canonical pathway activities. b Volcano plots of differentially expressed genes (DEGs) were screened by comparing Tdtomato+ cells harvested from B6-G/R Myh11CrePad4flox/flox mice (Pad4Δ/Δ Tdtomato+ cells) with that harvested from B6-G/R Myh11Cre mice (Pad4+/+ Tdtomato+ cells) in scRNAseq data. c Volcano plot of DEGs screened by comparing H3CIT + dsDNA challenged rat aortic vascular smooth muscle cells (RASMCs) with control RASMCs of RNA-seq data. d Heatmap showed different gene expression patterns between groups of RASMCs in c. e Western blot analysis showed RASMCs treated with H3CIT + dsDNA induced a marked decrease in the levels of phosphorylated STAT3, and STING-SOCS1 signaling pathway was activated compared with control RASMCs. f, g The Quantification of WB results in e (n = 3 independent experiments). Ox-LDL 0 h p = 0.2067, STAT3 p = 0.4199, ****p < 0.0001. h Western blot analysis showed RASMCs treated with H3CIT + dsDNA induced a marked increase in the protein levels of TLR4 and MYD88. i, j The Quantification of WB results in h (n = 3 independent experiments). ****p < 0.0001. k Violin plot of Gsdmd or Mmp9 between two groups of scRNA-seq results. l IF staining of SOCS1 in atherosclerosis plaque of BCA lesions of Pad4flox/flox mice and Myh11Cre Pad4flox/flox mice, respectively. Scale bar = 50 μm. m The Quantification of the ratio of SOCS1 positive area in plaque lesion area between 2 groups (each group n = 3 mice). ****p < 0.0001. n IF staining of GSDMD in atherosclerosis plaque of BCAs of n = 3 Pad4flox/flox mice and n = 3 Myh11Cre Pad4flox/flox mice, respectively. Scale bar = 50 μm. o The Quantification of the ratio of GSDMD positive area in plaque lesion area between 2 groups (each group n = 3 mice). p = 0.001.NS. means no significance. The side of the white star represents the lumen side. For all panels, error bars represent SD. Source data are provided as a Source Data file. p-value was determined by unpaired two-tailed Student’s t-test.
Fig. 6
Fig. 6. Mechanism diagram: PAD4 (hi) CD68+ VSMCs could activate surrounding VSMCs by releasing ETs.
PAD4 (hi) CD68+ VSMCs released ETs preferentially contributed to trans-differentiation of VSMCs to CD68+ VSMCs and increased collagen degradation, rather than VSMCs’ trans-differentiation into Fibrochondrocyte (FC) or Fibromyocyte (FM) to stabilize plaques. The ETs activated the STING-SOCS1 signaling pathway, and TLR4-MYD88 signaling pathway of surrounding VSMCs derived cells within the microenvironment of atherosclerosis plaque. The TLR4 signaling pathway activation resulted in the releases of TNF-α, MMP-9, and MMP-12, thus, causing collagen degradation. STING-SOCS1 signaling pathway activation inhibited the process of phosphorating STAT3, thus contributing to the inhibition of VSMC’s contractile phenotype and transferring to harmful-like cells, resulting in plaque progression or instability.

Similar articles

Cited by

References

    1. Vorobjeva NV, Chernyak BV. NETosis: Molecular mechanisms, role in physiology and pathology. Biochem. (Mosc.) 2020;85:1178–1190. doi: 10.1134/S0006297920100065. - DOI - PMC - PubMed
    1. Brinkmann V, et al. Neutrophil extracellular traps kill bacteria. Science. 2004;303:1532–1535. doi: 10.1126/science.1092385. - DOI - PubMed
    1. Schorn C, et al. Monosodium urate crystals induce extracellular DNA traps in neutrophils, eosinophils, and basophils but not in mononuclear cells. Front Immunol. 2012;3:277. doi: 10.3389/fimmu.2012.00277. - DOI - PMC - PubMed
    1. Chow OA, et al. Statins enhance formation of phagocyte extracellular traps. Cell Host Microbe. 2010;8:445–454. doi: 10.1016/j.chom.2010.10.005. - DOI - PMC - PubMed
    1. Doster RS, Rogers LM, Gaddy JA, Aronoff DM. Macrophage extracellular traps: a scoping review. J. Innate Immun. 2018;10:3–13. doi: 10.1159/000480373. - DOI - PMC - PubMed

Publication types

Substances