. 2022 Dec;54(12):2148-2161.
doi: 10.1038/s12276-022-00895-w. Epub 2022 Dec 6.

Inflammation promotes synucleinopathy propagation

Affiliations

Inflammation promotes synucleinopathy propagation

Tae-Kyung Kim et al. Exp Mol Med. 2022 Dec.

Erratum in

  • Correction: Inflammation promotes synucleinopathy propagation.
    Kim TK, Bae EJ, Jung BC, Choi M, Shin SJ, Park SJ, Kim JT, Jung MK, Ulusoy A, Song MY, Lee JS, Lee HJ, Di Monte DA, Lee SJ. Kim TK, et al. Exp Mol Med. 2024 Apr;56(4):1029-1030. doi: 10.1038/s12276-024-01217-y. Exp Mol Med. 2024. PMID: 38556555 Free PMC article. No abstract available.

Abstract

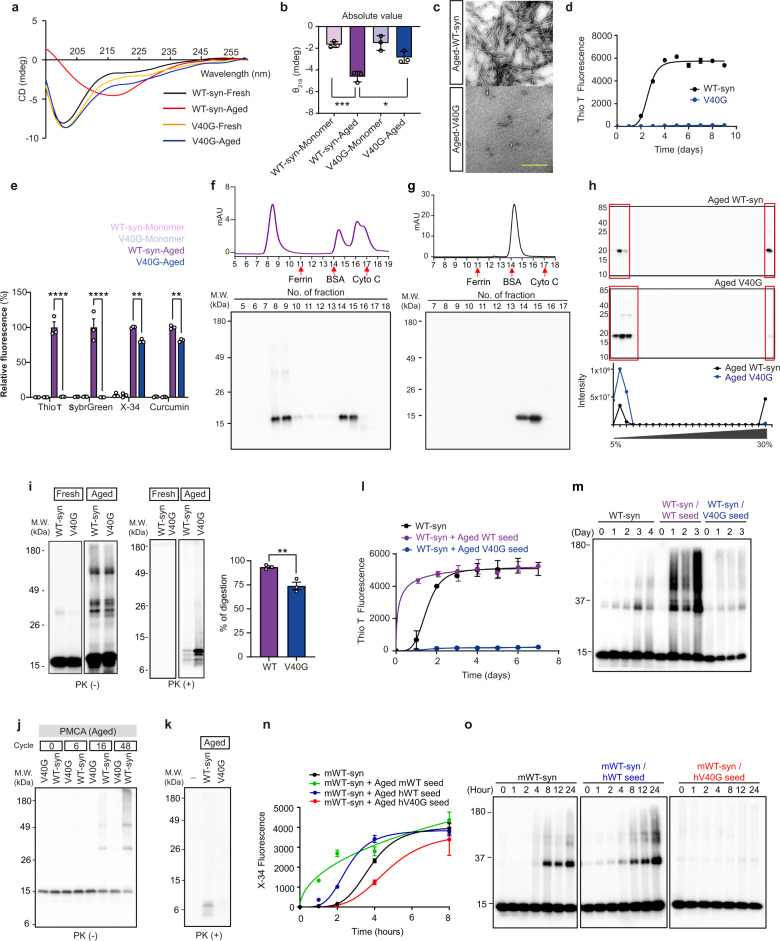
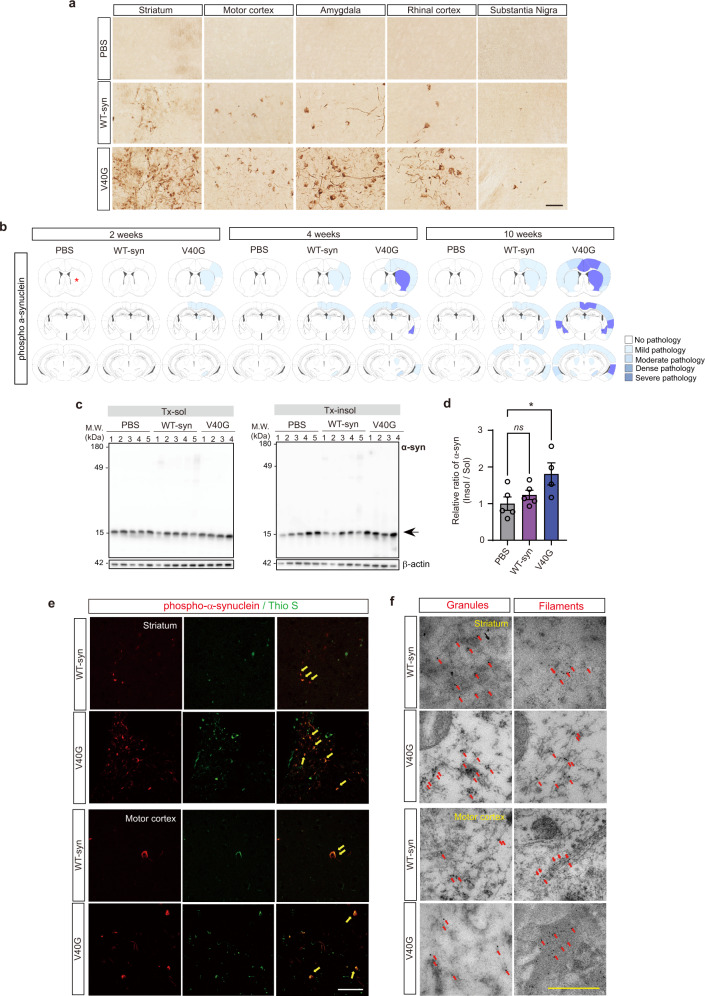
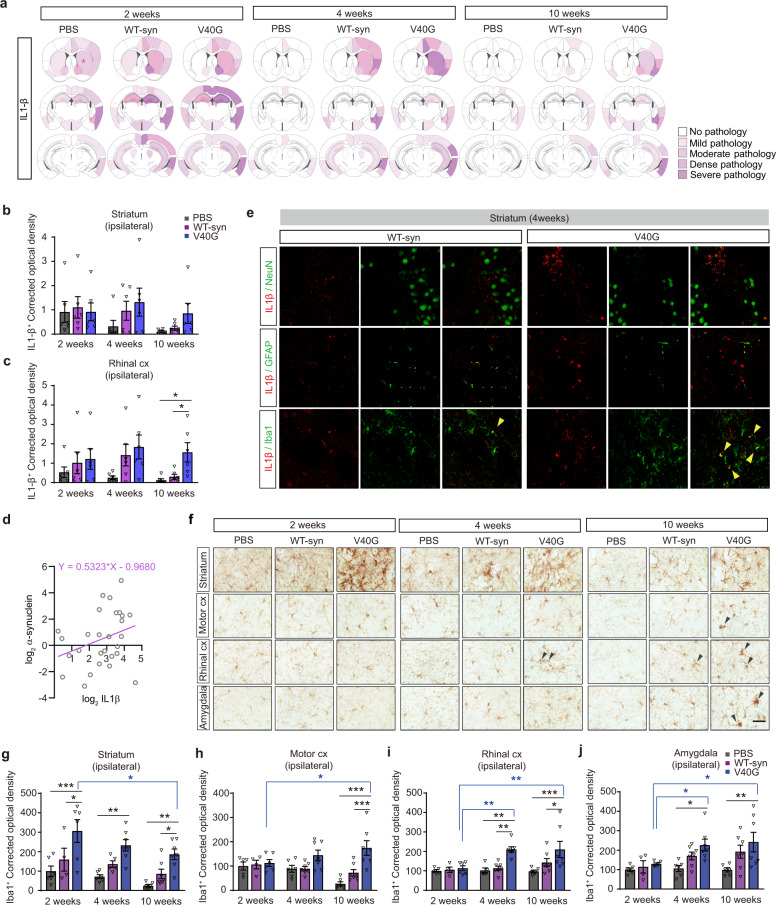
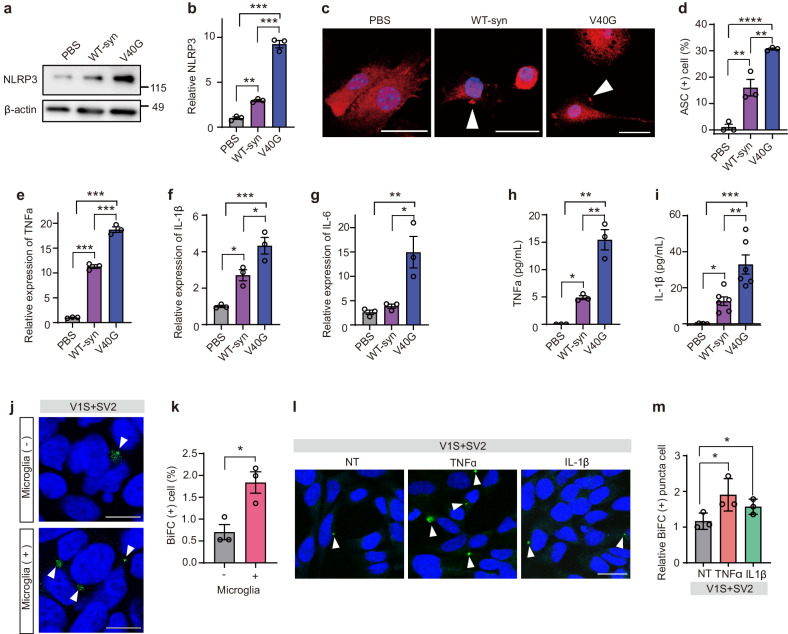
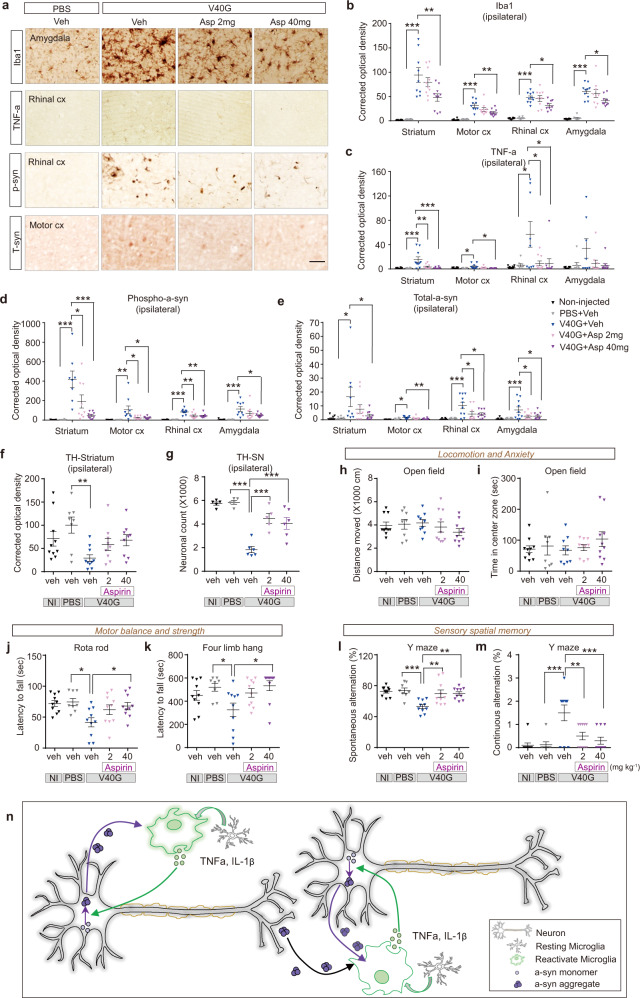
The clinical progression of neurodegenerative diseases correlates with the spread of proteinopathy in the brain. The current understanding of the mechanism of proteinopathy spread is far from complete. Here, we propose that inflammation is fundamental to proteinopathy spread. A sequence variant of α-synuclein (V40G) was much less capable of fibril formation than wild-type α-synuclein (WT-syn) and, when mixed with WT-syn, interfered with its fibrillation. However, when V40G was injected intracerebrally into mice, it induced aggregate spreading even more effectively than WT-syn. Aggregate spreading was preceded by sustained microgliosis and inflammatory responses, which were more robust with V40G than with WT-syn. Oral administration of an anti-inflammatory agent suppressed aggregate spreading, inflammation, and behavioral deficits in mice. Furthermore, exposure of cells to inflammatory cytokines increased the cell-to-cell propagation of α-synuclein. These results suggest that the inflammatory microenvironment is the major driver of the spread of synucleinopathy in the brain.


Conflict of interest statement

S-JL is a co-founder and CEO of Neuramedy Co. Ltd., and JSL is employed by Neuramedy Co. Ltd. The authors declare no competing interests.

Figures

Fig. 1
Fig. 1. Characterization of the V40G variant of α-synuclein.
a CD spectroscopy of human WT-syn monomer, V40G-syn monomer, aged WT-syn, and V40G. b Comparison of CD data at 218 nm. c TEM image of human aged WT-syn (top) and V40G (bottom). Scale bars, 0.4 μm. d Thio T binding kinetics of WT-syn or V40G recombinant α-synuclein over 9 days. e Dye binding assays of fresh/aged WT-syn and V40G. f Size exclusion chromatography (top) and western blotting (bottom) of aged V40G. Cyto C: Cytochrome C. g Size exclusion chromatography (top) and western blotting (bottom) of the V40G monomer. Cyto C: Cytochrome C. h Ultracentrifugation assay. Western blotting (top) and quantification (bottom). i Western blots and quantification of WT-syn and V40G without (left) or with PK digestion (right). Note that the size ranges of the left and right blots are different. j Western blotting of PMCA end-products without PK digestion. Human-aged WT-syn or V40G was used as a seed, and human fresh WT-syn was used as a substrate for the PMCA reaction. k Western blotting of PMCA end-products with PK digestion. l, m Thio T binding kinetics of recombinant human α-synuclein with human aged WT-syn or aged V40G as seeds. In all panels, “fresh” indicates pure monomers, and “aged” indicates the protein samples incubated for 9 days at 37 °C with constant agitation. m The results of the Thio T binding assay were confirmed by western blotting. n, o X-34 binding kinetics of recombinant mouse α-synuclein with aged human WT-syn or aged human V40G as seeds. In all panels, “fresh” indicates pure monomers, and “aged” indicates the protein samples incubated for 3–4 days at 37 °C with constant agitation. o The result from the X-34 binding assay was confirmed by western blotting. Significance was assessed by one-way ANOVA with Tukey’s post hoc comparison between groups (b) or by two-tailed unpaired Student’s t test (e, i), *P < 0.05, **P < 0.01, ***P < 0.0001. All data are presented as the mean ± SEM.
Fig. 2
Fig. 2. Spreading of synucleinopathy after intracerebral injections of the WT-syn fibril and V40G multimer α-synuclein.
a Representative images of mouse brain Section 10 weeks after injection of PBS, WT-syn fibrils and V40G multimers stained with phospho-α-synuclein (pS129). Scale bar, 50 μm. b Heatmap of regions affected by α-synuclein pathology at 2, 4, and 10 weeks after seed injection (asterisks indicate the injection site; n = 6 per group). c, d Western blotting of brain tissue extracts obtained 10 weeks after injection. The ratio of insoluble to soluble Tx-100 is quantified in (d). Data are expressed as the mean ± SEM, one-way ANOVA with Tukey’s post hoc test, two-sided, *P < 0.05. e Co-immunofluorescence images. Thioflavin-positive pS129 aggregates are indicated with arrows. t = 10 weeks. Scale bar, 100 μm. f Immunoelectron microscopy with a pS129 antibody. pS129-positive aggregates with granular and filamentous structures are indicated with arrows. t = 10 weeks. Scale bar, 0.5 μm.
Fig. 3
Fig. 3. Differential gene expression related to the inflammatory response by injection of α-synuclein.
a Heatmap representing the expression levels (log2 read count number) of DEGs upregulated (fold change >1.5) or downregulated (fold change <0.5) after injection of WT-syn fibrils or V40G multimers vs. PBS (n = 3 per group). b Venn diagram of DEGs. c, d Simplified networks of significantly enriched GO terms. The network was made from DEGs in WT-Syn-injected mice (c) and V40G-injected mice (d). Each term is statistically significant (Benjamini‒Hochberg correction <0.05). The nodes (colored circles) represent significantly enriched parent GO terms. The edges (lines between the nodes) show that there are overlapping genes within terms. The different sizes of the nodes represent the number of enriched genes. e The top 11 enriched GO terms for the 110 common DEGs in both WT-syn- and V40G-injected mice. f GO enrichment analysis of immune-related common DEGs in both WT-syn- and V40G-injected mice. g Heatmap of the log2 fold changes of 40 common DEGs related to immune and inflammatory responses.
Fig. 4
Fig. 4. The inflammatory response strongly modulates α-synuclein spreading.
a Heatmap of regions affected by IL-1β pathology at 2, 4, and 10 weeks after seed injection (asterisks indicate the injection site) (n = 6 per group). b, c Optical density of areas covered by IL-1β in the striatum (b) and rhinal cortex (c). d Correlations between IL-1β and phospho-α-synuclein (pS129) immunoreactivities in the brain region. Pearson’s correlation coefficient = 0.307822. e Co-immunofluorescence images of the striatum. IL-1β was produced in Iba-1-positive microglia but not in neurons or astrocytes. t = 4 weeks. Scale bar, 10 μm. f Representative images of regions in which α-synuclein propagation had been observed, showing reactive microglia; tissue stained with anti-Iba-1 antibody (microgliosis marker). Scale bar, 20 μm. g-j Optical density of areas covered by Iba-1 immunoreactivity. g Striatum (PBS: n = 6, 6, 6 at 2, 4, and 10 weeks, respectively; WT-syn: n = 4, 5, 7; V40G: n = 6, 7, 7). h Motor cortex (PBS: n = 5, 6, 6; WT-syn: n = 4, 7, 7; V40G: n = 6, 7, 7). i Rhinal cortex (PBS: n = 5, 5, 6; WT-syn: n = 4, 7, 7; V40G: n = 6, 7, 7). j Amygdala (PBS: n = 6, 6, 6; WT-syn: n = 4, 7, 7; V40G: n = 6, 7, 7). Data are expressed as the mean ± SEM, one-way ANOVA with Tukey’s post hoc test, two-sided, *P < 0.05, **P < 0.01, ***P < 0.0001.
Fig. 5
Fig. 5. Microglial activation promotes α-synuclein propagation.
a, b Induction of NLRP3 in microglia. The NLRP3 intensity was normalized to the value of β-actin (n = 3). c ASC speck formation in microglia. Arrowheads indicate ASC specks. Scale bar: 20 μm. d Quantification of ASC speck-positive cells (n = 3, 100 cells per experiment). e-g Relative expression of inflammatory cytokines. TNF-α (e), IL-1β (f), and IL-6 (g) in microglia. Quantitative PCR data were normalized to the average value of those in the PBS-treated group (n = 3). h, i Secretion of inflammatory cytokines in microglia. The amounts of secreted TNF-α (h) and IL-1β (i) were quantified by ELISA. n = 3 in h, n = 6 in i. j, k Effects of microglia on cell-to-cell propagation of α-synuclein. j BiFC-positive cells are indicated with arrowheads. Scale bar: 20 µm. k Quantification of BiFC-positive cells (n = 3, 200 cells per experiment). l, m Effects of TNF-α and IL-1β treatment on cell-to-cell propagation of α-synuclein. V1S and SV2 cells were cocultured and then treated with either TNF-α or IL-1β (50 ng/ml) for 24 h. l BiFC-positive cells are indicated with arrowheads. Scale bar, 20 µm. m Quantification of BiFC-positive cells (n = 3, 300 cells per experiment). Statistical significance was determined by one-way ANOVA with Tukey’s post hoc comparison between groups (b, d-i) or by a two-tailed unpaired Student’s t test (k, m), *P < 0.05, **P < 0.01, ***P < 0.0001. All data are presented as the mean ± SEM.
Fig. 6
Fig. 6. Suppression of synucleinopathy, dopaminergic terminal loss and motor functions by an anti-inflammatory drug.
a Representative images of mouse brain sections after injection of V40G multimers followed by 17 weeks of oral aspirin (ASP) administration and staining for Iba-1, TNF-α, pS129 and total α-synuclein. Scale bar, 50 μm. b-e Optical density of several brain areas covered by Iba-1, TNF-α, pS129 and total α-synuclein immunoreactivity (n = 8–10). f Optical density of the ipsilateral striatal region covered by TH immunoreactivity. (Noninjected (NI), n = 10; PBS, n = 8; V40G, n = 10; V40G + ASP 2, n = 9; V40G + ASP 40, n = 9). g Stereological cell counts of TH-immunoreactive dopaminergic neurons in the ipsilateral substantia nigra pars compacta of mice (NI, n = 5; PBS, n = 5; V40G, n = 6; V40G + ASP 2, n = 5; V40G + ASP 40, n = 6). h, i Open field test: distance moved (cm) and time in the center (s) were measures of locomotion and anxiety, respectively (NI, n = 10; PBS, n = 8; V40G, n = 9; V40G + ASP 2, n = 10; V40G + ASP 40, n = 10). j, k Rotarod and four-limb hanging tests: the latency to fall (s) in these tests served as measures of motor balance and strength, respectively (NI, n = 10; PBS, n = 8; V40G, n = 10; V40G + ASP 2, n = 10; V40G + ASP 40, n = 10). l, m Y maze: spontaneous alternation (%) and continuous alternation (n) were indicators of sensory spatial memory (NI, n = 10; PBS, n = 8; V40G, n = 10; V40G + ASP 2, n = 10; V40G + ASP 40, n = 10). Data are expressed as the mean ± SEM, one-way ANOVA with Tukey’s post hoc test, two-sided, *P < 0.05, **P < 0.01, ***P < 0.0001. n Graphic depicting the role of microglial inflammation in synucleinopathy propagation. See details in the Discussion.

References

    1. Brundin P, Melki R, Kopito R. Prion-like transmission of protein aggregates in neurodegenerative diseases. Nat. Rev. Mol. Cell Biol. 2010;11:301–307. doi: 10.1038/nrm2873. - DOI - PMC - PubMed
    1. Jucker M, Walker LC. Propagation and spread of pathogenic protein assemblies in neurodegenerative diseases. Nat. Neurosci. 2018;21:1341–1349. doi: 10.1038/s41593-018-0238-6. - DOI - PMC - PubMed
    1. Raj A, Kuceyeski A, Weiner M. A network diffusion model of disease progression in dementia. Neuron. 2012;73:1204–1215. doi: 10.1016/j.neuron.2011.12.040. - DOI - PMC - PubMed
    1. Zhou J, Gennatas ED, Kramer JH, Miller BL, Seeley WW. Predicting regional neurodegeneration from the healthy brain functional connectome. Neuron. 2012;73:1216–1227. doi: 10.1016/j.neuron.2012.03.004. - DOI - PMC - PubMed
    1. de Calignon A, et al. Propagation of tau pathology in a model of early Alzheimer’s disease. Neuron. 2012;73:685–697. doi: 10.1016/j.neuron.2011.11.033. - DOI - PMC - PubMed

Publication types

Substances