. 2023 Feb;197(3):461-478.
doi: 10.1007/s10549-022-06819-6. Epub 2022 Dec 6.

Geometric tumor embolic budding characterizes inflammatory breast cancer

Affiliations

Geometric tumor embolic budding characterizes inflammatory breast cancer

Arnav P Modi et al. Breast Cancer Res Treat. 2023 Feb.

Abstract

Purpose: Inflammatory breast cancer (IBC) is characterized by numerous tumor emboli especially within dermal lymphatics. The explanation remains a mystery.

Methods: This study combines experimental studies with two different IBC xenografts with image algorithmic studies utilizing human tissue microarrays (TMAs) of IBC vs non-IBC cases to support a novel hypothesis to explain IBC's sina qua non signature of florid lymphovascular emboli.

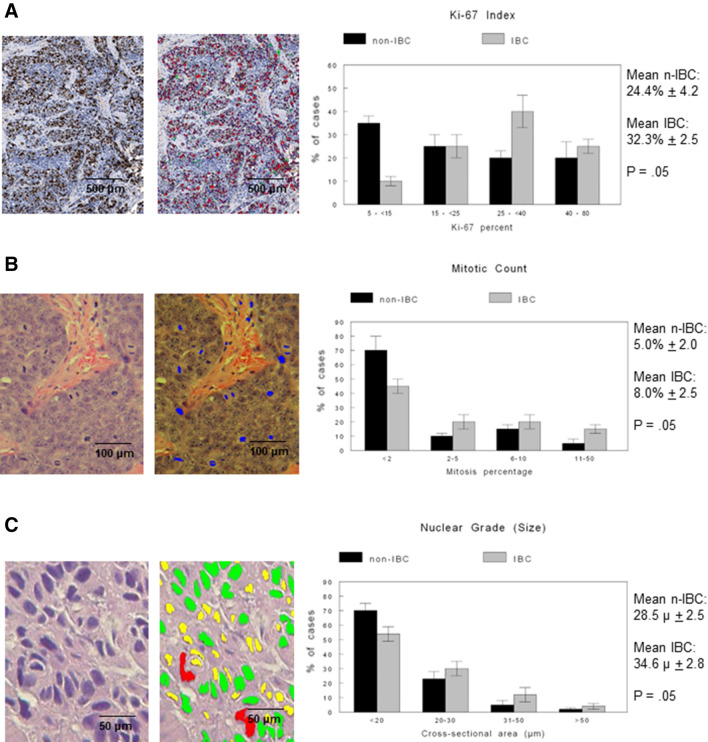
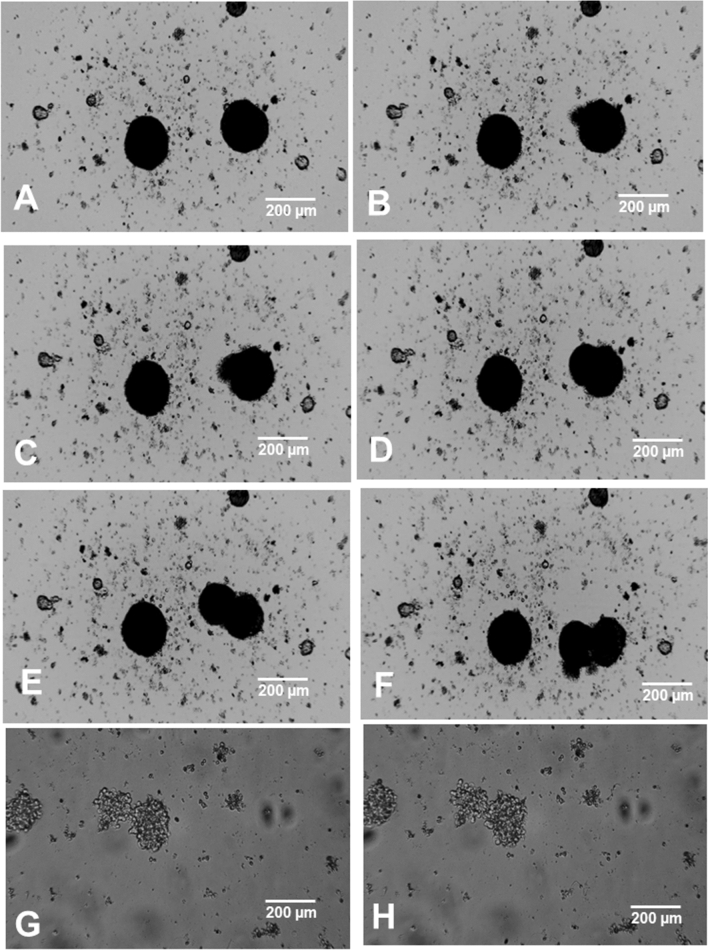
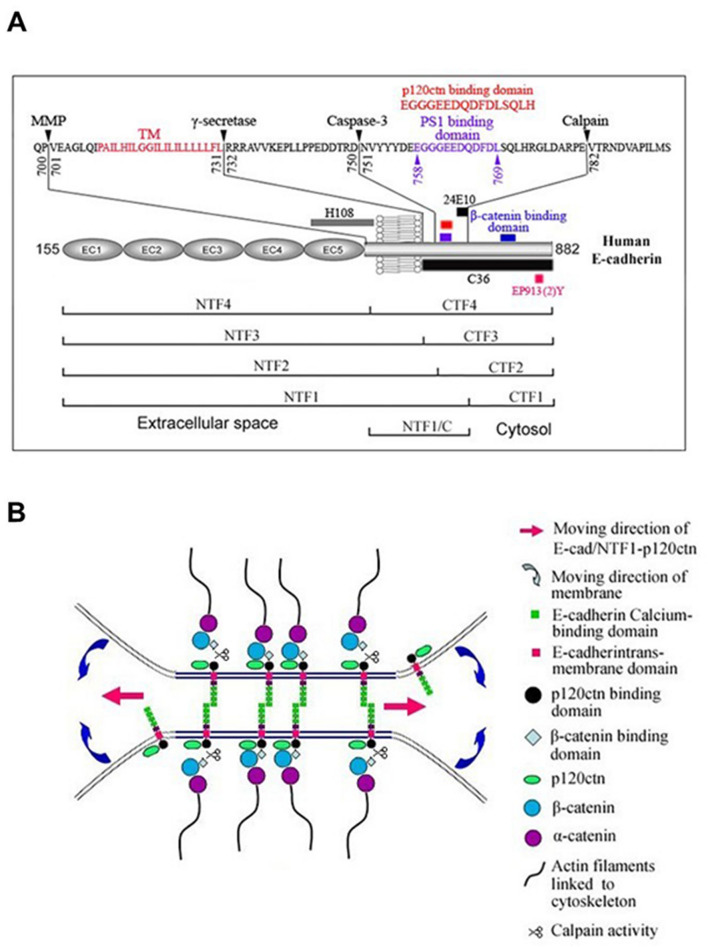
Results: In the human TMAs, compared to tumor features like nuclear grade (size), mitosis and Ki-67 immunoreactivity which show that IBC is only modestly more proliferative with larger nuclei than non-IBC, what really sets IBC apart is the markedly greater number of tumor emboli and distinctly smaller emboli whose numbers indicate geometric or exponential differences between IBC and non-IBC. In the experimental xenograft studies, Mary-X gives rise to tight spheroids in vitro which exhibit dynamic budding into smaller daughter spheroids whereas Karen-X exhibits only loose non-budding aggregates. Furthermore Mary-X emboli also bud dramatically into smaller daughter emboli in vivo. The mechanism that regulates this involves the generation of E-cad/NTF1, a calpain-mediated cleavage 100 kDa product of 120 kDa full length membrane E-cadherin. Inhibiting this calpain-mediated cleavage of E-cadherin by blocking either the calpain site of cleavage (SC) or the site of binding (SB) with specific decapeptides that both penetrate the cell membrane and mimic either the cleavage site or the binding site on E-cadherin, inhibits the generation of E-cad/NTF1 in a dose-dependent manner, reduces spheroid compactness and decreases budding.

Conclusion: Since E-cad/NFT1 retains the p120ctn binding site but loses the α-and β-catenin sites, promoting its 360° distribution around the cell's membrane, the vacilating levels of this molecule trigger budding of both the spheroids as well as the emboli. Recurrent and geometric budding of parental emboli into daughter emboli then would account for the plethora of emboli seen in IBC.

Keywords: Calpain-mediated proteolysis of E-cadherin; E-cadherin fragments; IBC; Lymphovascular tumor emboli; Spheroidgenesis; Tumor embolic budding.


Conflict of interest statement

The authors declare that they, at the present time, have no known competing financial interests or personal relationships that could have appeared to influence the work reported in this paper. None of the sources of support listed influenced the collection, analysis and interpretation of data, the generation of the hypothesis, the writing of the manuscript or the decision to submit the manuscript for publication.

Figures

Fig. 1
Fig. 1
Image and algorithmic analyses of multiple histological and immunocytochemical parameters in IBC v non-IBC human cases. A Ki-67 immunoreactivity (left), specific algorithmic recognition (middle) and Ki-67 index quantitation (right) in IBC v non-IBC are illustrated. B Mitosis histology (left), specific algorithmic recognition (middle) and mitotic count determination (right) in IBC v non-IBC are illustrated. C Nuclear histology (left), specific algorithmic quantitation (middle) and nuclear grade (size) distribution (right) in IBC v non-IBC are illustrated: yellow, < 20 µm; green, 20–30 µm; red, 31–50 µm. D Tumor embolic histology (left) and density determinations (right) in IBC v non-IBC are illustrated. E Tumor embolic histology (left) and algorithmic imaging shape determinations (right) in IBC v non-IBC are illustrated. F Tumor embolic imaging (left) and algorithmic perimeter determinations (right) in IBC v non-IBC are illustrated. Scale bars are provided. For each of these parameters, the graph depicts %cases, modal values (plotted) and calculated means ± SD. Differences of significance are depicted. All experiments were performed in quintuplicate
Fig. 1
Fig. 1
Image and algorithmic analyses of multiple histological and immunocytochemical parameters in IBC v non-IBC human cases. A Ki-67 immunoreactivity (left), specific algorithmic recognition (middle) and Ki-67 index quantitation (right) in IBC v non-IBC are illustrated. B Mitosis histology (left), specific algorithmic recognition (middle) and mitotic count determination (right) in IBC v non-IBC are illustrated. C Nuclear histology (left), specific algorithmic quantitation (middle) and nuclear grade (size) distribution (right) in IBC v non-IBC are illustrated: yellow, < 20 µm; green, 20–30 µm; red, 31–50 µm. D Tumor embolic histology (left) and density determinations (right) in IBC v non-IBC are illustrated. E Tumor embolic histology (left) and algorithmic imaging shape determinations (right) in IBC v non-IBC are illustrated. F Tumor embolic imaging (left) and algorithmic perimeter determinations (right) in IBC v non-IBC are illustrated. Scale bars are provided. For each of these parameters, the graph depicts %cases, modal values (plotted) and calculated means ± SD. Differences of significance are depicted. All experiments were performed in quintuplicate
Fig. 2
Fig. 2
Xenograft Properties. A The growth of Mary-X and Karen-X are depicted. Each time point displays the mean ± standard deviation of 10 mice. Routine histology of Mary-X (B) and Karen-X (C) shows similar nodular islands of tumor cells. E-cadherin immunocytochemistry shows more intense and more circumferential membrane immunoreactivity in Mary-X (D) compared to Karen-X (E). Mary-X gives rise to E-cadherin positive pulmonary metastases (F) as well as CTCs (F: inset) whereas Karen-X lacks both (G, G: inset). Scale bars are provided.
Fig. 3
Fig. 3
In Vitro Clump Properties. Time-lapsed phase contrast microscopy depicts Mary-X spheroids growing in suspension culture as tight aggregates which completely bud into daughter spheroids (Supplement 1). Still images of this dynamic budding are depicted (AF). In contrast, Karen-X spheroids remain as loose aggregates which do not bud (Supplement 2). Still images confirm this absence of budding (G, H)
Fig. 4
Fig. 4
Complete Budding both In Vitro and In Vivo. Complete budding of Mary-X with phase contrast (A) and single label E-cadherin immunofluorescence (B). E-cadherin immunoreactivity remains intense even at the points of the budding (B). DAPI was used as a nuclear counterstain. White arrows indicate budding points. Time-lapse photography confirms the dynamics of the budding process (Supplement 1). Double label immunofluorescent studies demonstrate tumor emboli exhibiting green immunofluorescence within podoplanin-positive lymphovascular channels exhibiting red immunofluorescence with DAPI used as a nuclear counterstain. Dramatic complete embolic budding is also observed in vivo (C). E-cadherin immunoreactivity remains intense even at the points of the budding. White arrows indicate budding points. As a result of this geometric budding, large numbers of tumor emboli are propagated (D). Scale bars are provided
Fig. 5
Fig. 5
Expression of E-cad/FL and E-cad/NTF1. Western blot using H108 reveals both E-cad/FL and E-cad/NTF1 in Mary-X but essential absence of E-cad/NTF1 in Karen-X (A). Laser capture microdissection of tumor emboli (B) from cases of IBC also confirm the presence of E-cad/NTF1 by Western blot (C)
Fig. 6
Fig. 6
Effects of SC and SB decapeptides. Dose response of SC and SB decapeptides on E-cad/NTF1 generation in Mary-X spheroids (A). Each decapeptide singly and in combination was effective at blocking calpain generation of E-cad/NTF1 illustrated by Western blots. In Karen-X spheroids, since there was no or negligible E-cad/NTF1, these decapeptides exerted no effects (B). In vitro delivery and action of fluorescently labelled decapeptides on tumor clumps are depicted (C). SC peptide labelled with Alexa Fluor 488 (green fluorescence) (top row, left panel) and the SB peptide labelled with Alexa Fluor 594 (red fluorescence) (top row, center panel) both singly and in combination (yellow fluorescence) (top row, right panel), penetrated the cell membranes (bottom row, left and right panels) and caused increased disadherence and decreased budding (D). Effects of both decapeptides were synergistic. Scale bars are provided
Fig. 6
Fig. 6
Effects of SC and SB decapeptides. Dose response of SC and SB decapeptides on E-cad/NTF1 generation in Mary-X spheroids (A). Each decapeptide singly and in combination was effective at blocking calpain generation of E-cad/NTF1 illustrated by Western blots. In Karen-X spheroids, since there was no or negligible E-cad/NTF1, these decapeptides exerted no effects (B). In vitro delivery and action of fluorescently labelled decapeptides on tumor clumps are depicted (C). SC peptide labelled with Alexa Fluor 488 (green fluorescence) (top row, left panel) and the SB peptide labelled with Alexa Fluor 594 (red fluorescence) (top row, center panel) both singly and in combination (yellow fluorescence) (top row, right panel), penetrated the cell membranes (bottom row, left and right panels) and caused increased disadherence and decreased budding (D). Effects of both decapeptides were synergistic. Scale bars are provided
Fig. 7
Fig. 7
Generation of E-cadherin and its fragments by different proteases. A Schematic (adapted by permission from Macmillan Publishers Ltd,; The EMBO Journal 2000; 21: 1948–1956, ref 71) depicts cleavage sites of calpain, caspase-3, MMP and γ-secretase including its obligate PS1 binding domain (highlighted) which is also thought to be the site of calpain binding as well and 8 of the E-cadherin fragments (E-cad/NTF1-4; E-cad/CTF1-4) generated by these specific cellular proteases. EC1-5 denote the extracellular E-cadherin repeats. TM indicates transmembrane domain (also highlighted). The sites of binding of two anti-E-cadherin antibodies, H108 and 24E10 are also depicted. Schematic adapted from Fig. 3, ref 71. B Schematic of E-cad/NTF1 membrane mobility depicts the structure of E-cad/NTF1 bound to p120ctn but not to β- or α-catenin nor the actin cytoskeleton. Therefore while E-cad/FL is tethered to the membrane in traditional CAJs, E-cad/NTF1 becomes more mobile, redistributing itself along adjacent areas of the membrane, contributing to increased budding

References

    1. Dent R, Trudeau M, Pritchard KI, Hanna WM, Kahn HK, Sawka CA, Lickley LA, Rawlinson E, Sun P, Narod SA. Triple-negative breast cancer: Clinical features and patterns of recurrence. Clin Cancer Res. 2007;13:4429–4434. doi: 10.1158/1078-0432.CCR-06-3045. - DOI - PubMed
    1. Brenton JD, Carey LA, Ahmed A, Caldas C. Molecular classification and molecular forecasting of breast cancer: Ready for clinical application? J Clin Oncol. 2005;23:7350–7360. doi: 10.1200/JCO.2005.03.3845. - DOI - PubMed
    1. Cristofanilli M, Buzdar AU, Hortobágyi GN. Update on the management of inflammatory breast cancer; update on the management of inflammatory breast cancer. Oncologist. 2003;8:141–148. doi: 10.1634/theoncologist.8-2-141. - DOI - PubMed
    1. Kertmen N, Babacan T, Keskin O, Solak M, Sarici F, Akin S, Arik Z, Asian A, Ates O, Aksoy S, Ozisik Y, Altundag K. Molecular subtypes in patients with inflammatory breast cancer. A single center experience J BUON. 2015;20:35–39. - PubMed
    1. Alpaugh ML, Tomlinson JS, Shao ZM, Barsky SH. A novel human xenograft model of inflammatory breast cancer. Cancer Res. 1999;59:5079–5084. - PubMed