

Drought patterns: their spatiotemporal variability and impacts on maize production in Limpopo province, South Africa
- PMID: 36474028
- PMCID: PMC9758106
- DOI: 10.1007/s00484-022-02392-1
Drought patterns: their spatiotemporal variability and impacts on maize production in Limpopo province, South Africa
Abstract
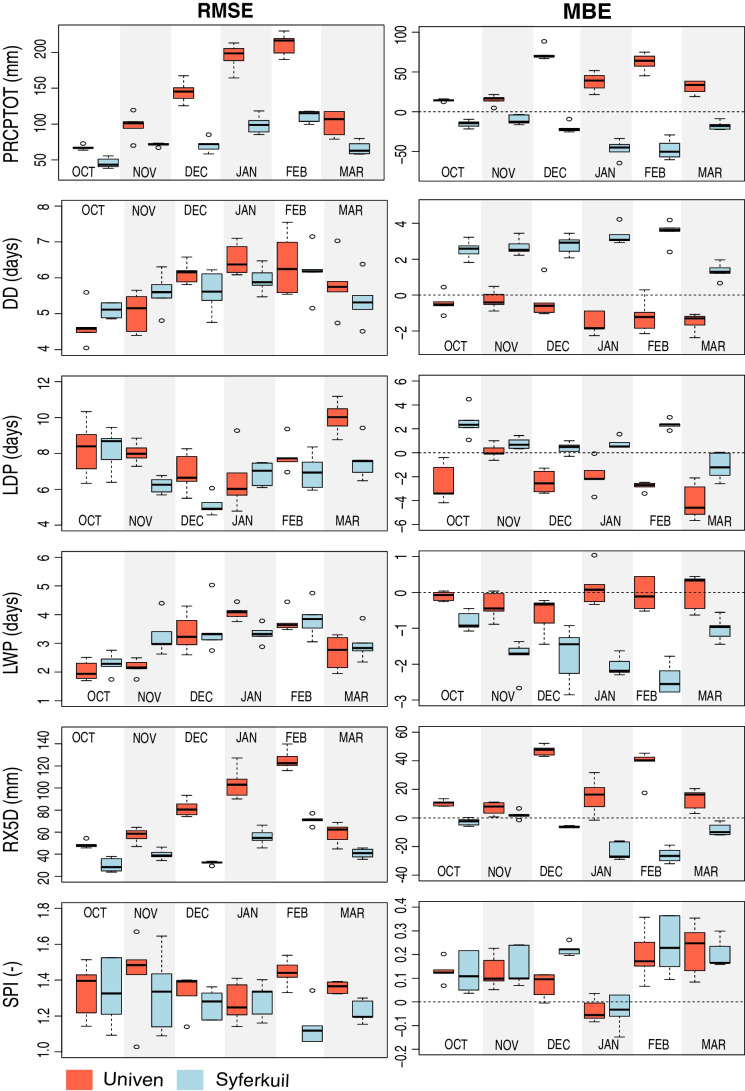
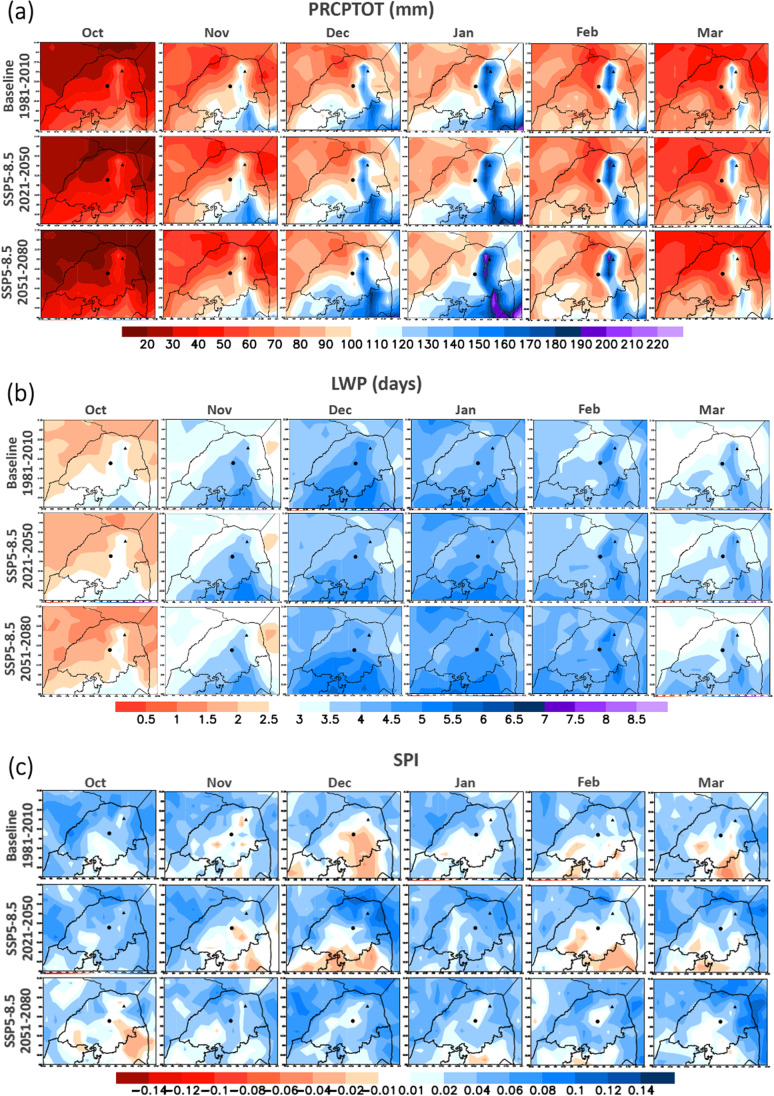
Due to global climate change, droughts are likely to become more frequent and more severe in many regions such as in South Africa. In Limpopo, observed high climate variability and projected future climate change will likely increase future maize production risks. This paper evaluates drought patterns in Limpopo at two representative sites. We studied how drought patterns are projected to change under future climatic conditions as an important step in identifying adaptation measures (e.g., breeding maize ideotypes resilient to future conditions). Thirty-year time horizons were analyzed, considering three emission scenarios and five global climate models. We applied the WOFOST crop model to simulate maize crop growth and yield formation over South Africa's summer season. We considered three different crop emergence dates. Drought indices indicated that mainly in the scenario SSP5-8.5 (2051-2080), Univen and Syferkuil will experience worsened drought conditions (DC) in the future. Maize yield tends to decline and future changes in the emergence date seem to impact yield significantly. A possible alternative is to delay sowing date to November or December to reduce the potential yield losses. The grain filling period tends to decrease in the future, and a decrease in the duration of the growth cycle is very likely. Combinations of changed sowing time with more drought tolerant maize cultivars having a longer post-anthesis phase will likely reduce the potential negative impact of climate change on maize.
Keywords: Climate change; Crop modeling; Droughts; Maize; South Africa.
© 2022. The Author(s).
Conflict of interest statement
The authors declare no competing interests.
Figures


References
-
- Abraha MG, Savage MJ. Potential impacts of climate change on the grain yield of maize for the midlands of KwaZulu-Natal, South Africa. Agr Ecosyst Environ. 2006;115(1–4):150–160. doi: 10.1016/j.agee.2005.12.020. - DOI
-
- Adams RM, Peck DE (2009). Effects of climate change on drought frequency: Potential impacts and mitigation opportunities. In: Managing Water Resources in a Time of Global Change ( 133–146). Routledge.
-
- Adger WN, Agrawala S, Mirza MMQ et al. (2007). Assessment of adaptation practices, management options, constraints and capacity. Climate Change 2007: impacts, adaptation and vulnerability Contribution of Working Group II to the Forth Assessment Report of the Intergovernmental Panel on Climate Change. Cambridge, UK and New York, USA.
-
- Agbiz (2016). Agribusiness Outlook for 2017: Available online: www.farmingportal.co.za/index.../9032- agribusiness-outlook-for-2017-south-africa
-
- Atteya AM. Alteration of water relations and yield of corn genotypes in response to drought stress. Bulg J Plant Physiol. 2003;29(1–2):63–76.
MeSH terms
Grants and funding
LinkOut - more resources
Full Text Sources
