. 2022 Dec;24(12):1701-1713.
doi: 10.1038/s41556-022-01030-7. Epub 2022 Dec 6.

LDL delivery of microbial small RNAs drives atherosclerosis through macrophage TLR8

Affiliations

LDL delivery of microbial small RNAs drives atherosclerosis through macrophage TLR8

Ryan M Allen et al. Nat Cell Biol. 2022 Dec.

Abstract

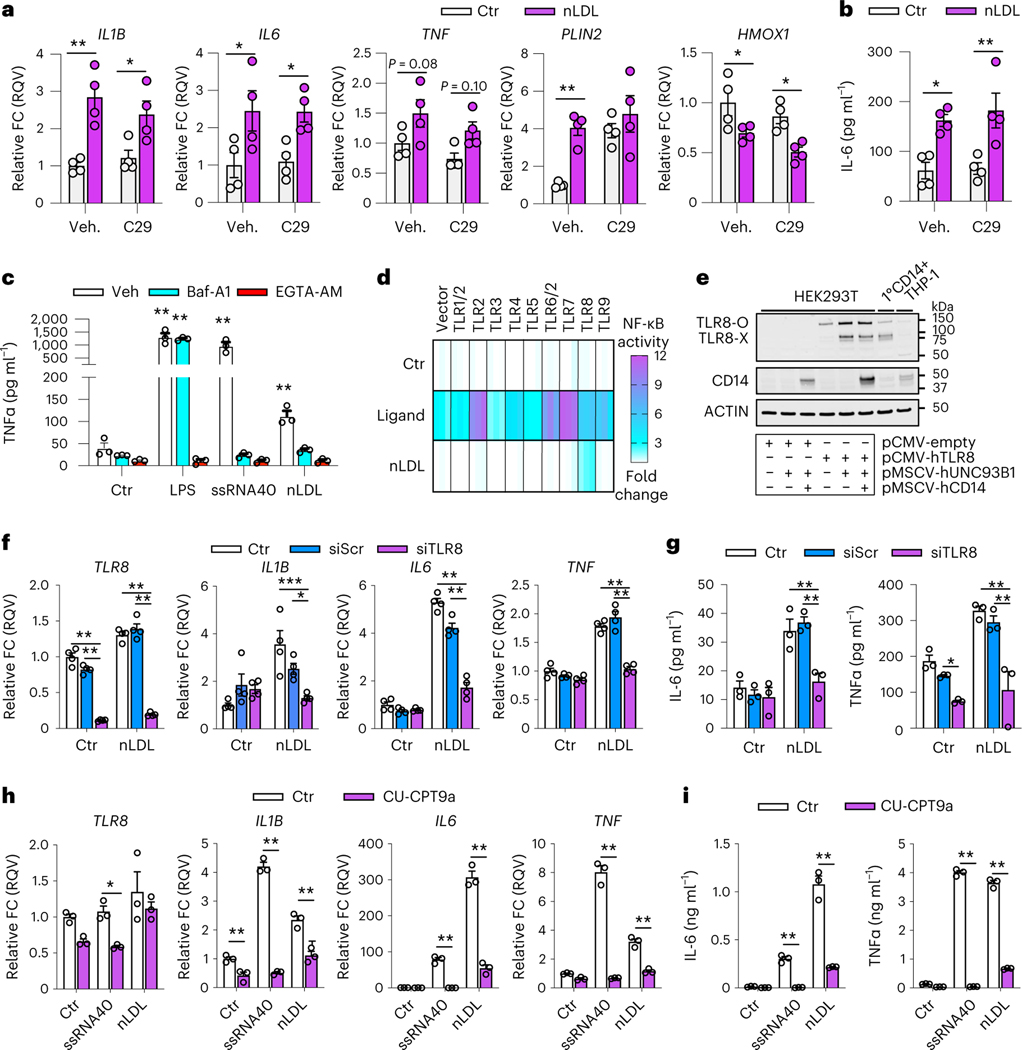
Macrophages present a spectrum of phenotypes that mediate both the pathogenesis and resolution of atherosclerotic lesions. Inflammatory macrophage phenotypes are pro-atherogenic, but the stimulatory factors that promote these phenotypes remain incompletely defined. Here we demonstrate that microbial small RNAs (msRNA) are enriched on low-density lipoprotein (LDL) and drive pro-inflammatory macrophage polarization and cytokine secretion via activation of the RNA sensor toll-like receptor 8 (TLR8). Removal of msRNA cargo during LDL re-constitution yields particles that readily promote sterol loading but fail to stimulate inflammatory activation. Competitive antagonism of TLR8 with non-targeting locked nucleic acids was found to prevent native LDL-induced macrophage polarization in vitro, and re-organize lesion macrophage phenotypes in vivo, as determined by single-cell RNA sequencing. Critically, this was associated with reduced disease burden in distinct mouse models of atherosclerosis. These results identify LDL-msRNA as instigators of atherosclerosis-associated inflammation and support alternative functions of LDL beyond cholesterol transport.


Conflict of interest statement

Competing interests

M.F.L. has received research funding from Amgen, Regeneron, Ionis, Merck, REGENXBIO, Sanofi and Novartis, and has served as a consultant for Esperion, Alexion Pharmaceuticals and REGENXBIO. All other authors have no competing interests.

Figures

Extended Data Fig. 1 |
Extended Data Fig. 1 |. nLDL induces inflammatory activation of macrophages.
(a) mRNA expression determined by qPCR of THP-1 macrophages treated with indicated doses of nLDL (matched to Fig. 1f) for 24 h (n = 3 biological replicates). (b) Quantification of immunoblots presented in Fig. 1f (n = 3 biological replicates). (c) Secreted cytokines in the media of THP-1 macrophages stimulated with 0.5 mg/ml nLDL for 3 h, 6 h, 24 h relative to cells receiving no treatment for 24 h (Ctr) (matched to Fig. 1e; n = 3 biological replicates) (d) Primary mouse bone-marrow derived macrophages (BMDM) differentiated with GM-CSF were treated with nLDL (0.5 mg/ml) for 24 h and assayed for mRNA expression by qPCR (n = 3 biological replicates), (e) cytokine secretion by ELISA (n = 3 biological replicates), and (f) protein expression in cell lysates by immunoblot (n = 2 biological replicates). Data are mean ± SEM. (a-c) One-way ANOVA and (d) Two-way ANOVA with Benjamini, Krieger and Yekutieli FDR (Q = 0.05), *q < 0.05, **q < 0.01, ***q < 0.001, ****q < 0.0001. e, Student’s t-test (unpaired, two-sided), **p < 0.01. Numerical source data, statistics, exact p values and q values are provided.
Extended Data Fig. 2 |
Extended Data Fig. 2 |. nLDL and macrophage TLR responses quality control.
(a) Total protein (top) and neutral lipid (bottom) of ox LDL, bovine serum albumin (BSA), and 10 human nLDL of independent donors resolved by agarose gel electrophoresis. Image represents two independent experiments. (b) TBARS assay of nLDL samples, or matched LDL samples treated with copper sulfate as indicated (limit of detection = 0.625 μM) (n = 10 independent preparations). (c) Quantification of total protein and lipids of DGUC-VLDL, -LDL, -HDL, or BSA following fractionation with 2x-Superose-6 columns. Lipoprotein data are matched to a single donor representative of >10 independent experiments. (d) mRNA expression of primary human macrophages (CD14 + ; GM-CSF/IFNγ) pre-treated with C29 (200 μM) for 30 min, then stimulated with PAM3CSK4 (2 ng/mL) for 4 h (n = 3 biological replicates(BR)). (e) Normalized NF-κB-driven luciferase activity of HEK293T cells over expressing an empty vector, hTLR7 or hTLR8 following treatments with vehicle (Ctr, n = 4 BR), nLDL (0.5 mg/ml, n = 4 BR), ssRNA40 (TLR8 ligand; 2 μg/mL, n = 4 BR), R848 (TLR7 ligand; 10 μM, n = 3 BR), or CL075 (TLR8 ligand; 2.5 μg/mL, n = 3 BR). (f-h) mRNA expression of THP-1 macrophages electroporated with siRNA against TLR7,TLR8, or no siRNA (Control, n = 4 BR) and then treated with (f) nLDL (0.5 mg/mL, n = 6 BR), (g) R848 (10 μM, n = 6 BR) or (h) ssRNA40 (0.5 μg/mL, n = 6 BR). (i) Relative NF-κB-driven luciferase activity of HEK293T cells over expressing an empty vector (n = 7–8), mTLR7 (n = 7–8) or mTLR8 (n = 6–8) treated with mock transfection, R848 (10 μM), ssRNA40 (2 μg/mL), or nLDL (0.5 mg/ml) for 24 h. (j) mRNA expression in wild-type (WT) and Tlr7−/− BMDMs following treatment with 0.5 mg/ml nLDL, or 1 μg/mL ssRNA40 for 24 h (n = 3 BR). (k) Relative NF-κB-driven luciferase activity of HEK293T cells over expressing human or mTLR8 pre-treated with CU-CPT9a and exposed to nLDL for 24 h (n = 4 BR). Data are mean ± SEM. (d) Two-way ANOVA; Sidak’s multiple comparisons test, ***p < 0.001, ****p < 0.0001. (e, i-k) Two-way ANOVA; Benjamini, Krieger and Yekutieli FDR (Q = 0.05), *q < 0.05, **q < 0.01, ***q < 0.001). (f-h) One-way ANOVA; Dunnett’s multiple comparisons test. *p < 0.05, **p < 0.01, ***p < 0.001, ****p < 0.0001. Numerical source data, statistics, exact p values and q values are provided.
Extended Data Fig. 3 |
Extended Data Fig. 3 |. The small RNA on LDL is predominantly exogenous and removed by LDL re-constitution.
a) Normalized abundance of taxa identified upon alignment of LDL-sRNA to non-host tRNA database (tRNA-db). RPM, reads per million total reads. b) Normalized abundance of bacterial phyla (human microbiome database) contributing sRNA to LDL. c) Normalized abundance of fungal sRNA and representative genomes present on LDL. d) Normalized abundance of algal and protist sRNA and representative genomes present on LDL. RPM, reads per million total reads. Matched nLDL and rLDL samples were fractionated by size-exclusion chromatography (SEC) using two superose-6 columns in tandem and assessed for e) phospholipid and protein content by colorimetric kit (representative data of three independent experiments), f) fluorescence (TopFluor Cholesteryl ester), and g) APOB protein by immunoblot (representative image of three independent experiments). h) Relative expression of exogenous sRNA in matched rLDL and nLDL of a single preparation relative to buffer controls. i) Oil-Red-O staining and fluorescence microscopy (TopFluor Cholesterol ester) (representative images of three biological replicates). Scale bar = 200 μm. Numerical source data, statistics, exact p values and q values are provided.
Extended Data Fig. 4 |
Extended Data Fig. 4 |. Microbial small RNA on lipoproteins is not depleted in germ-free mice.
a) Plasma from two cohorts of adult mice - specific pathogen free (SPF; n = 6 mice total) and facility-matched germ-free (GF; n = 17 mice total) fed a chow diet were harvested at the National Gnotobiotic Rodent Resource Center (NGRRC; North Carolina, USA) for lipoprotein sRNA-seq b) Plasma was fractionated by size-exclusion chromatography (SEC) and cholesterol-rich fractions corresponding with HDL were selected for sRNA-seq. c) Relative percentage of reads aligned to host and non-host databases, as well as reads too short for analysis or reads that failed to align to either database (unmapped). d) Percentage of sRNA reads aligned to host miRNA, host tRNA and host rRNA transcripts. e) Percentage of reads aligned to the non-host rRNA database and tRNA database. f) Percentage of reads aligned to genomes of fungi and algae. g) Percentage of reads aligned to bacterial genomes associated with a human microbiome (HMB) database. h) Reads per million total reads (RPM) mapped to indicated bacterial phyla within the HMB database. i) Percentage of reads aligned to bacterial genomes within an environmental bacteria (ENV) database. j) Differential abundance (log2) of bacterial sRNA (dots represent individual genomes of the HMB and ENV databases) between GF and SPF mice categorized by phyla. Gray bar represents a 1.5 fold change. Data are mean ± SEM. (d-g, i) Statistical differences between GF and SPF were assessed by Mann-Whitney U-test, but no evaluations were statistically significant. j) Differences in abundance of individual genomes within each database were assessed between groups by the Wald Test, but applying False Discovery Rate correction (α = 0.05) resulted in no differentially abundant genomes. Numerical source data, statistics, exact p values and q values are provided.
Extended Data Fig. 5 |
Extended Data Fig. 5 |. Locked nucleic acid (LNA) bases mediate antagonism of single-stranded RNA ligands of TLR8.
a) HEK293T cells over-expressing human TLR8, UNC93B1 and CD14 were pre-treated with vehicle (DOTAP) or corresponding DNA/LNA oligonucleotides (2.5 μg/mL) for 30 min and then stimulated with TLR8 nucleoside analogue agonist CL075 or TLR8 ORN agonists ssRNA40 or ORN06 (2 μg/mL) for 24 h (n = 5 biological replicates). Two-way ANOVA with Dunnett’s multiple comparison test (statistical significance relative to untreated within each group; **p < 0.0001). b) THP-1 macrophages were pretreated + /− nt-LNA (1 μg/mL) for 45 min and treated with LPS (500 ng/mL), Poly I:C (1 μg/mL), CL075 (2.5 μg/ml), or ssRNA40 at 1 μg/mL (1:1, nt-LNA:ssRNA40) or 0.2 μg/ml (5:1) for 24 h (n = 3 biological replicates). Relative mRNA expression of IL1B, IL6 and TNF were then assessed by qPCR. For each treatment, the relative fold change of each treatment in the presence of nt-LNA was expressed as a percentage of the relative fold change of each treatment without nt-LNA pre-treatment (% inhibition). Two-way ANOVA, Benjamini, Krieger and Yekutieli FDR (Q = 0.05), **q < 0.01. c-d) Primary human CD14 + PBMC differentiated with GM-CSF and IFNγ were pre-treated with 2.5 μg/mL nt-LNA or vehicle (DOTAP) for 30 minutes and then stimulated with or without ssRNA40 (0.5 μg/mL) for 24 h. c) mRNA expression was quantified by qPCR (n = 4 biological replicates) d) Cytokine (IL-6) secretion was quantified by ELISA (n = 4 biological replicates). One-way ANOVA with Dunnett’s multiple comparison test. **p < 0.01. ***p < 0.001, ****p < 0.0001 (e) mRNA expression (n = 4 biological replicates), (f) cytokine secretion (n = 3 biological replicates) and (g) immunoblotting (representative image of three independent experiments) of BMDMs following up to 24 h treatment with IFNγ (100 U/mL) +/− 0.5 mg/ml nLDL in the presence or absence of 2.5 μg/mL nt-LNA. Two-way ANOVA, Benjamini, Krieger and Yekutieli FDR (Q = 0.05), *q < 0.05, **q < 0.01. Data are mean ± SEM. Numerical source data, statistics, exact p values and q values are provided.
Extended Data Fig. 6 |
Extended Data Fig. 6 |. nt-LNA treatment reduces atherosclerosis without altering lipid or lipoprotein metabolism in Apoe−/− mice.
a) Female and male Apoe−/− mice fed a western diet were administered saline (Ctr; n = 4 mice per sex), nt-LNA-A (20 mg/kg; n = 4 mice per sex) or nt-LNA-B (20 mg/kg; n = 4 mice per sex) by intraperitoneal injection once weekly for four weeks. Treatments for each were randomized between cohabitating animals separated by sex. At sacrifice, the aortic sinus was serially sectioned and stained with Oil-Red O to identify atherosclerotic lesions. Scale bar = 500 μm. b) Quantification of lesion area in serial sections and c) sex-normalized, relative lesion area under the curve (n = 8 mice per treatment). d) Plasma of female Apoe−/− mice treated for 4 weeks with saline (Ctr; n = 10) or nt-LNA (n = 10) were fractionated by size-exclusion chromatography and assessed for total cholesterol (TC) e) Plasma protein levels were assessed by immunoblot of individual cages receiving either Saline/Ctr (n = 5 mice) or nt-LNA (n = 5 mice) treatments (representative images of two independent assessments). f) Quantification of independent immunoblots by densitometry (n = 10 mice per treatment) normalized to C3. g) Lesion area (Oil-red O) of matched sections of the aortic root following treatment with saline (Ctr) or nt-LNA for 4 weeks (n = 10 mice per treatment). h) Hepatic mRNA expression determined by qPCR (n = 10 mice per treatment). Data are mean ± SEM. (c) One-way ANOVA, Sidak’s multiple comparison test, *p < 0.05. **p < 0.01. (f-h) Two-way ANOVA with Benjamini, Krieger and Yekutieli FDR (Q = 0.05), *q < 0.05, **q < 0.01,***q < 0.001. Numerical source data, statistics, exact p values and q values are provided.
Extended Data Fig. 7 |
Extended Data Fig. 7 |. nt-LNA treatment promotes atherosclerotic regression in Ldlr−/− mice.
(a) Schematic for regression study design. Male(M) and female(F) Ldlr−/− mice were fed a chow diet (n = 6 mice) or an atherogenic diet (n = 50 mice) for 14 weeks. After 14 weeks, chow-fed mice and a subset of mice from the atherogenic diet group (baseline; n = 7 M/8 F mice). Remaining diet-fed mice were then switched to a chow diet to allow lesion regression (Reg.) and were injected once weekly with saline control (Reg. Ctr; n = 9 M/9 F mice) or Reg. nt-LNA (30 mg/kg; n = 9 M/8 F mice). b) Plasma total cholesterol (TC) or c) triglycerides (TG) following fractionation by SEC; chow (n = 6; 3 M/3 F), baseline (n = 8; 4 M/4 F), Reg. Ctr; (n = 10; 5 M/5 F) and Reg. nt-LNA (n = 10; 5 M/5 F) d) Immunoblots of plasma proteins in Reg. Ctr (n = 10) or Reg. nt-LNA (n = 9) groups. Representative images of two independent experiments are shown. e) Quantification of immunoblots by densitometry. f-g) Lesion area of serial sections of the aortic root in baseline (n = 15 mice; 7 M/8 F), Reg. Ctr(n = 18 mice; 9 M/9 F) or nt-LNA (n = 17; 9 M/8 F) groups. h) Lesion area under the curve (AUC) for both sexes of mice as determined by Oil Red O staining in the aortic root (Baseline: n = 15; Reg. Ctr: n = 18; Reg. nt-LNA; n = 17). One-way ANOVA; Dunnett’s multiple comparison test, **p < 0.01, ***p < 0.001. i) Lesion AUC for mice of each group separated by sex. Two-way ANOVA; Dunnett’s multiple comparison test, **p < 0.01. j-k) Masson’s Trichrome staining and quantification of fibrosis in aortic roots of baseline (n = 7 mice; 3 M/4 F) Reg. Ctr (n = 9 mice; 4 M/5 F) or Reg. nt-LNA (n = 10 mice; 5 M/5 F) groups. l-m) MAC2 (green) immunofluorescence and quantification within aortic roots obtained of at baseline (n = 7 mice; 3 M/4 F), Reg. Ctr (n = 10 mice; 5 M/5 F), or Reg. nt-LNA (n = 10 mice; 5 M/5 F) groups. Twoway ANOVA; Tukey’s multiple comparison test, **p < 0.01, ***p < 0.001. Data are mean ± SEM. Scale bar = 500 μm. Numerical source data, statistics, exact p values and q values are provided.
Extended Data Fig. 8 |
Extended Data Fig. 8 |. Gating strategy of leukocytes from mouse aortas for single-cell RNA sequencing.
Sequential gating fluorescent activated cell sorting for single and live cells, followed by non-red blood cells. Cells were then sorted that were CD45 + but CD3.
Extended Data Fig. 9 |
Extended Data Fig. 9 |. Single-cell RNA sequencing of the atherosclerotic lesion to identify anti-atherosclerotic mechanisms of nt-LNA treatment.
a) Apoe−/− mice fed an atherogenic diet for 4 weeks were injected once weekly with saline control (Ctr; n = 8) or nt-LNA (30 mg/kg; n = 8). b) UMAP projection of unbiased clusters obtained from atherosclerotic lesions. c) Relative contribution of cells from saline (Ctr) and nt-LNA treated mice to each cluster of (b). d) Relative expression (color) and % of cells reaching threshold of detection (size) of transcripts pertaining to T cell and NK cell phenotypes (top) or B-cell phenotypes (bottom) in atherosclerosis for each cluster. Numerical source data, statistics, exact p values and q values are provided.
Fig. 1 |
Fig. 1 |. nLDL induce inflammatory activation in macrophages.
a, Differentially expressed transcripts (mRNA) of THP-1 macrophages treated with 0.5 mg ml−1 nLDL for 24 h identified by RNA-seq (n = 3 biological replicates). FDR (α = 0.05)-adjusted P values after Wald test. log2FC >1.0, adjusted P < 0.05 (P adj). b, Transcription factor network enrichment analysis of nLDL-altered genes. Benjamini–Hochberg multiple testing correction adjusted P values generated based on hypergeometric distribution. Adjusted P < 0.05. c, Differentially expressed transcripts of a within the RelA (NF-κB p65) cluster. d,e, mRNA expression by qPCR (relative quantitative value (RQV)) (d) and secreted cytokine levels by ELISA of selected targets of NF-κB and C/EBPβ following exposure to 0.5 mg ml−1 nLDL for 3, 6 and 24 h relative to cells receiving no treatment for 24 h (control (Ctr)) (n = 3 biological replicates) (e). f, Immunoblots of selected proteins of THP-1 cells exposed to varied doses of nLDL for 24 h (n = 3 biological replicates). g, mRNA expression of primary human CD14+ cells from peripheral blood either freshly isolated or differentiated with GM-CSF and IFNγ, or M-CSF, IL-4 and IL-13, and treated with 0.5 mg mL−1 nLDL for 24 h (n = 3 healthy human donors). hj, mRNA expression (h and j) and cytokine secretion (i and k) of primary human CD14+ PBMC differentiated with GM-CSF and IFNγ following treatment with nLDL for indicated time (h and i) or dose (j and k) (n = 4 biological replicates). Data are mean ± s.e.m. In d, e, h and j, a one-way ANOVA, Benjamini, Krieger and Yekutieli FDR (q = 0.05) for experimental groups relative to Ctr. *q < 0.05, **q < 0.01. In g, a two-way ANOVA or Sidak’s multiple comparison test was performed, *P < 0.05, **P < 0.01. In i and k, one-way ANOVA and Dunnett’s multiple comparison test on experimental groups relative to Ctr group were carried out, *P < 0.05, **P < 0.01. Numerical source data, statistics, exact P values and q values are provided.
Fig. 2 |
Fig. 2 |. nLDL activates NF-κB through TLR8 in macrophages.
a,b, mRNA expression by qPCR (a) and IL-6 secretion (b) of primary human CD14+ macrophages differentiated with GM-CSF and IFNγ that were pre-treated with vehicle (Veh; DMSO) or C29 for 30 min and then incubated with nLDL or without (Ctr) for 24 h (n = 4 biological replicates). c, TNF-α secretion of THP-1 macrophages pre-treated with vehicle (Veh; DMSO), bafilomycin A1 (Baf-A1; 500 μM) or EGTA-AM for 45 min, followed by exposure to LPS (100 ng ml−1), ssRNA40 (1 μg ml−1), nLDL (0.5 mg ml−1) or untreated (Ctr) for 6 h (n = 3 biological replicates). d, Normalized NF-κB-driven luciferase activity of HEK293T cells over expressing an empty vector, individual or tandem human TLRs following treatments with vehicle (Ctr), cognate TLR ligand(s) or nLDL (0.5 mg ml−1) (n = 3 biological replicates). e, Immunoblots of HEK293T cells transfected with the indicated plasmids relative to endogenous expression in primary human macrophages or THP-1 macrophages (representative blot of three independent experiments). TLR8-O denotes full-length protein. TLR8-X represents proteolytically processed (active) peptides. f,g, mRNA expression (f) (n = 4 biological replicates) and cytokine secretion (g) (n = 3 biological replicates) of THP-1 macrophages electroporated with scrambled (siScr) or TLR8-targeted (siTLR8) siRNAs or without siRNA (Ctr) following 24 h of nLDL exposure (0.5 mg ml−1). h,i, mRNA expression (h) and cytokine secretion (i) of THP-1 macrophages pre-treated with CU-CPT9a microparticles (30 min) followed by 24 h of nLDL exposure (n = 3 biological replicates). Data are mean ± s.e.m. In a, b and i, two-way ANOVA and Sidak’s multiple comparisons test were performed relative to Ctr, *P < 0.05, **P < 0.01. In c and fh, two-way ANOVA, Benjamini, Krieger and Yekutieli FDR were carried out (q = 0.05), *q < 0.05, **q < 0.01, ***q < 0.001. Numerical source data, statistics, exact P values and q values are provided.
Fig. 3 |
Fig. 3 |. LDL are enriched with msRNA.
a, Total RNA were isolated from DGUC-LDL obtained from 20 healthy subjects and sRNA were quantified by sRNA-seq. Relative proportion of sRNA-seq reads identified as host, non-host, unknown or too short for conservative mapping with TIGER. b, Host sRNA abundance quantified as RPM (small nucleolar RNA-derived RNA (snoDR); y-RNA-derived RNA (yDR); small nuclear RNA-derived RNA (snDR)). c, Alignment of non-host sRNAs to the SILVA rRNA database and grouped by taxa and quantified as RPM. d, Voronoi plot representing relative abundance of sRNAs (segment size; each segment represents a single subject) linked to bacterial phyla (colour) identified by mapping to a database of bacterial genomes linked to the human microbiome. e, total RNA and sRNA isolated from human macrophages (THP-1) and bacteria (E. coli), as well as total RNA isolated from selected nLDL subjects of ad and ORN06 (20-mer ORN) were assessed by a Bioanalyzer (PicoChip) (representative image of three independent experiments). f, mRNA expression of THP-1 macrophages transfected with 1 μg ml−1 of isolated human sRNA, bacterial sRNA or ORN06 for 24 h (n = 3 biological replicates). g, total RNA of nLDL and rLDL assessed by a Bioanalyzer (PicoChip) (representative image of four independent preparations). h, Quantification of representative miRNA across independent preparations of rLDL and matched nLDL, or buffer negative control (n = 4 independent preparations). i, Cellular cholesterol levels in THP-1 macrophages following treatment with nLDL and rLDL or without treatment (UNT) for 24 h (n = 4 biological replicates). j,k, mRNA expression (j) and cytokine secretion (k) of THP-1 cells after treatment with 0.5 mg ml−1 nLDL or rLDL for 24 h (n = 4 biological replicates). Data are mean ± s.e.m. In f, h and jk, one-way ANOVA and Benjamini, Krieger and Yekutieli FDR were performed (q = 0.05), *q < 0.05, **q < 0.01, ***q < 0.001, ****q < 0.0001. In i, one-way ANOVA with Dunnett’s multiple comparison test were carried out, *P < 0.05. Numerical source data, statistics, exact P values and q values are provided.
Fig. 4 |
Fig. 4 |. nt-LNAs inhibit TLR8.
a, Normalized NF-κB-driven luciferase activity of HEK293T cells over expressing human TLR8 and treated with agonists CL075 (2.5 μg ml−1), ssRNA40 (2 μg ml−1) and ORN06 (2 μg ml−1), in the presence or absence (Veh = DOTAP) of 2 μg ml−1 indicated LNA-oligonucleotide (n = 4 biological replicates). b, Dose–response curves for ORN06-induced luciferase activity in HEK293T cells over expressing human TLR8 co-treated with vehicle (white), nt-LNA-A 0.5 μg ml−1 (blue) or nt-LNA-A 2.5 μg ml−1 (purple) (n = 4 biological replicates). c, NF-κB-driven luciferase activity of HEK293T cells over expressing mouse or human TLR8 treated with nLDL (2.5 mg ml−1) with (purple) or without (white) nt-LNA-A (2.5 μg ml−1) (n = 4 biological replicates). d,e, mRNA expression (d) and cytokine secretion (e) of primary human CD14+ PBMC differentiated with GM-CSF and IFNγ following 24 h treatment with or without 0.5 mg ml−1 nLDL in the presence or absence of 2.5 μg ml−1 nt-LNA (n = 4 biological replicates). fh, mRNA expression (f) (n = 4 biological replicates), cytokine secretion (g) (n = 4 biological replicates) and immunoblotting (h) of THP-1 macrophages following 24 h treatment with or without 0.5 mg ml−1 nLDL in the presence or absence of 2.5 μg ml−1 nt-LNA (n = 3 biological replicates). Data are mean ± s.e.m. Two-way ANOVA (a and f) or one-way ANOVA and Dunnett’s multiple comparison test (d, e and g), *P < 0.05, **P < 0.01, ***P < 0.001. Non-linear regression with extra sum-of-squares F test (two-sided) (b). Two-way ANOVA with Sidak’s multiple comparison test (c), ***P < 0.001. Numerical source data, statistics, exact P values and q values are provided.
Fig. 5 |
Fig. 5 |. nt-LNAs reduce atherosclerosis in mice.
a, Schematic of progression study design. Apoe−/− mice, fed a Western diet for up to 10 weeks, were injected once weekly with saline Ctr or nt-LNA (30 mg kg−1, intraperitoneal (i.p.)). bj, early lesions (4 weeks): ISH using anti-sense probes against nt-LNA in the early lesion (representative images of three independent hybridization experiments) (b); lesion AUC, as determined by ORO staining of early lesions (n = 10 mice per group) (c and d); quantification of F4/80+ macrophage content in early lesions by IHC (n = 10 mice per group; normalized to lesion area) (e and f); quantification of Mac2+ macrophage content in early lesions by IF microscopy (n = 8 mice per group; normalized to lesion area) (g and h); and quantification of early lesion fibrosis by Masson’s Trichrome staining (n = 10 mice per group) (i and j). kv, Advanced lesions (10 weeks of Western diet feeding), weekly injections of saline Ctr or nt-LNA (30 mg kg−1): en face staining (Sudan IV) and quantification in the arch and descending aorta (Ctr: n = 10 mice; nt-LNA: n = 11 mice) (k and l); H&E staining of advanced lesions in the aortic sinus with areas of necrosis indicated with a dotted line (m); quantification of lesion AUC (H&E) and necrotic core AUC throughout the aortic sinus (Ctr: n = 10 mice; nt-LNA: n = 11 mice) (np); lipid deposition in the aortic sinus visualized by ORO and normalized by total lesion area (Ctr: n = 10 mice; nt-LNA: n = 11 mice) (q and r); quantification of Mac2+ macrophage content in advanced lesions by IF microscopy (Ctr: n = 10 mice; nt-LNA: n = 11 mice) (s and t); and quantification of total collagen content in advanced lesions by Picrosirius Red staining (Ctr: n = 10 mice; nt-LNA: n = 11 mice) (u and v). Scale bar, 500 μm. Data are mean ± s.e.m. In d, f, h, j, l, o, p, r, t and v, Mann–Whitney U test (two-sided) was performed; in n, two-way ANOVA with Sidak’s multiple comparison test were carried out. *P < 0.05, **P < 0.01. Numerical source data, statistics, exact P values and q values are provided.
Fig. 6 |
Fig. 6 |. nt-LNA treatments re-organize lesion cell types.
a, Flow chart depicting (1) the digestion of aortas dissected from Apoe−/− mice fed a Western diet for 4 weeks and treated weekly with saline (Ctr: n = 8 mice) or nt-LNA (30 mg kg week−1; n = 8 mice) and (2) single-cell suspensions from individual mice pooled before fluorescence-activated cell sorting to isolate a CD45+ and CD3 population of immune cells used for (3) 10× chromium RNA single-cell partitioning and barcoding for (4) downstream scRNA-seq. b, Uniform manifold approximation and projection (UMAP) of individual cellular transcriptomes obtained from Ctr- and nt-LNA-treated mice. c, Absolute (histogram) and relative (pie) quantification of immune cell types obtained from b. d, Differential expression analysis between myeloid cells obtained from each treatment group. FDR (α = 0.05) adjusted P values after genewise negative binomial generalized linear models with quasi-likelihood tests. log2FC >0.5, adjusted P < 0.05). e, Violin plots of selected transcripts found to be differentially altered in d. f, Voronoi plots of Gene Ontology analysis (left) and detailed expansion of key segments of the immune system process (right). FDR (α = 0.05) adjusted P values calculated on the basis of EASE score, a modified Fisher’s exact test (one-sided).
Fig. 7 |
Fig. 7 |. nt-LNA treatments reduce inflammatory macrophages in mouse lesions.
a,b, Uniform manifold approximation and projection (UMAP) projections of myeloid cells identified by scRNA-seq analysis following selection and re-clustering analysis. Visualized as unbiased clusters (a) or by source (b). c, Relative expression (colour) and percentage of cells reaching the threshold of detection (size) for selected transcripts enriched for each cluster of a. d, Relative contribution of each treatment to clusters obtained from a. e, Proposed mechanism for LDL-msRNA in atherosclerosis-associated inflammation: (1) nLDL with associated msRNA cargo is internalized and catabolized within the endosomal network; (2) released msRNA cargo during catabolism is recognized by endosomal TLR8, which can be outcompeted by chemically modified oligonucleotides (for example, nt-LNA); (3) activation of TLR8 promotes translocation of NF-κB to the nucleus and upregulation of target genes (for example, TNF, IL6 and IL1B); and (4) release of cytokines that initiate an innate immune response and (5) sustained LDL-msRNA-driven inflammation promotes atherosclerotic plaque progression and impedes resolution.

Comment in

References

    1. Danesh J, Collins R, Appleby P & Peto R. Association of fibrinogen, C-reactive protein, albumin, or leukocyte count with coronary heart disease: meta-analyses of prospective studies. JAMA 279, 1477–1482 (1998). - PubMed
    1. Ridker PM, Rifai N, Rose L, Buring JE & Cook NR Comparison of C-reactive protein and low-density lipoprotein cholesterol levels in the prediction of first cardiovascular events. N. Engl. J. Med 347, 1557–1565 (2002). - PubMed
    1. Sabatine MS et al. Evolocumab and clinical outcomes in patients with cardiovascular disease. N. Engl. J. Med 376, 1713–1722 (2017). - PubMed
    1. Ridker PM et al. Antiinflammatory therapy with canakinumab for atherosclerotic disease. N. Engl. J. Med 377, 1119–1131 (2017). - PubMed
    1. Moore KJ & Tabas I. Macrophages in the pathogenesis of atherosclerosis. Cell 145, 341–355 (2011). - PMC - PubMed

Publication types