Review
. 2022 Dec 2;14(6):1281-1301.
doi: 10.1007/s12551-022-01013-w. eCollection 2022 Dec.

Electron microscopy holdings of the Protein Data Bank: the impact of the resolution revolution, new validation tools, and implications for the future

Affiliations
Review

Electron microscopy holdings of the Protein Data Bank: the impact of the resolution revolution, new validation tools, and implications for the future

Stephen K Burley et al. Biophys Rev. .

Abstract

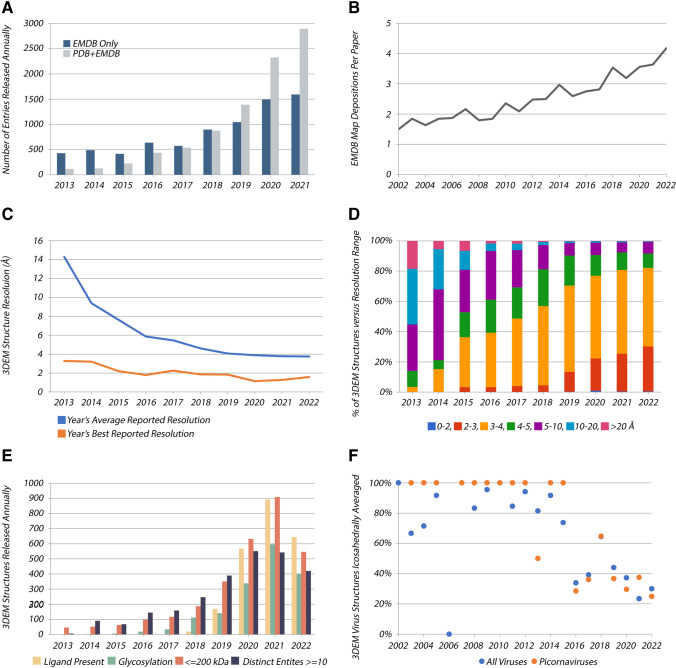
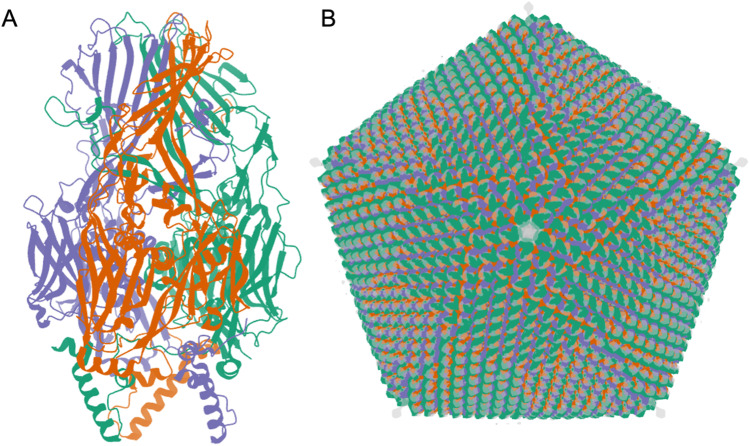
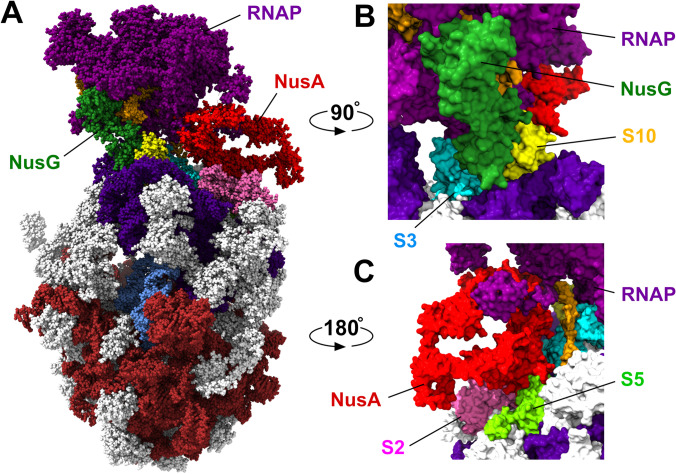
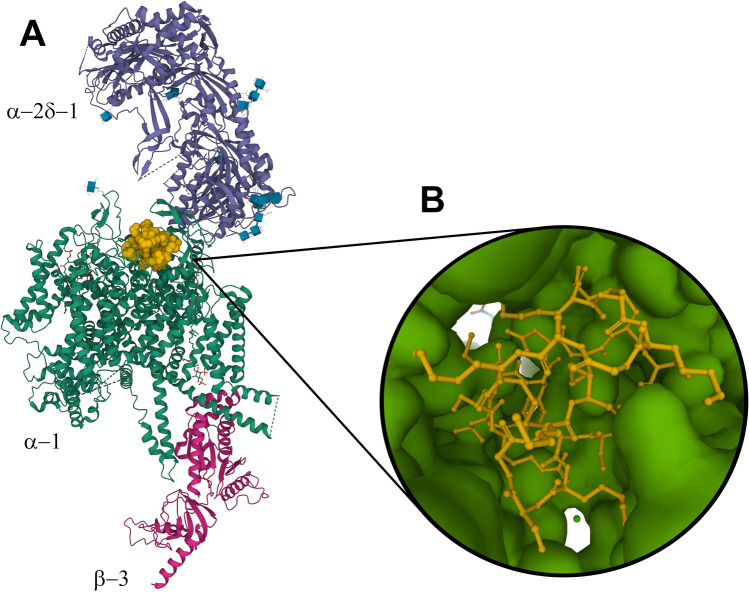
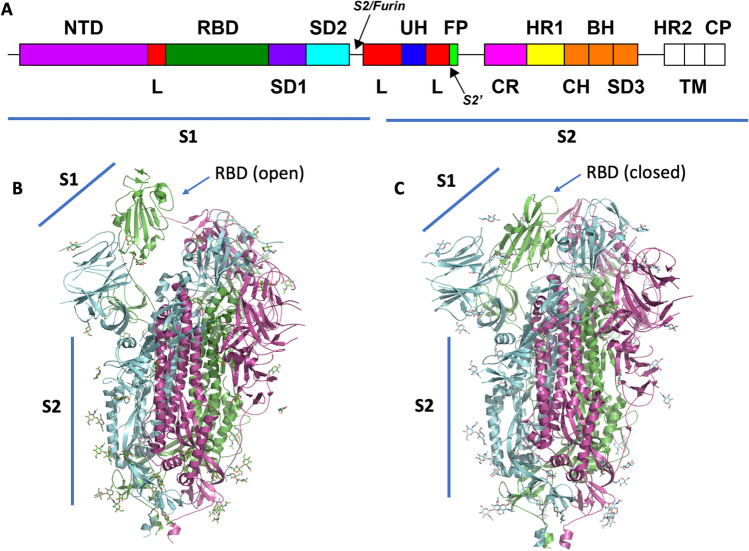
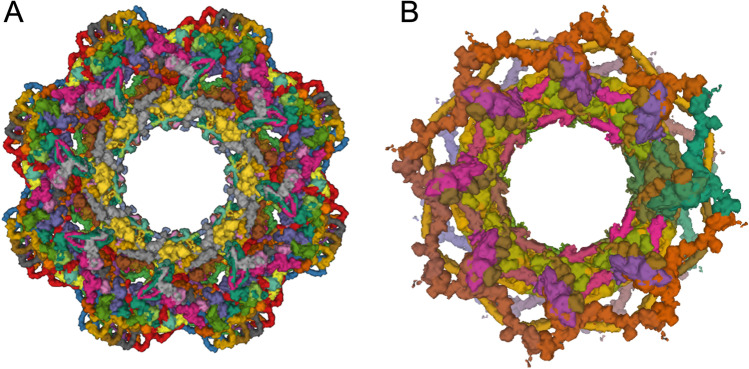
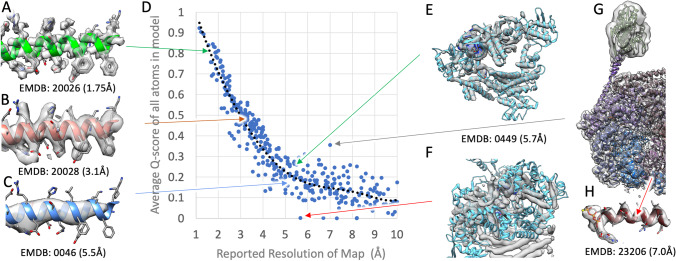
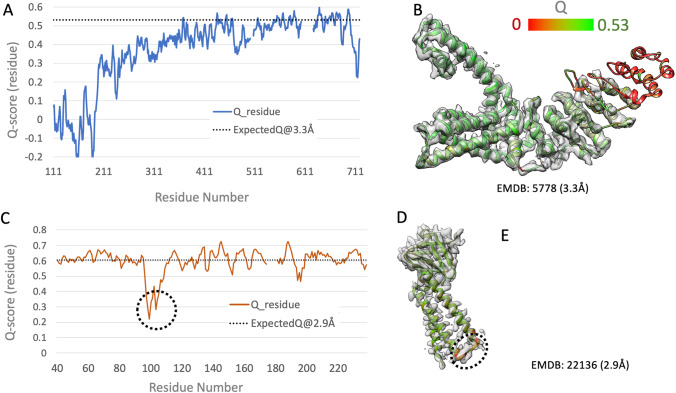
As a discipline, structural biology has been transformed by the three-dimensional electron microscopy (3DEM) "Resolution Revolution" made possible by convergence of robust cryo-preservation of vitrified biological materials, sample handling systems, and measurement stages operating a liquid nitrogen temperature, improvements in electron optics that preserve phase information at the atomic level, direct electron detectors (DEDs), high-speed computing with graphics processing units, and rapid advances in data acquisition and processing software. 3DEM structure information (atomic coordinates and related metadata) are archived in the open-access Protein Data Bank (PDB), which currently holds more than 11,000 3DEM structures of proteins and nucleic acids, and their complexes with one another and small-molecule ligands (~ 6% of the archive). Underlying experimental data (3DEM density maps and related metadata) are stored in the Electron Microscopy Data Bank (EMDB), which currently holds more than 21,000 3DEM density maps. After describing the history of the PDB and the Worldwide Protein Data Bank (wwPDB) partnership, which jointly manages both the PDB and EMDB archives, this review examines the origins of the resolution revolution and analyzes its impact on structural biology viewed through the lens of PDB holdings. Six areas of focus exemplifying the impact of 3DEM across the biosciences are discussed in detail (icosahedral viruses, ribosomes, integral membrane proteins, SARS-CoV-2 spike proteins, cryogenic electron tomography, and integrative structure determination combining 3DEM with complementary biophysical measurement techniques), followed by a review of 3DEM structure validation by the wwPDB that underscores the importance of community engagement.

Keywords: Cryo-electron microscopy; Cryo-electron tomography; EMDB; Electron Microscopy Data Bank; Electron crystallography; Electron microscopy; Electron microscopy data resource; Icosahedral viruses; Integral membrane proteins; Integrative or hybrid methods; Micro-electron diffraction; PDB; PDB-Dev; Protein Data Bank; Q-score; Resolution Revolution; Ribosomes; SARS-CoV-2 spike proteins; Structure validation; Sub-tomogram averaging.


Conflict of interest statement

Conflict of interestThe authors declare no competing interests.

Figures

Fig. 1
Fig. 1
Selected annual metrics for 3DEM structures in PDB and density maps in EMDB. A 3DEM structures (PDB and EMDB) and density maps (EMDB only) versus time. B Average number of 3DEM density map depositions reported per primary publication versus time. C Average reported resolution (blue) and best reported resolution (orange) for 3DEM structures versus time. D Percentage of 3DEM structures versus resolution range versus time. E PDB 3DEM structures wherein ligands are present; glycosylation is evident; size of the sample macromolecule or macromolecular complex is 200,000 Da; and the number of distinct molecular entities comprising the sample is 10. F Percentage of 3DEM virus structure depositions to PDB relying on icosahedral averaging versus time
Fig. 2
Fig. 2
Faustovirus (Klose et al. 2016). A. 3DEM atomic coordinates in the PDB (entry PDB ID 5j7v) consist of the capsid protein trimer illustrated in ribbon representation. B Atomic coordinates for the full icosahedral capsid are generated by applying 2760 transformation matrices to the trimer atomic coordinates. The superimposed 15 Å resolution 3DEM density map (entry EMD-8144, in semi-transparent grey) reveals additional spike-like features for which atomic coordinates are not available extending from each fivefold vertex. Images generated using Mol* (Sehnal et al. 2021)
Fig. 3
Fig. 3
A E. coli transcription-translation complex (Wang et al. 2020) TTC-B2 (PDB ID 6x 7f), color coding: RNAP-purple, DNA-orange; ribosomal RNAs: large subunit-brown, small subunit-indigo; ribosomal proteins-grey (also see below); tRNA-blue; and transcription elongation factors NusG-dark green and NusA-red. The mRNA transcript is not visible in this representation. B Interaction of NusG (dark green) with RNAP (purple) and ribosomal proteins S3 (cyan) and S10 (yellow). C Interaction of NusA (red) with ribosomal proteins S2 (pink) and S5 (light green). Images generated using ChimeraX (Pettersen et al. 2021)
Fig. 4
Fig. 4
A Mol* ribbon representation of the 3DEM structure of the human Cav2.2 bound to ziconotide (PDB ID 7mix (Gao et al. 2021). Color coding: ziconotide-orange (space-filling representation); α-2 δ-1 subunit-purple; α-1 subunit-green; β-3 subunit-red. Glycosyl groups covalently bound to the α-2 δ-1 and α-1 subunits are displayed as blue cubes with atomic stick figures using the GlycanBuilder representation described in (Shao et al. 2021). B Rotated Mol* closeup representation of the interaction of ziconotide (ball-and-stick) with α-1 (surface)
Fig. 5
Fig. 5
A Schematic view of SARS-CoV-2 spike protein sequence showing arrangement of polypeptide chain segments S1 and S2 and various domains. Proteolytic cleavage sites are indicated with arrows. B Mol* ribbon representation of the one-up-two-down RBD conformation of the spike protein (PDB ID 6vsb (Wrapp et al. 2020)). C Mol* ribbon representation of the all-down RBD conformation observed in PDB ID 6vxx (Walls et al. 2020). Individual trimers are color-coded magenta, green, and cyan, respectively. Covalently bound glycosyl groups are depicted as atomic stick figures
Fig. 6
Fig. 6
A Cryo-ET structure of the eightfold symmetric human NPC in its constricted state determined at 12 Å resolution (PDB ID 7r5k (Mosalaganti et al. 2022)). B Integrative structure of yeast NPC with eight spokes (PDBDEV_00000012) determined using the Integrative Modeling Platform (Kim et al. 2018). Images generated using Mol*
Fig. 7
Fig. 7
Extracted portions of 3DEM density maps and corresponding atomic models shown in Panels AC, with arrows indicating their overall Q-score values in the plot of Q-score versus reported density map resolution plot (Panel D). The plot was based on 374 EMDB density maps released between 2018 and 2021, randomly chosen such that resolution is evenly distributed between ~ 1 and ~ 10 Å. Panels E and F show for PDB ID 6nme/EMD-0449 (H. Zhang et al. 2019) that even at a lower resolution (~ 5.5 Å), an atypical Q-score value near zero can indicate an improper global fit of the atomic coordinates to the 3DEM density map. Panels G and H show PDB ID 7l6n/EMD-23206 (Yin et al. 2021) for which the reported resolution is ~ 7.0 Å. Actual resolvability is higher as indicated by the Q-score of ~ 0.36 (versus the value of ~ 0.16 expected at the reported resolution)
Fig. 8
Fig. 8
Per-residue Q-scores can be used to assess resolvability (panels A and B) and identify opportunities to improve atomic coordinate model-to-map fit (panels CE). Panels A and C show per-residue Q-scores versus residue number for PDB ID 3j5p/EMD-5778 (resolution 3.3 Å (Liao et al. 2013)) and PDB ID 6xdc/EMD-22136 (resolution 2.9 Å (Kern et al. 2021)), respectively. Average per-residue Q-score for reported resolution of the 3DEM density map resolution is shown as a horizontal dotted line, based on the dotted line fit to overall Q-scores versus reported density map resolution (Fig. 7D). Panels A and B illustrate how per-residue Q-scores falling below expected average values can be used to identify segments of the polypeptide chain that are not well resolved (given the reported density map resolution). Panels CE illustrate how per-residue Q-scores falling below expected average values can be used to identify segments of the polypeptide chain wherein the atomic coordinate model-to-map fit is not consistent

References

    1. Abbott S, Iudin A, Korir PK, Somasundharam S, Patwardhan A. EMDB Web Resources. Curr Protoc Bioinformatics. 2018;61(1):5.10.1–5.10.12. doi: 10.1002/cpbi.48. - DOI - PMC - PubMed
    1. Afonine PV, Klaholz BP, Moriarty NW, Poon BK, Sobolev OV, Terwilliger TC, et al. New tools for the analysis and validation of cryo-EM maps and atomic models. Acta Crystallogr D Struct Biol. 2018;74(Pt 9):814–840. doi: 10.1107/S2059798318009324. - DOI - PMC - PubMed
    1. Akey CW, Singh D, Ouch C, Echeverria I, Nudelman I, Varberg JM, et al. Comprehensive structure and functional adaptations of the yeast nuclear pore complex. Cell. 2022;185(2):361–378 e25. doi: 10.1016/j.cell.2021.12.015. - DOI - PMC - PubMed
    1. Allegretti M, Zimmerli CE, Rantos V, Wilfling F, Ronchi P, Fung HKH, et al. In-cell architecture of the nuclear pore and snapshots of its turnover. Nature. 2020;586(7831):796–800. doi: 10.1038/s41586-020-2670-5. - DOI - PubMed
    1. Armstrong DR, Berrisford JM, Conroy MJ, Gutmanas A, Anyango S, Choudhary P, et al. PDBe: improved findability of macromolecular structure data in the PDB. Nucleic Acids Res. 2020;48(D1):D335–D343. doi: 10.1093/nar/gkz990. - DOI - PMC - PubMed