In Search of Biomarkers to Guide Interventions in Autism Spectrum Disorder: A Systematic Review
- PMID: 36475375
- PMCID: PMC10123775
- DOI: 10.1176/appi.ajp.21100992
In Search of Biomarkers to Guide Interventions in Autism Spectrum Disorder: A Systematic Review
Abstract
Objective: The aim of this study was to catalog and evaluate response biomarkers correlated with autism spectrum disorder (ASD) symptoms to improve clinical trials.
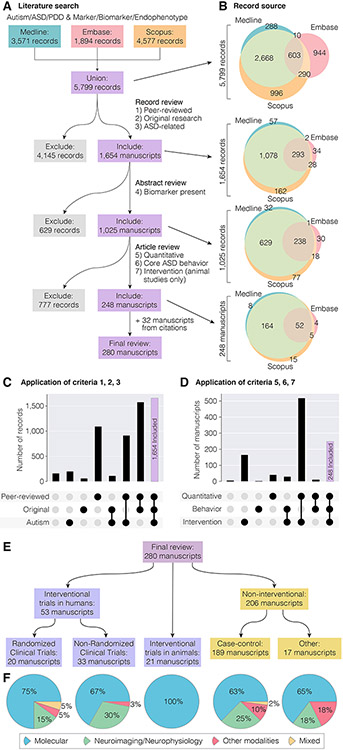
Methods: A systematic review of MEDLINE, Embase, and Scopus was conducted in April 2020. Seven criteria were applied to focus on original research that includes quantifiable response biomarkers measured alongside ASD symptoms. Interventional studies or human studies that assessed the correlation between biomarkers and ASD-related behavioral measures were included.
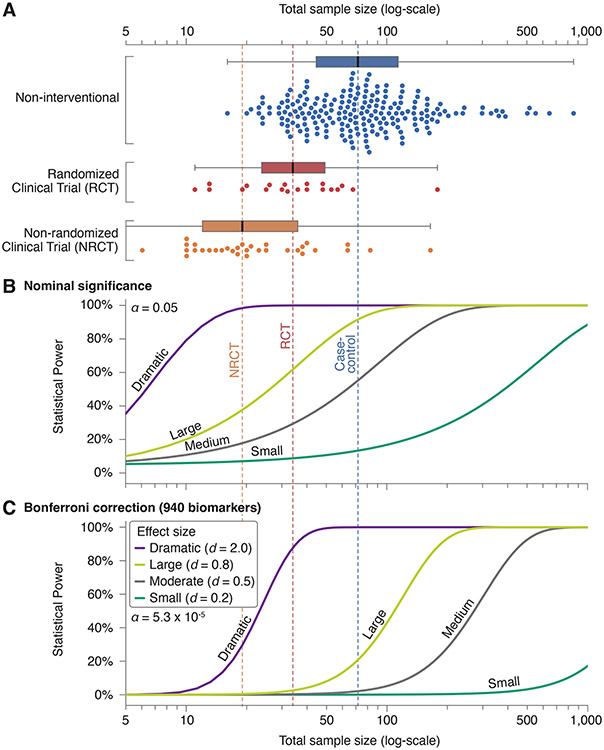
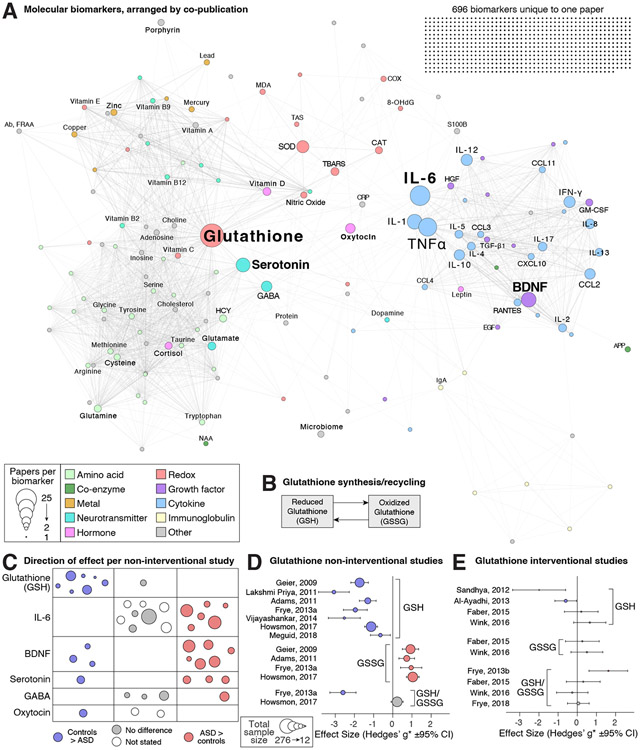
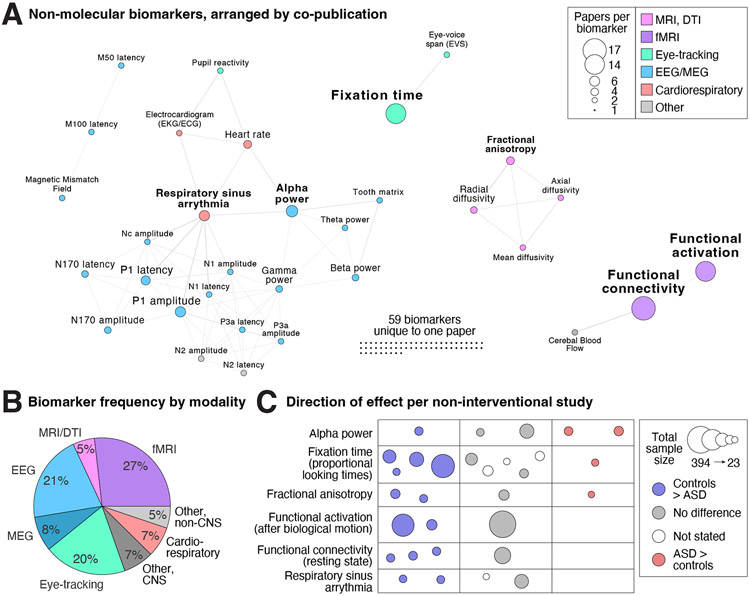
Results: A total of 5,799 independent records yielded 280 articles for review that reported on 940 biomarkers, 755 of which were unique to a single publication. Molecular biomarkers were the most frequently assayed, including cytokines, growth factors, measures of oxidative stress, neurotransmitters, and hormones, followed by neurophysiology (e.g., EEG and eye tracking), neuroimaging (e.g., functional MRI), and other physiological measures. Studies were highly heterogeneous, including in phenotypes, demographic characteristics, tissues assayed, and methods for biomarker detection. With a median total sample size of 64, almost all of the reviewed studies were only powered to identify biomarkers with large effect sizes. Reporting of individual-level values and summary statistics was inconsistent, hampering mega- and meta-analysis. Biomarkers assayed in multiple studies yielded mostly inconsistent results, revealing a "replication crisis."
Conclusions: There is currently no response biomarker with sufficient evidence to inform ASD clinical trials. This review highlights methodological imperatives for ASD biomarker research necessary to make definitive progress: consistent experimental design, correction for multiple comparisons, formal replication, sharing of sample-level data, and preregistration of study designs. Systematic "big data" analyses of multiple potential biomarkers could accelerate discovery.
Keywords: Autism Spectrum Disorder; Biological Markers; Clinical Drug Studies; Clinical Trials; Endophenotypes; Pharmacodynamic Biomarkers; Response Biomarkers; Symptom Severity; Translational Research.
Conflict of interest statement
Conflicts of Interest
MP has served in advisory or consultancy role for Exeltis and Servier and she is involved in clinical trials promoted by Servier and for F. Hoffmann La Roche Ltd. ASJC has served in an advisory or consultancy role for F. Hoffmann La Roche Ltd and she is involved as consultant in clinical trials conducted by Servier. AA, EU and MB have nothing to declare. LLC has received consulting income from Neuronetics, AffectNeuro, Neurolief, Janssen, Sage Therapeutics, Sunovion, and Otsuka. She has research support from Neuronetics, AffectNeuro, Janssen, and Nexstim. NVK has served as a consultant for Neurocrine Biosicences, Inc. WMM is a member of the American Psychiatric Association (APA) Council on Research representing ECT and Neuromodulation Therapies. He is compensated as the chair of the DSMB for the NIA multicenter study. He is on the Board of Skyland Trail and 3Keys. He is a paid consultant for Signant Health and Sage Therapeutics. He has received past funding from the Stanley Foundation, Soterix, Neuronetics, NeoSync and Cervel Neurotherapeutics. He has endowed chair funded by the JB Fuqua Foundation. He is an employee of Emory University School of Medicine. CBN has served as a consultant for ANeuroTech (division of Anima BV), Signant Health, Sunovion Pharmaceuticals, Inc., Janssen Research & Development LLC, Magstim, Inc., Navitor Pharmaceuticals, Inc., Intra-Cellular Therapies, Inc., EMA Wellness, Acadia Pharmaceuticals, Axsome, Sage, BioXcel Therapeutics, Silo Pharma, XW Pharma, Neuritek, Engrail Therapeutics, Corcept Therapeutics Pharmaceuticals Company. He is a stockholder of Xhale, Seattle Genetics, Antares, BI Gen Holdings, Inc., Corcept Therapeutics Pharmaceuticals Company, EMA Wellness. He serves on the Scientific Advisory Boards of ANeuroTech (division of Anima BV), Brain and Behavior Research Foundation (BBRF), Anxiety and Depression Association of America (ADAA), Skyland Trail, Signant Health, Laureate Institute for Brain Research (LIBR), Inc., Magnolia CNS, Heading Health. He serves on the Board of Directors for Gratitude America, ADAA, Xhale Smart, Inc. He holds patents for “Method and devices for transdermal delivery of lithium” (US 6,375,990B1) and “Method of assessing antidepressant drug therapy via transport inhibition of monoamine neurotransmitters by ex vivo assay” (US 7,148,027B2). CIR has served as a consultant for Epiodyne, received research grant support from Biohaven Pharmaceuticals, and a stipend from APA Publishing for her role as Deputy Editor at The American Journal of Psychiatry. ASW has served as a consultant for Livanova and Dandelion Science. He receives device donations for Medtronic. He has both granted and pending patents related to subject matter discussed in the article. SJS receives research funding from BioMarin Pharmaceutical Inc.
Figures
References
-
- Association AP. Diagnostic and statistical manual of mental disorders, 5th Edition (DSM-V): American Psychiatric Publishing, Washington, DC; 2013.
-
- Group F-NBW. BEST (Biomarkers, EndpointS, and other Tools) resource. 2016. - PubMed