. 2022 Dec 20;94(50):17370-17378.
doi: 10.1021/acs.analchem.2c01270. Epub 2022 Dec 7.

An Untargeted Metabolomics Workflow that Scales to Thousands of Samples for Population-Based Studies

Affiliations

An Untargeted Metabolomics Workflow that Scales to Thousands of Samples for Population-Based Studies

Ethan Stancliffe et al. Anal Chem. .

Abstract

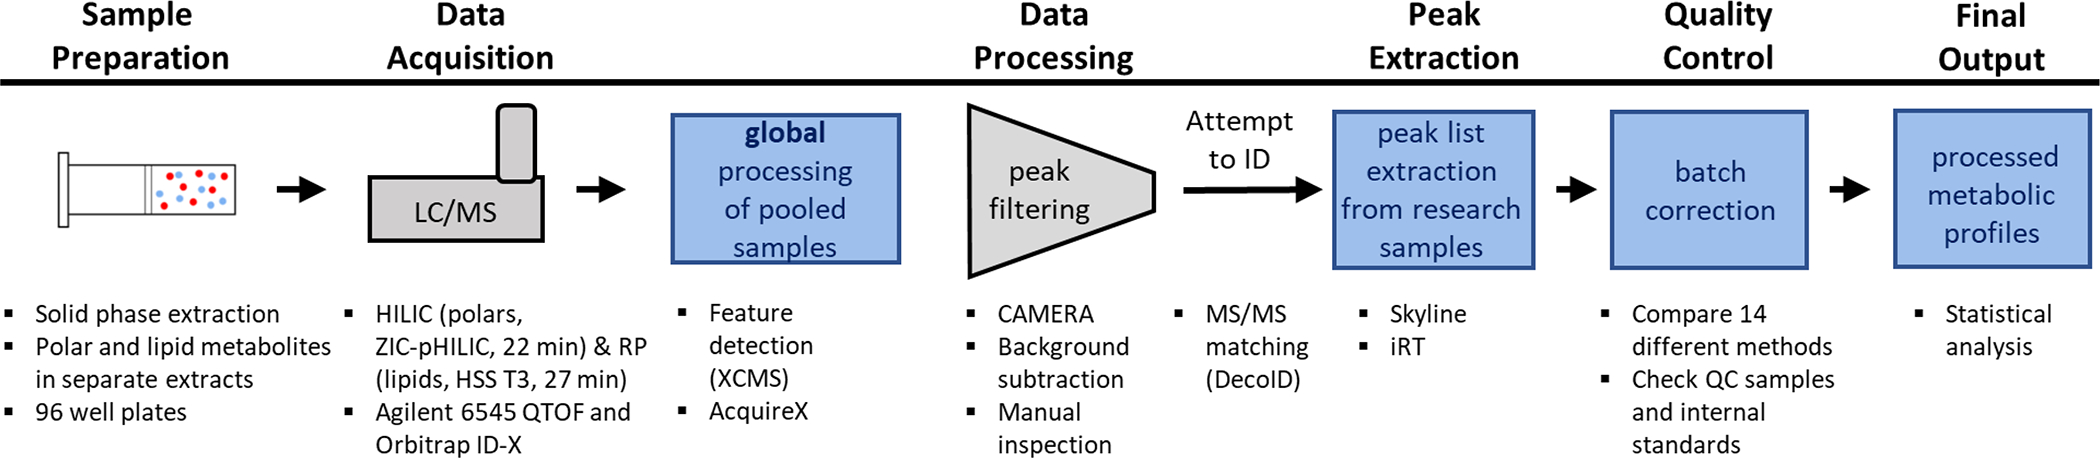
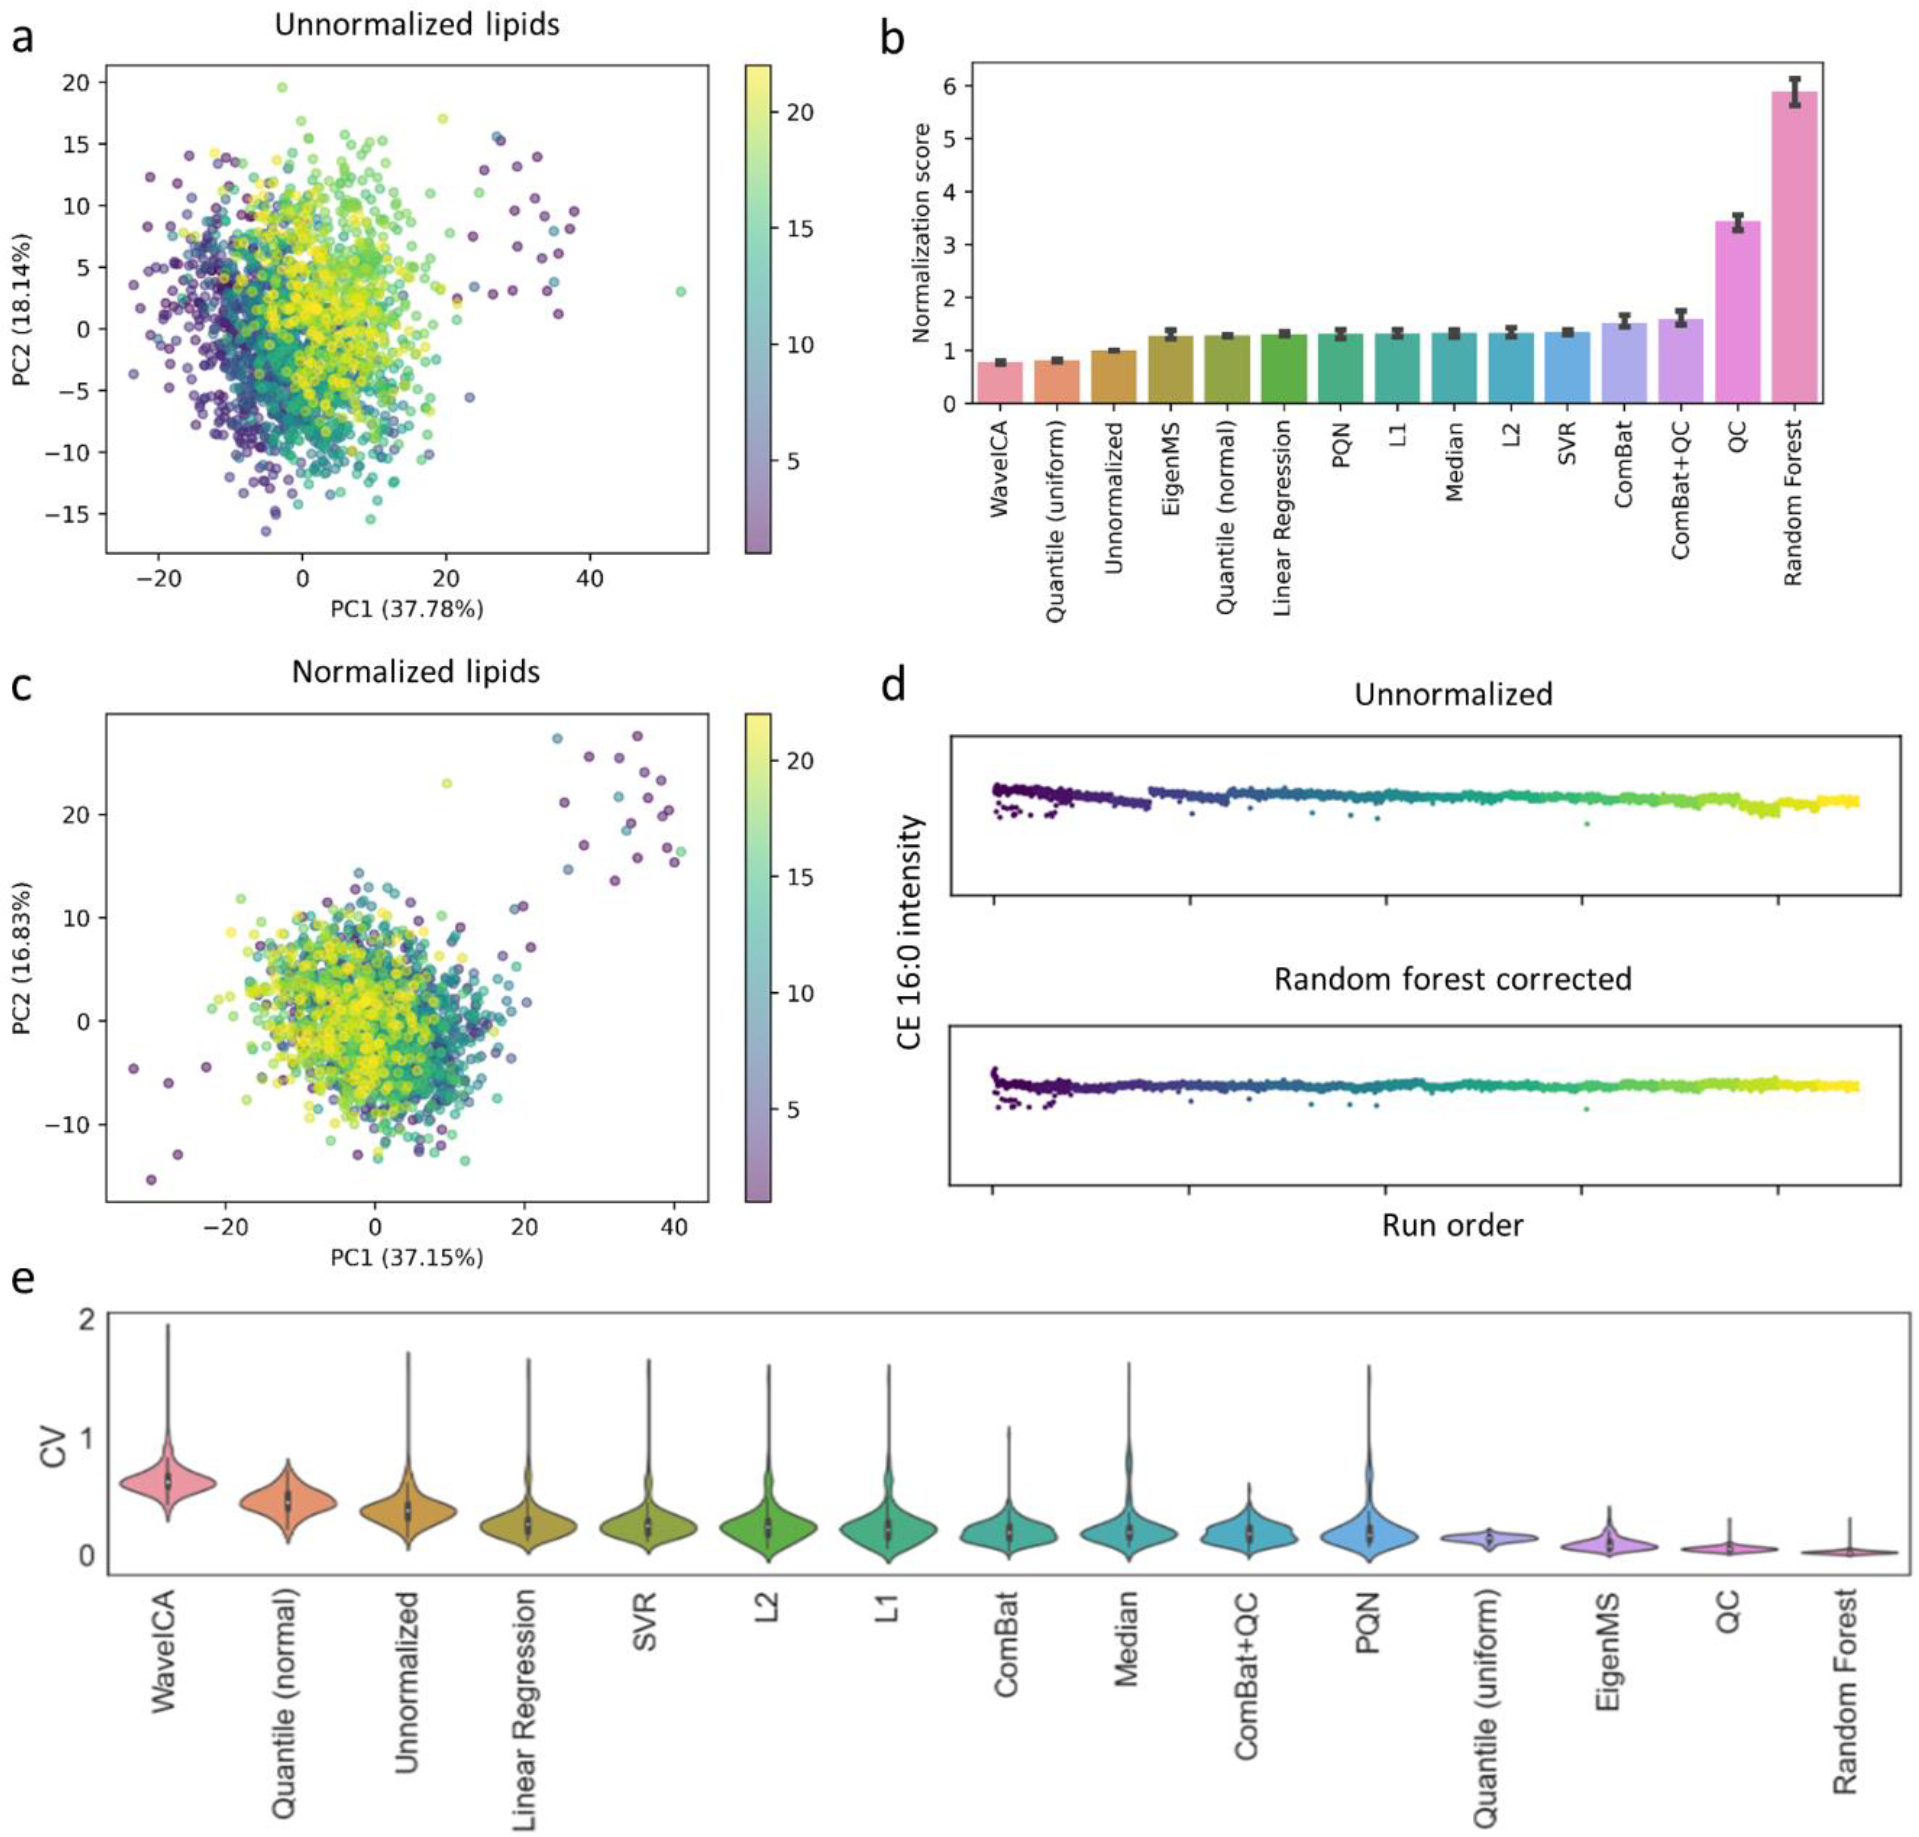
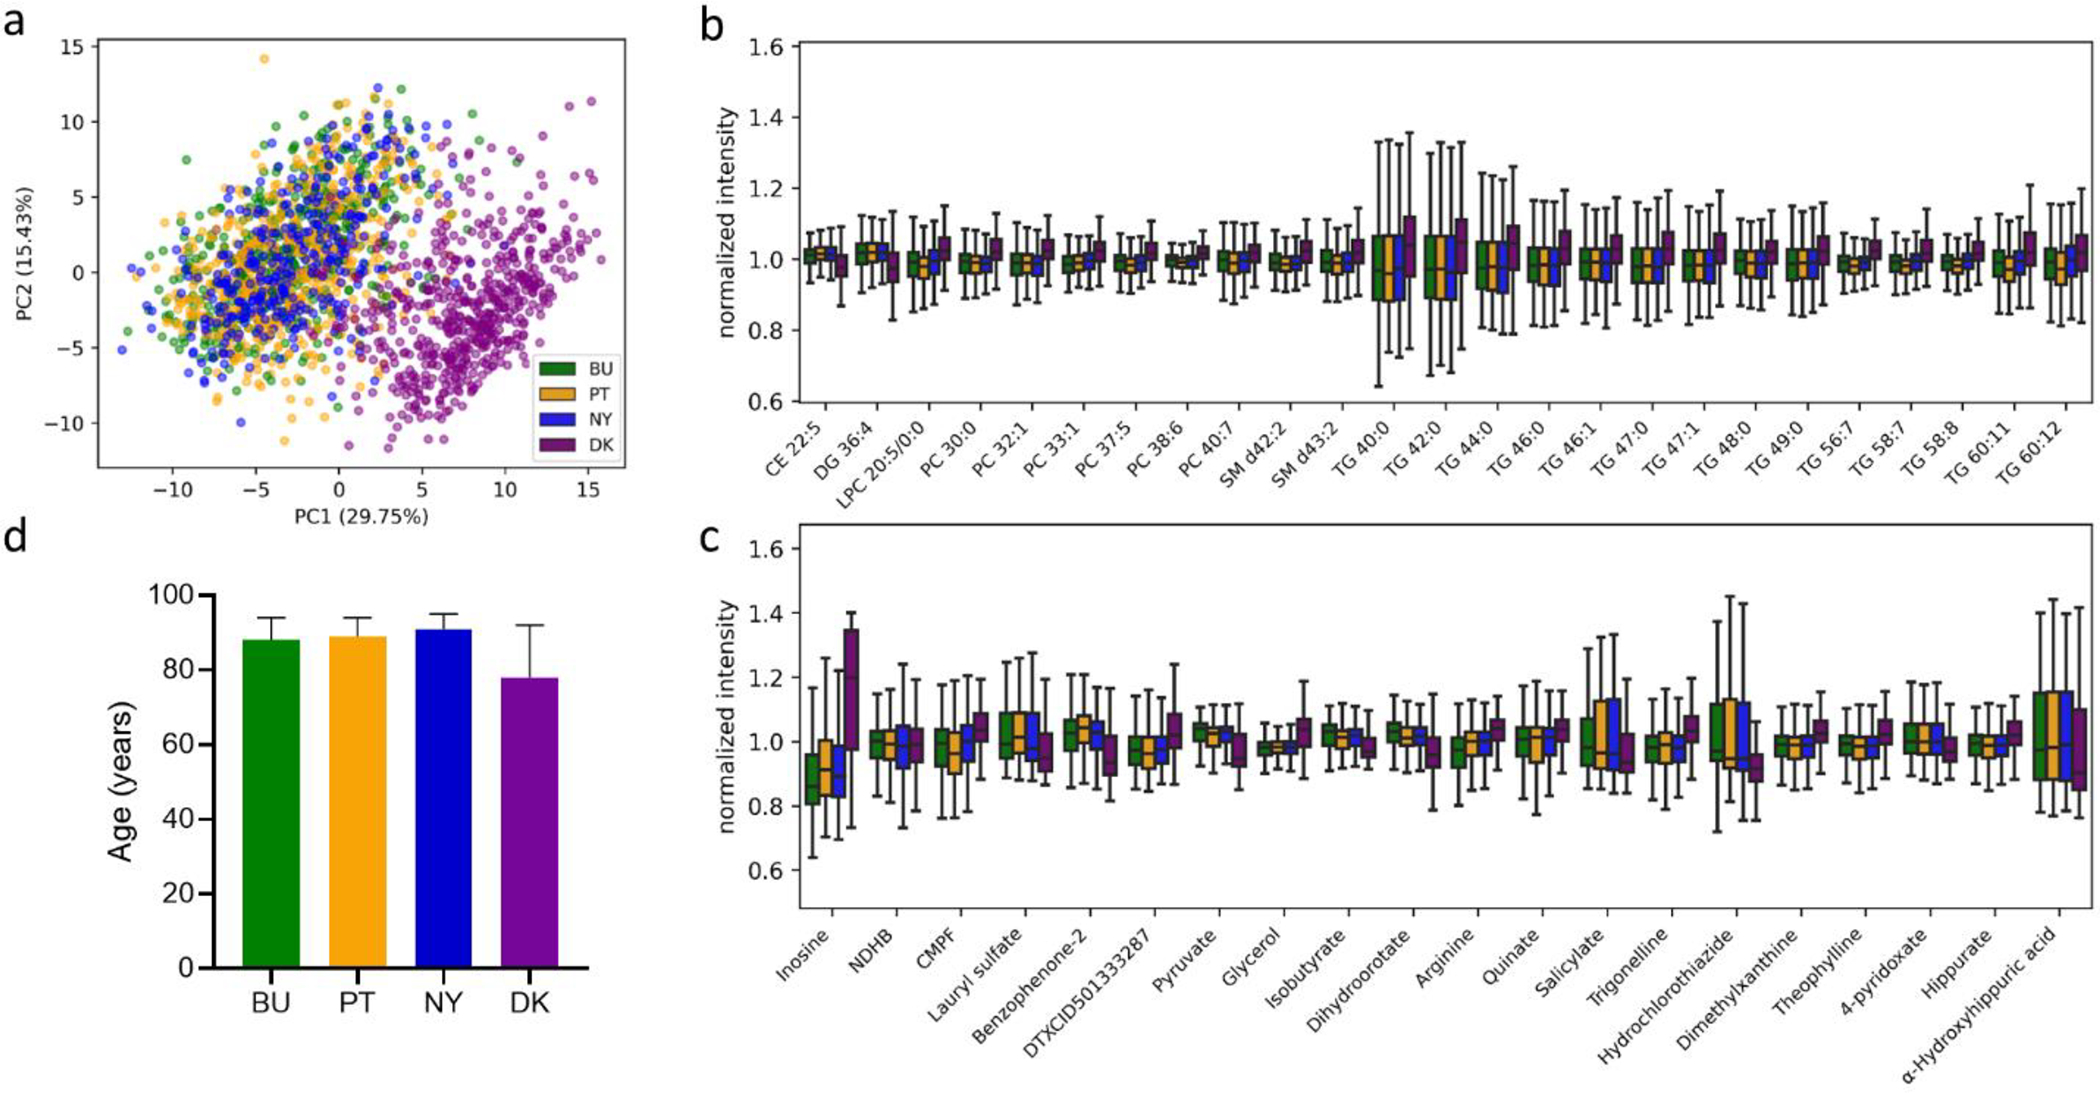
The success of precision medicine relies upon collecting data from many individuals at the population level. Although advancing technologies have made such large-scale studies increasingly feasible in some disciplines such as genomics, the standard workflows currently implemented in untargeted metabolomics were developed for small sample numbers and are limited by the processing of liquid chromatography/mass spectrometry data. Here we present an untargeted metabolomics workflow that is designed to support large-scale projects with thousands of biospecimens. Our strategy is to first evaluate a reference sample created by pooling aliquots of biospecimens from the cohort. The reference sample captures the chemical complexity of the biological matrix in a small number of analytical runs, which can subsequently be processed with conventional software such as XCMS. Although this generates thousands of so-called features, most do not correspond to unique compounds from the samples and can be filtered with established informatics tools. The features remaining represent a comprehensive set of biologically relevant reference chemicals that can then be extracted from the entire cohort's raw data on the basis of m/z values and retention times by using Skyline. To demonstrate applicability to large cohorts, we evaluated >2000 human plasma samples with our workflow. We focused our analysis on 360 identified compounds, but we also profiled >3000 unknowns from the plasma samples. As part of our workflow, we tested 14 different computational approaches for batch correction and found that a random forest-based approach outperformed the others. The corrected data revealed distinct profiles that were associated with the geographic location of participants.


Conflict of interest statement

Competing Interest Statement

The authors declare the following competing financial interests: The Patti laboratory has a research collaboration agreement with Thermo Fisher Scientific and receives financial support from Agilent Technologies. G.J.P is a scientific advisor for Cambridge Isotope Laboratories.

Figures

Figure 1.
Figure 1.. Pipeline for generating and handling metabolomics data.
Polar and lipid metabolites are extracted from plasma samples into 96-well plates for LC/MS analysis. A pooled sample is prepared for feature detection, MS/MS acquisition, and use as a QC sample. Untargeted metabolomics analysis is performed on all samples. After detecting features from the pooled sample, background features and degeneracies are filtered. The remaining features are subjected to metabolite identification with DecoID and Lipid Annotator, and the returned putative identifications are manually curated. The peak areas for these metabolites (as well as any unknowns of interest) are extracted from the research samples by using Skyline. Retention-time shifts are manually corrected per batch for polar metabolites and automatically adjusted by using indexed retention times for lipid compounds. The peak areas are imputed and normalized to remove missing values and batch effects from the data. The final output contains the metabolite information (name, m/z, retention time) and normalized metabolite intensities for each research and QC sample.
Figure 2.
Figure 2.. Correcting for batch effects in metabolomics data.
(a) Principal components analysis (PCA) of unnormalized lipid metabolic profiles shows strong batch effects. Each dot represents a unique sample. Dots are colored according to their corresponding batch number. (b) Comparison of 14 different batch-correction algorithms on the lipid metabolic profiles. The normalization score is the change in coefficient of variation (CV) for the research samples (relative to the unnormalized data) divided by the change in CV for the QC samples. A higher score indicates a reduction of technical variation. (c) PCA plot of random forest normalized lipid metabolic profiles shows reduced clustering by batch. (d) Intensity of CE 16:0 as a function of run order for both unnormalized (top) and random forest corrected data (bottom). (e) Violin plots showing the CV distribution of all compounds in the QC samples for each evaluated batch-correction algorithm. The polar metabolite counterpart to these data is shown in Figure S7.
Figure 3.
Figure 3.. Metabolic profiles are reflective of geographic location.
(a) Principal components analysis (PCA) of normalized metabolic profiles (polar and lipid metabolites) shows clustering based on United States (BU = Boston, NY = New York City, PT = Pittsburg) and Denmark (DK, Odense) field sites. Each dot represents a unique sample. Dots are colored according to geographic location. (b) Lipid and (c) polar metabolites associated with geographic location (|FC| > 2, p < 0.05, one-way ANOVA). (d) Age distribution for samples from the different field sites. Data shown are median ± interquartile range, NDHB, N,N-diethyl-4-hydroxybenzamide; CMPF, 3-carboxy-4-methyl-5-propyl-2-furanpropanoic acid.

References

    1. Ashley EA Towards Precision Medicine. Nat. Rev. Genet. 2016, 17 (9), 507–522. 10.1038/nrg.2016.86. - DOI - PubMed
    1. Denny JC; Collins FS Precision Medicine in 2030—Seven Ways to Transform Healthcare. Cell 2021, 184 (6), 1415–1419. 10.1016/j.cell.2021.01.015. - DOI - PMC - PubMed
    1. FinnGen, a Global Research Project Focusing on Genome Data of 500,000 Finns, Launched. In EurekAlert! American Association for the Advancement of Science; EurekAlert! American Association for the Advancement of Science, 2017.
    1. Bycroft C; Freeman C; Petkova D; Band G; Elliott LT; Sharp K; Motyer A; Vukcevic D; Delaneau O; O’Connell J; Cortes A; Welsh S; Young A; Effingham M; McVean G; Leslie S; Allen N; Donnelly P; Marchini J The UK Biobank Resource with Deep Phenotyping and Genomic Data. Nature 2018, 562 (7726), 203–209. 10.1038/s41586-018-0579-z. - DOI - PMC - PubMed
    1. The “All of Us” Research Program. N. Engl. J. Med. 2019, 381 (7), 668–676. 10.1056/NEJMsr1809937. - DOI - PMC - PubMed

Publication types