

Middle-Down Mass Spectrometry Reveals Activity-Modifying Phosphorylation Barcode in a Class C G Protein-Coupled Receptor
- PMID: 36475650
- PMCID: PMC9785046
- DOI: 10.1021/jacs.2c10697
Middle-Down Mass Spectrometry Reveals Activity-Modifying Phosphorylation Barcode in a Class C G Protein-Coupled Receptor
Abstract
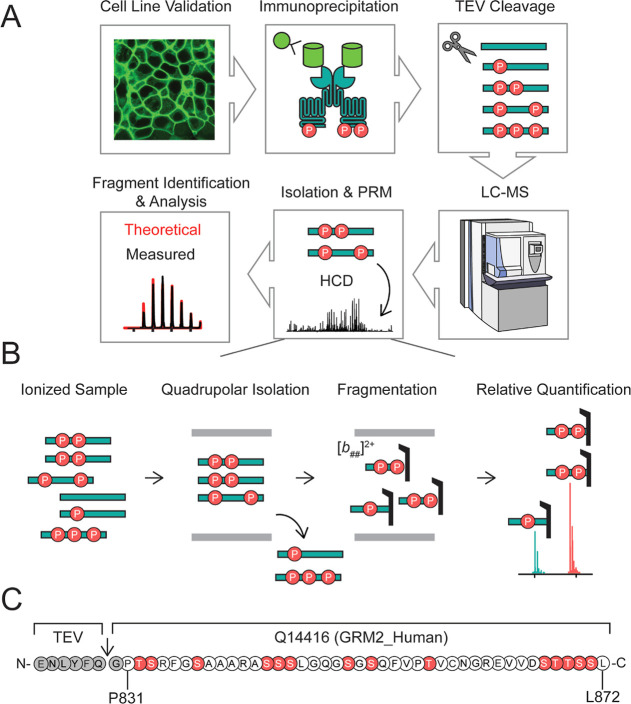
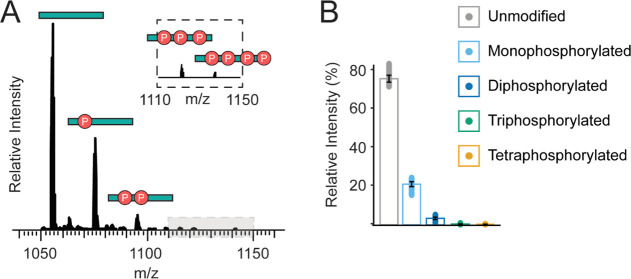
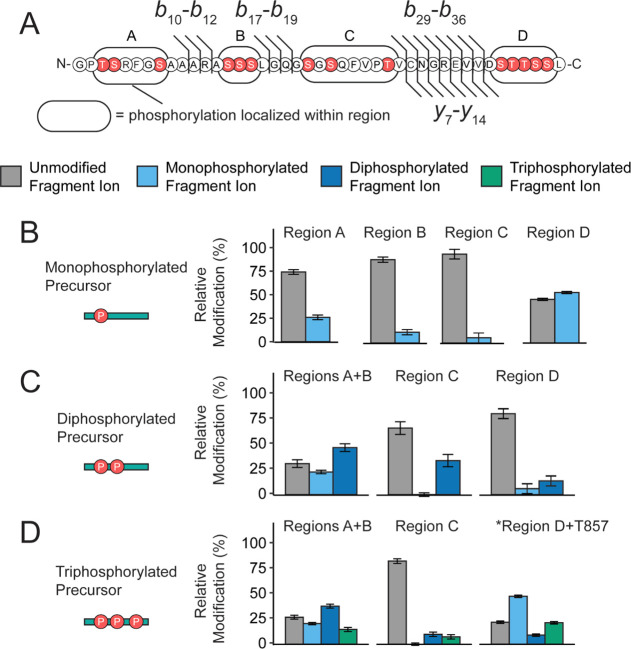
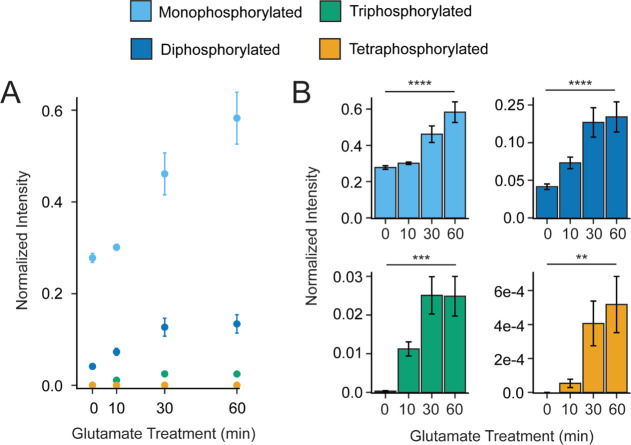
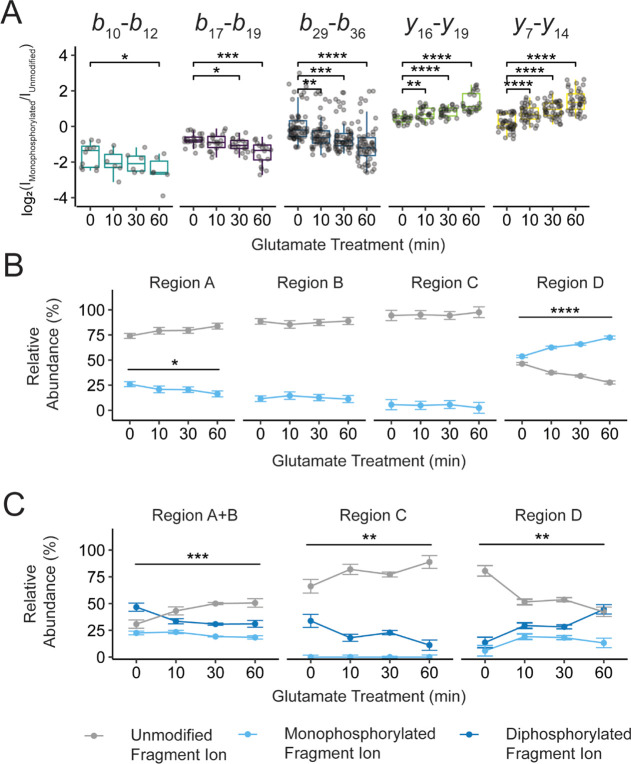
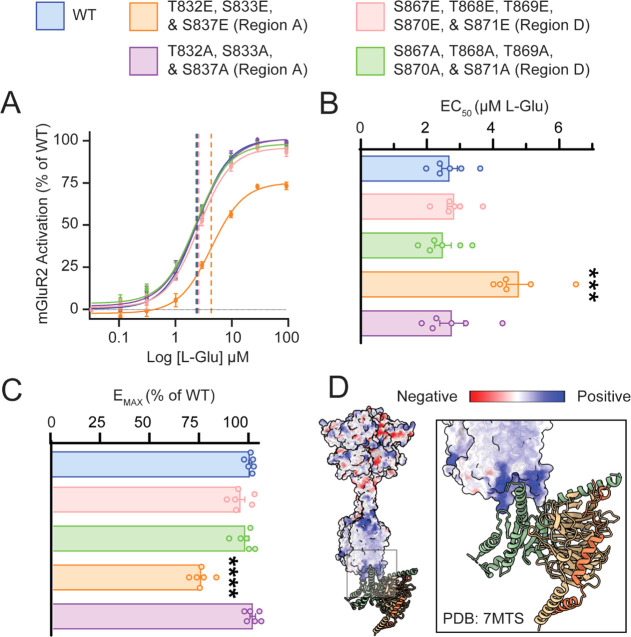
G protein-coupled receptors (GPCRs) are the largest family of membrane receptors in humans. They mediate nearly all aspects of human physiology and thus are of high therapeutic interest. GPCR signaling is regulated in space and time by receptor phosphorylation. It is believed that different phosphorylation states are possible for a single receptor, and each encodes for unique signaling outcomes. Methods to determine the phosphorylation status of GPCRs are critical for understanding receptor physiology and signaling properties of GPCR ligands and therapeutics. However, common proteomic techniques have provided limited quantitative information regarding total receptor phosphorylation stoichiometry, relative abundances of isomeric modification states, and temporal dynamics of these parameters. Here, we report a novel middle-down proteomic strategy and parallel reaction monitoring (PRM) to quantify the phosphorylation states of the C-terminal tail of metabotropic glutamate receptor 2 (mGluR2). By this approach, we found that mGluR2 is subject to both basal and agonist-induced phosphorylation at up to four simultaneous sites with varying probability. Using a PRM tandem mass spectrometry methodology, we localized the positions and quantified the relative abundance of phosphorylations following treatment with an agonist. Our analysis showed that phosphorylation within specific regions of the C-terminal tail of mGluR2 is sensitive to receptor activation, and subsequent site-directed mutagenesis of these sites identified key regions which tune receptor sensitivity. This study demonstrates that middle-down purification followed by label-free quantification is a powerful, quantitative, and accessible tool for characterizing phosphorylation states of GPCRs and other challenging proteins.
Conflict of interest statement
The authors declare the following competing financial interest(s): N.L.K. and R.T.F. are involved in commercialization of proteomics software.
Figures
Similar articles
-
Identification of GPCR-interacting cytosolic proteins using HDL particles and mass spectrometry-based proteomic approach.PLoS One. 2013;8(1):e54942. doi: 10.1371/journal.pone.0054942. Epub 2013 Jan 25. PLoS One. 2013. PMID: 23372797 Free PMC article.
-
Determination of GPCR Phosphorylation Status: Establishing a Phosphorylation Barcode.Curr Protoc Pharmacol. 2015 Jun 1;69:2.13.1-2.13.26. doi: 10.1002/0471141755.ph0213s69. Curr Protoc Pharmacol. 2015. PMID: 26344213 Review.
-
Elucidating structural and molecular mechanisms of β-arrestin-biased agonism at GPCRs via MS-based proteomics.Cell Signal. 2018 Jan;41:56-64. doi: 10.1016/j.cellsig.2017.09.013. Epub 2017 Sep 20. Cell Signal. 2018. PMID: 28939107 Review.
-
Molecular mechanisms of ligand binding, signaling, and regulation within the superfamily of G-protein-coupled receptors: molecular modeling and mutagenesis approaches to receptor structure and function.Pharmacol Ther. 2004 Jul;103(1):21-80. doi: 10.1016/j.pharmthera.2004.05.002. Pharmacol Ther. 2004. PMID: 15251227 Review.
-
Identification of key phosphorylation sites in PTH1R that determine arrestin3 binding and fine-tune receptor signaling.Biochem J. 2016 Nov 15;473(22):4173-4192. doi: 10.1042/BCJ20160740. Epub 2016 Sep 13. Biochem J. 2016. PMID: 27623777 Free PMC article.
Cited by
-
Discovery of Proteoforms Associated With Alzheimer's Disease Through Quantitative Top-Down Proteomics.Mol Cell Proteomics. 2025 Jun;24(6):100983. doi: 10.1016/j.mcpro.2025.100983. Epub 2025 May 5. Mol Cell Proteomics. 2025. PMID: 40334744 Free PMC article.
-
Phosphorylation bar-coding of free fatty acid receptor 2 is generated in a tissue-specific manner.Elife. 2023 Dec 12;12:RP91861. doi: 10.7554/eLife.91861. Elife. 2023. PMID: 38085667 Free PMC article.
-
Precise Readout of MEK1 Proteoforms upon MAPK Pathway Modulation by Individual Ion Mass Spectrometry.Anal Chem. 2024 Mar 19;96(11):4455-4462. doi: 10.1021/acs.analchem.3c04758. Epub 2024 Mar 8. Anal Chem. 2024. PMID: 38458998 Free PMC article.
-
Fiber-Type Shifting in Sarcopenia of Old Age: Proteomic Profiling of the Contractile Apparatus of Skeletal Muscles.Int J Mol Sci. 2023 Jan 26;24(3):2415. doi: 10.3390/ijms24032415. Int J Mol Sci. 2023. PMID: 36768735 Free PMC article. Review.
-
Differential Role of Phosphorylation in Glucagon Family Receptor Signaling Revealed by Mass Spectrometry.J Proteome Res. 2025 Jul 4;24(7):3367-3378. doi: 10.1021/acs.jproteome.5c00079. Epub 2025 Jun 12. J Proteome Res. 2025. PMID: 40503712 Free PMC article.
References
Publication types
MeSH terms
Substances
Grants and funding
LinkOut - more resources
Full Text Sources
Research Materials
