. 2023 Feb 28;14(1):e0306822.
doi: 10.1128/mbio.03068-22. Epub 2022 Dec 8.

The IRE1α-XBP1 Signaling Axis Promotes Glycolytic Reprogramming in Response to Inflammatory Stimuli

Affiliations

The IRE1α-XBP1 Signaling Axis Promotes Glycolytic Reprogramming in Response to Inflammatory Stimuli

Bevin C English et al. mBio. .

Abstract

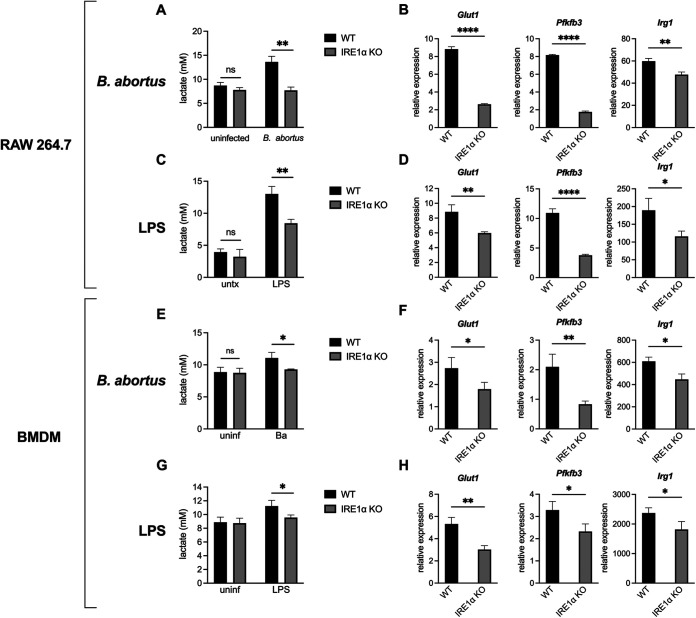
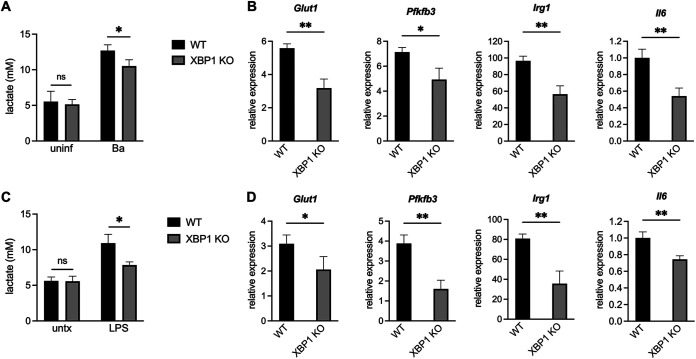
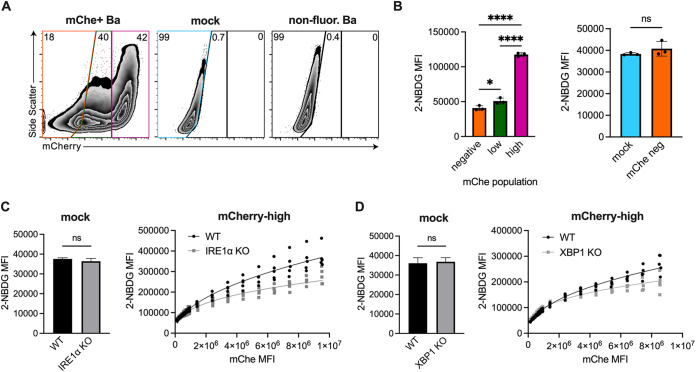
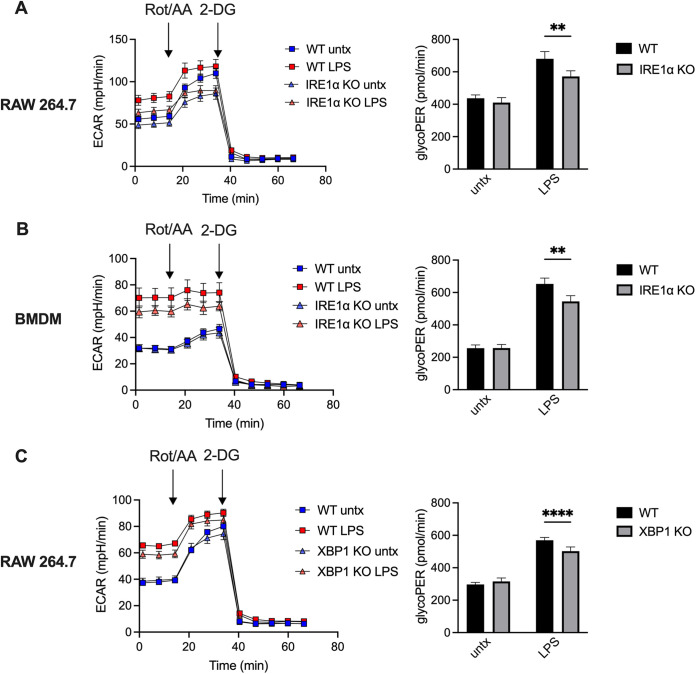
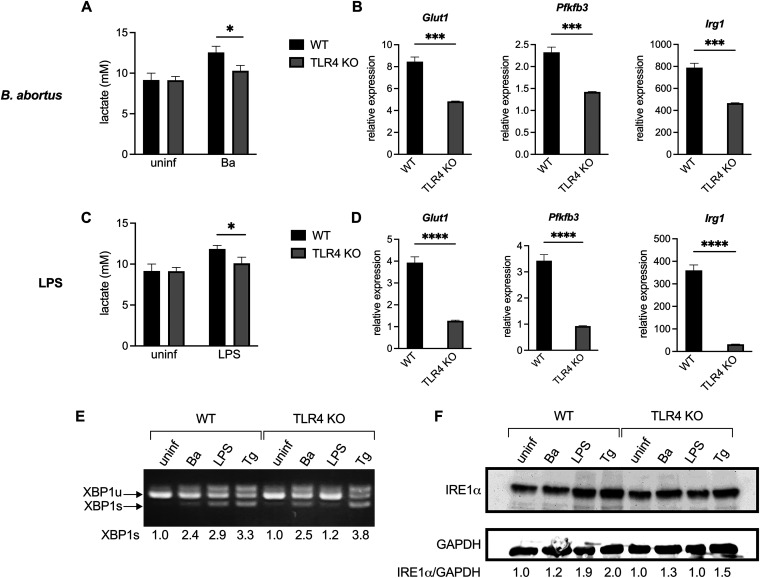
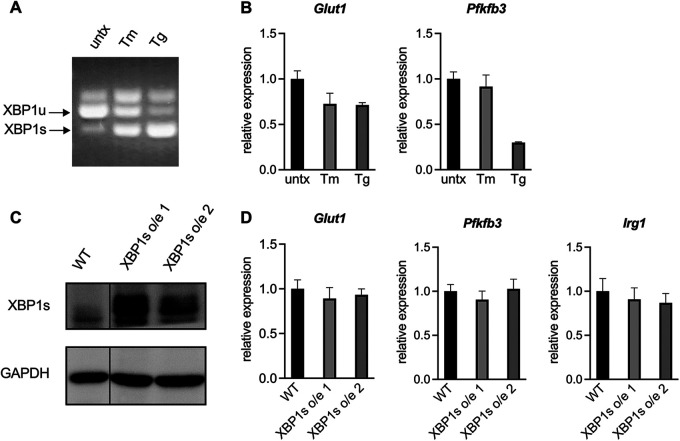
Immune cells must be able to adjust their metabolic programs to effectively carry out their effector functions. Here, we show that the endoplasmic reticulum (ER) stress sensor Inositol-requiring enzyme 1 alpha (IRE1α) and its downstream transcription factor X box binding protein 1 (XBP1) enhance the upregulation of glycolysis in classically activated macrophages (CAMs). The IRE1α-XBP1 signaling axis supports this glycolytic switch in macrophages when activated by lipopolysaccharide (LPS) stimulation or infection with the intracellular bacterial pathogen Brucella abortus. Importantly, these different inflammatory stimuli have distinct mechanisms of IRE1α activation; while Toll-like receptor 4 (TLR4) supports glycolysis under both conditions, TLR4 is required for activation of IRE1α in response to LPS treatment but not B. abortus infection. Though IRE1α and XBP1 are necessary for maximal induction of glycolysis in CAMs, activation of this pathway is not sufficient to increase the glycolytic rate of macrophages, indicating that the cellular context in which this pathway is activated ultimately dictates the cell's metabolic response and that IRE1α activation may be a way to fine-tune metabolic reprogramming. IMPORTANCE The immune system must be able to tailor its response to different types of pathogens in order to eliminate them and protect the host. When confronted with bacterial pathogens, macrophages, frontline defenders in the immune system, switch to a glycolysis-driven metabolism to carry out their antibacterial functions. Here, we show that IRE1α, a sensor of ER stress, and its downstream transcription factor XBP1 support glycolysis in macrophages during infection with Brucella abortus or challenge with Salmonella LPS. Interestingly, these stimuli activate IRE1α by independent mechanisms. While the IRE1α-XBP1 signaling axis promotes the glycolytic switch, activation of this pathway is not sufficient to increase glycolysis in macrophages. This study furthers our understanding of the pathways that drive macrophage immunometabolism and highlights a new role for IRE1α and XBP1 in innate immunity.

Keywords: Brucella; endoplasmic reticulum; immunometabolism; innate immunity.


Conflict of interest statement

The authors declare no conflict of interest.

Figures

FIG 1
FIG 1
IRE1α supports lactate production and glycolytic gene expression during B. abortus infection or LPS stimulation in macrophages. Wild-type (WT) and IRE1α knockout (KO) RAW 264.7 cells were infected with B. abortus (Ba) for 48 h (A and B) or stimulated with 100 ng/mL Salmonella LPS for 24 h (C and D). Supernatant lactate was quantified (A and C), and the relative expression of the indicated genes normalized to uninfected controls was assessed by reverse transcription-quantitative PCR (RT-qPCR) (B and D). (E to H) Same as panels A to D, but with WT (LysM-Cre Ern1fl/fL) or IRE1α KO (LysM-Cre+ Ern1fl/fL) BMDMs. The data are presented as means of triplicate wells ± the standard deviations (SD). *, P ≤ 0.05; **, P ≤ 0.01; ***, P ≤ 0.001; ****, P ≤ 0.0001; ns, no statistical difference (Student two-tailed t test).
FIG 2
FIG 2
XBP1 promotes lactate production and the expression of glycolytic and inflammatory genes during B. abortus infection or LPS treatment. WT and XBP1 KO RAW 264.7 cells were infected with B. abortus (Ba) for 48 h (A and B) or treated with 100 ng/mL Salmonella LPS for 24 h (C and D). Supernatant lactate was quantified (A and C) and relative expression of the indicated genes was assessed by RT-qPCR (B and D). Expression levels of Glut1, Pfkfb3, and Irg1 were normalized to uninfected controls. Because it is not detected in unstimulated cells, IL-6 expression was normalized to the infected or LPS-stimulated WT cells. The data are presented as means of triplicate wells ± the SD. *, P ≤ 0.05; **, P ≤ 0.01; ns, no statistical difference (Student two-tailed t test).
FIG 3
FIG 3
Glucose import of infected macrophages correlates with bacterial burden and is reduced in IRE1α or XBP1 KO macrophages. (A and B) WT RAW 264.7 cells were mock infected or infected with mCherry (mChe)-expressing B. abortus for 48 h and then stained with fluorescent glucose analog 2-NBDG. Cells were then gated based on mCherry signal. (A) Representative fluorescence-activated cell sorting plots showing mock or infected RAW 264.7 cells, gated on all live cells. RAW 264.7 cells infected with a wild-type non-mCherry-expressing strain is shown as an mCherry-negative control. (B) The MFI of 2-NBDG was calculated within the indicated populations. (C and D) RAW 264.7 cells of the indicated genotypes were mock infected or infected with mCherry-expressing B. abortus for 48 h before 2-NBDG staining. (Left) 2-NBDG MFIs of mock-infected cells. (Right) 2-NBDG MFI for the mCherry-high populations after binning based on mCherry signal. Dots represent individual wells, columns are means, and error bars are the SD. *, P ≤ 0.05; **, P ≤ 0.01; ***, P ≤ 0.001; ****, P ≤ 0.0001; ns, no statistical difference (as determined by a Student two-tailed t test, except for the left side of panel B) which was analyzed using one-way analysis of variance [ANOVA] with Tukey’s post hoc test.
FIG 4
FIG 4
IRE1α and XBP1 support glycolysis after LPS stimulation. (A to C) WT or IRE1α KO RAW 264.7 cells (A), WT (LysM-Cre Ern1fl/fL) or IRE1α KO (LysM-Cre+ Ern1fl/fL) BMDMs (B), and WT or XBP1 KO RAW 264.7 cells (C) were stimulated with 100 ng/mL Salmonella LPS for 6 h before the assessing extracellular acidification rate (ECAR), with rotenone/antimycin A (Rot/AA) and 2-doxyglucose (2-DG) treatments, as indicated (left). The proton efflux rate from glycolysis (glycoPER) was calculated as a more specific assessment of glycolytic flux (right).
FIG 5
FIG 5
TLR4 supports glycolysis but not activation of IRE1α during B. abortus infection. BMDMs from WT or TLR4 KO mice were infected with B. abortus (Ba) for 48 h, treated with 100 ng/mL Salmonella LPS for 24 h, or treated with 250 nM thapsigargin (Tg) for 24 h. (A and C) Supernatant lactate was quantified. (B and D) Relative expression of the indicated genes normalized to uninfected controls was assessed by RT-qPCR. (E) XBP1 splicing was assessed via nonquantitative RT-PCR. The densitometry of the XBP1s band relative to uninfected samples for each genotype is reported below. (F) IRE1α protein levels were assessed by Western blotting. Densitometry of the IRE1α band normalized to the GAPDH band and relative to uninfected for each genotype is reported below. Lactate and expression data are presented as means of triplicate wells ± the SD. *, P ≤ 0.05; **, P ≤ 0.01; ***, P ≤ 0.001; ****, P ≤ 0.0001 (Student two-tailed t test).
FIG 6
FIG 6
The type IV secretion system promotes glucose import by macrophages during B. abortus infection. RAW 264.7 cells were infected with the T4SS-deficient mCherry-expressing virB2 mutant at an MOI of 2,000 or the mCherry-expressing complemented virB2 strain at an MOI of 100 and then stained with 2-NBDG after 48 h. (A) MFIs of mCherry and 2-NBDG for the mCherry-low population of RAW 264.7 cells infected with the indicated B. abortus strains. (B) 2-NBDG MFI for the mCherry-high populations infected with the indicated B. abortus strains after binning based on mCherry signal. Dots represent individual wells, columns are means, and error bars are the SD. **, P ≤ 0.01; ns, no statistical difference (Student two-tailed t test).
FIG 7
FIG 7
Activation of the IRE1α-XBP1 signaling axis is not sufficient to increase glycolysis in macrophages. (A and B) RAW 264.7 cells were treated with 200 ng/mL tunicamycin (Tm) or 50 nM thapsigargin (Tg) for 24 h. XBP1 splicing was assessed by nonquantitative RT-PCR (A), and expression of the indicated genes normalized to untreated controls was assessed by RT-qPCR (B). (C and D) Two independent XBP1s overexpression (o/e) RAW 264.7 cell lines were generated. XBP1s protein levels were assessed by Western blotting (C), and expression of the indicated genes normalized to wild-type RAW 264.7 was assessed by RT-qPCR (D). The data are means of triplicate wells ± the SD.

References

    1. Viola A, Munari F, Sanchez-Rodriguez R, Scolaro T, Castegna A. 2019. The Metabolic signature of macrophage responses. Front Immunol 10:1462. doi:10.3389/fimmu.2019.01462. - DOI - PMC - PubMed
    1. Czyż DM, Willett JW, Crosson S. 2017. Brucella abortus induces a Warburg shift in host metabolism that is linked to enhanced intracellular survival of the pathogen. J Bacteriol 199. doi:10.1128/JB.00227-17. - DOI - PMC - PubMed
    1. Gomes MTR, Guimaraes ES, Marinho FV, Macedo I, Aguiar E, Barber GN, Moraes-Vieira PMM, Alves-Filho JC, Oliveira SC. 2021. STING regulates metabolic reprogramming in macrophages via HIF-1alpha during Brucella infection. PLoS Pathog 17:e1009597. doi:10.1371/journal.ppat.1009597. - DOI - PMC - PubMed
    1. Xavier MN, Winter MG, Spees AM, den Hartigh AB, Nguyen K, Roux CM, Silva TM, Atluri VL, Kerrinnes T, Keestra AM, Monack DM, Luciw PA, Eigenheer RA, Baumler AJ, Santos RL, Tsolis RM. 2013. PPARγ-mediated increase in glucose availability sustains chronic Brucella abortus infection in alternatively activated macrophages. Cell Host Microbe 14:159–170. doi:10.1016/j.chom.2013.07.009. - DOI - PMC - PubMed
    1. Adams CJ, Kopp MC, Larburu N, Nowak PR, Ali MMU. 2019. Structure and molecular mechanism of ER stress signaling by the unfolded protein response signal activator IRE1. Front Mol Biosci 6:11. doi:10.3389/fmolb.2019.00011. - DOI - PMC - PubMed

Publication types

MeSH terms