. 2022 Dec 9;8(49):eadd4220.
doi: 10.1126/sciadv.add4220. Epub 2022 Dec 7.

PmiR senses 2-methylisocitrate levels to regulate bacterial virulence in Pseudomonas aeruginosa

Affiliations

PmiR senses 2-methylisocitrate levels to regulate bacterial virulence in Pseudomonas aeruginosa

Guoyan Cui et al. Sci Adv. .

Abstract

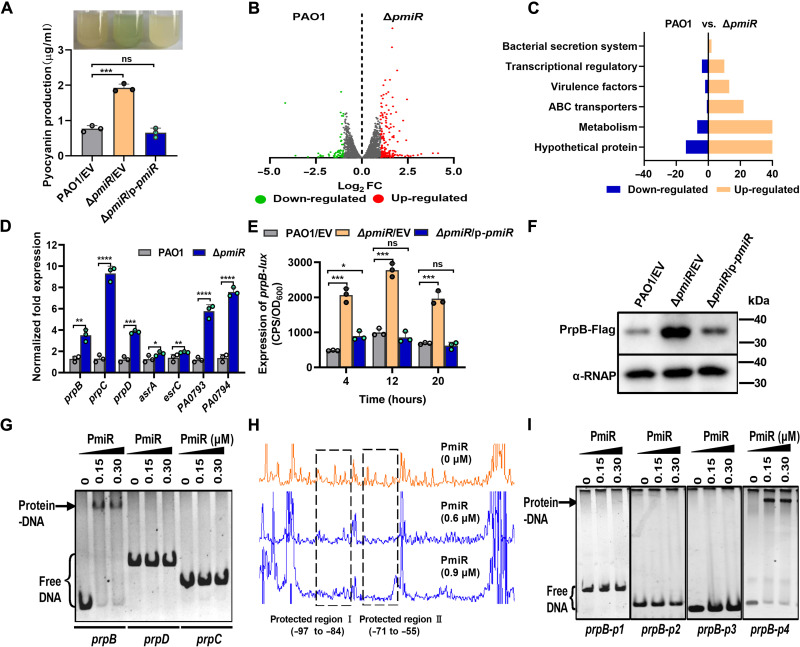
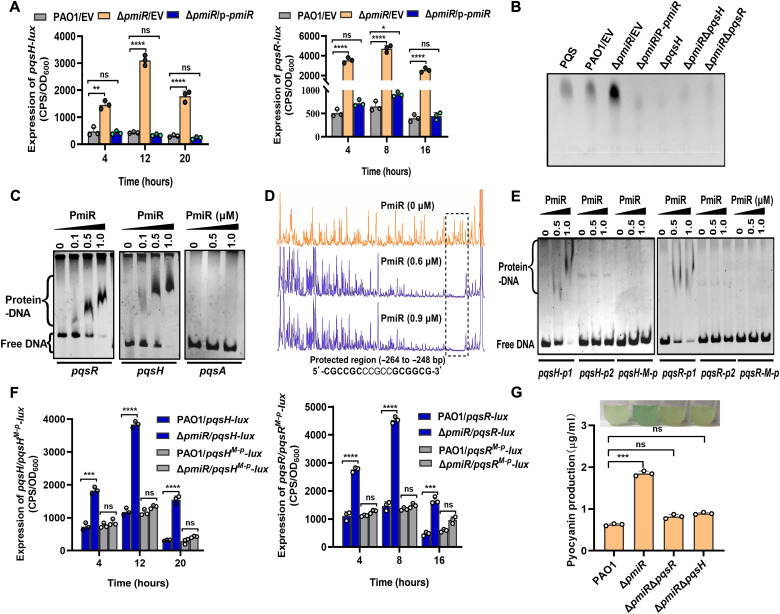
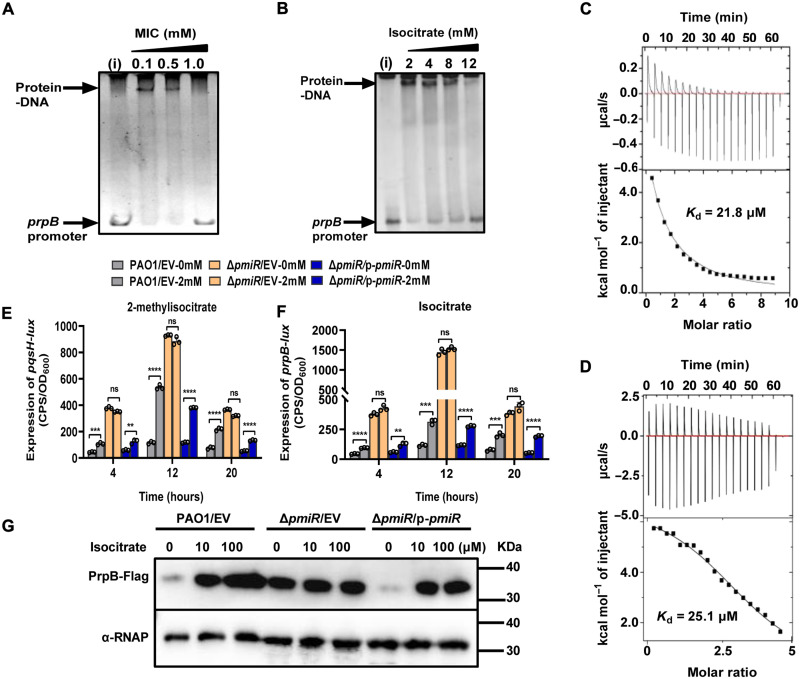
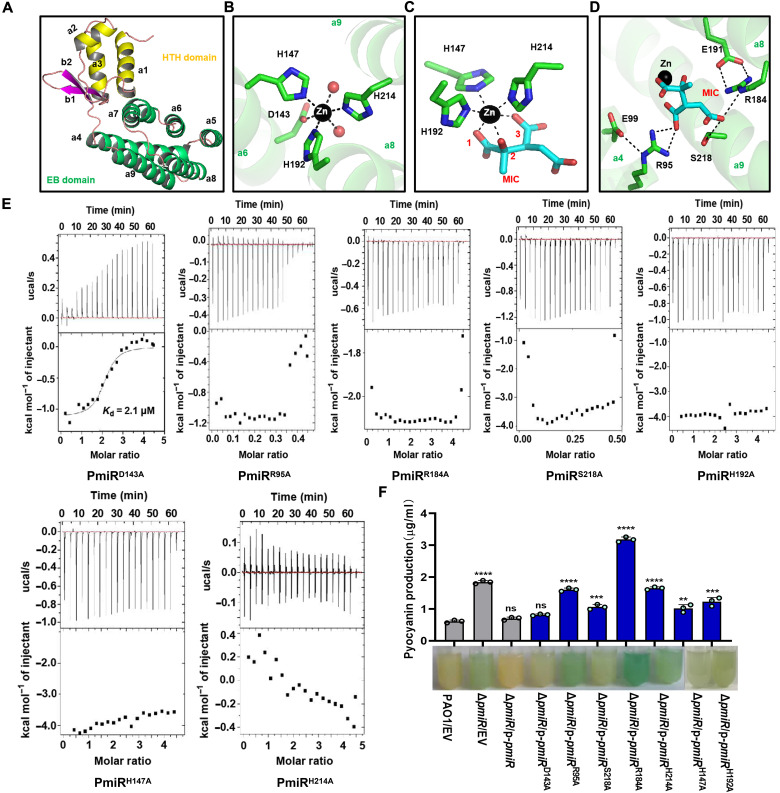
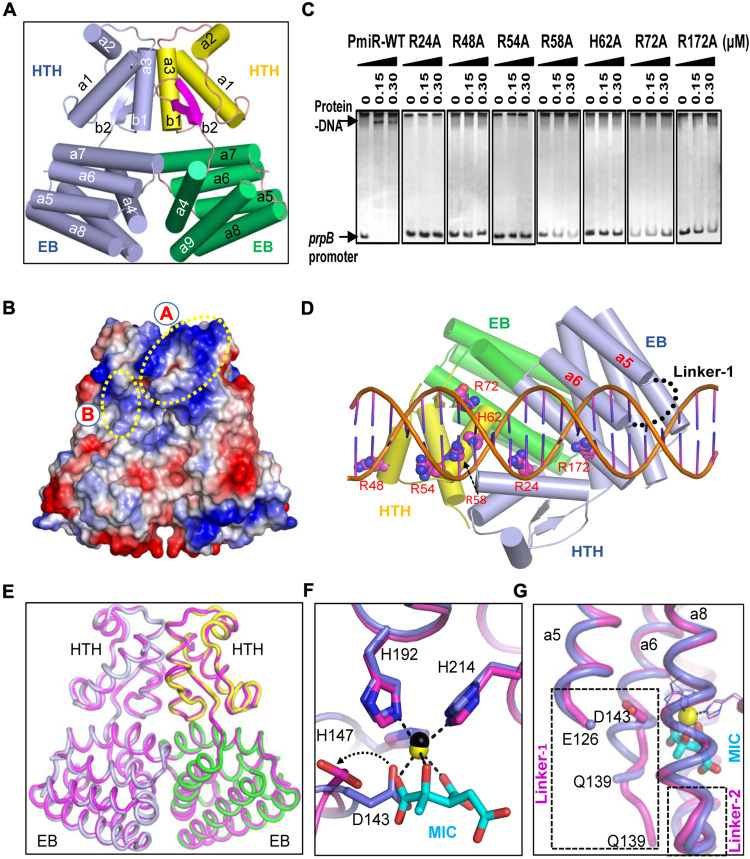
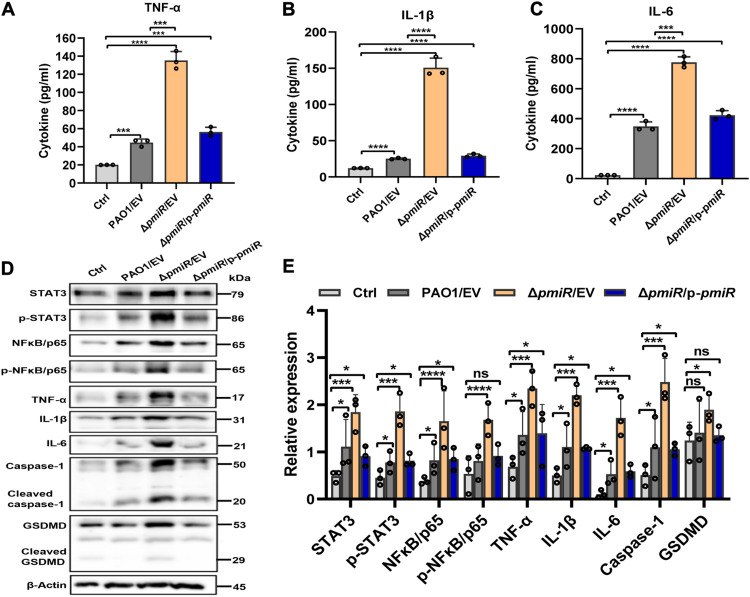
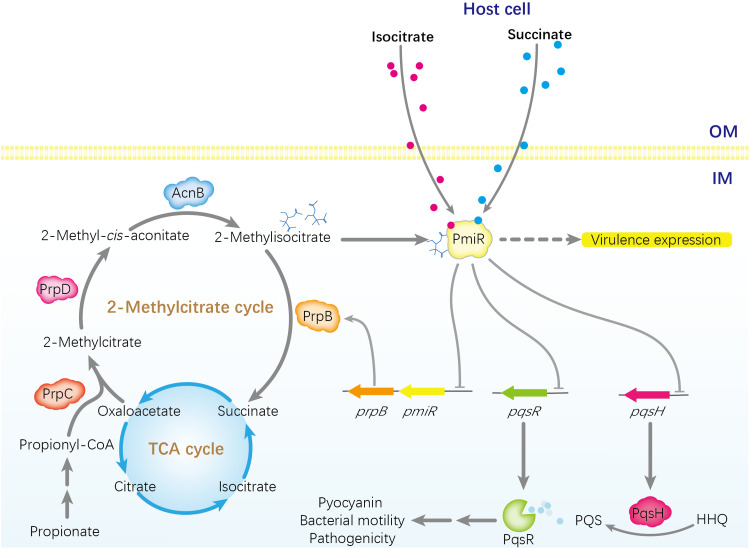
To adapt to changes in environmental cues, Pseudomonas aeruginosa produces an array of virulence factors to survive the host immune responses during infection. Metabolic products contribute to bacterial virulence; however, only a limited number of these signaling receptors have been explored in detail for their ability to modulate virulence in bacteria. Here, we characterize the metabolic pathway of 2-methylcitrate cycle in P. aeruginosa and unveil that PmiR served as a receptor of 2-methylisocitrate (MIC) to govern bacterial virulence. Crystallographic studies and structural-guided mutagenesis uncovered several residues crucial for PmiR's allosteric activation by MIC. We also demonstrated that PmiR directly repressed the pqs quorum-sensing system and subsequently inhibited pyocyanin production. Moreover, mutation of pmiR reduces bacterial survival in a mouse model of acute pneumonia infection. Collectively, this study identified P. aeruginosa PmiR as an important metabolic sensor for regulating expression of bacterial virulence genes to adapt to the harsh environments.


Figures

Fig. 1.
Fig. 1.. PmiR controls pyocyanin production and regulates the genes expression of 2-MCC.
(A) Pyocyanin production of the wild-type PAO1 (WT PAO1), ΔpmiR mutant, and the complemented strain was detected in Luria-Bertani (LB) broth for 24 hours. (B) Volcano plot of the DEGs was analyzed between the WT PAO1 and ΔpmiR strain by RNA-seq. Red dots, up-regulated. Green dots, down-regulated. FC, fold change. (C) PmiR regulon categorized by Clusters of Orthologous Gene (COG). (D) qRT-PCR analysis of the indicated genes in WT PAO1 and ΔpmiR strain. ABC, adenosine triphosphate–binding cassette. (E) Expression of prpB was measured in the indicated strains. (A, D, and E) Error bars indicate the means ± SD of three independent experiments. *P <0.05; **P < 0.01; ***P < 0.001; ****P < 0.0001. ns, no significance. EV represents the empty vector pAK1900. OD600, optical density at 600 nm. CPS, Counts per second. (F) The expression of PrpB-Flag from the indicated strains was detected by Western blot with an α-Flag antibody. α–RNA polymerase (RNAP) was used as a loading control. (G) EMSA showing that PmiR binds to the promoter region of prpB but not prpC or prpD. Each reaction mixture contains PCR products (2.0 ng/μl). The protein concentrations were indicated above the lane. (H) DNAase I footpringing on the prpB promoter by PmiR showed two regions protected by PmiR. (I) EMSAs showing that PmiR binds to the promoter region of prpB-p4 (−97 to +100, with site I and site II) but not prpB-p1 (−71 to +100, which lacks site I), prpB-p2 (−217 to −84, which lacks site II), and prpB-p3 (−54 to +100, which lacks both site I and site II).
Fig. 2.
Fig. 2.. PmiR controls the production of pyocyanin by directly regulating the pqs system.
(A) Expression of pqsR-lux and pqsH-lux was measured in WT PAO1, ΔpmiR, and the complemented strain. (B) TLC analysis of PQS produced by the indicated strains. PQS is a standard sample control. Data are representative of three independent replicates. (C) EMSAs showing that PmiR binds the promoter region of pqsR and pqsH but not pqsA. Each reaction mixture contains PCR products of pqsR, pqsH, and pqsA (2.0 ng/μl). The protein concentrations were indicated above the lane. (D) Electropherograms show the protection pattern of the pqsH promoter after digestion with DNase I following incubation in the absence and the presence of two different concentrations of PmiR. The PmiR-protected region (relative to the start codon) was indicated by a dotted line. (E) EMSAs showing that PmiR could bind to the truncated promoter region of pqsH-p1 and pqsR-p1 (with the protected region) but not pqsH-p2 and pqsR-p2 (without the protected region) and the mutated pqsH-M-p and pqsR-M-p. Each reaction mixture contains PCR products (2.0 ng/μl). The protein concentrations were indicated above the lane. (F) The promoter activity of pqsR-lux, pqsH-lux, pqsR-M-p, and pqsH-M-p was measured in WT PAO1 and ΔpmiR strain. (G) The production of pyocyanin was measured in PAO1, ΔpmiR, ΔpmiRΔpqsH, and ΔpmiRΔpqsR strains cultured overnight in LB medium. (A, F, and G) Error bars indicate the means ± SD of three independent experiments. Statistical significance was calculated using one-way analysis of variance (ANOVA) Dunnett’s multiple comparison test, * P < 0.05; **P < 0.01; ***P < 0.001; ****P < 0.0001. EV represents the empty vector pAK1900.
Fig. 3.
Fig. 3.. PmiR senses MIC to regulate the expression of genes involved in virulence factors.
(A and B) EMSA showing the effect of different concentrations of MIC and isocitrate on the DNA binding ability of PmiR. Each reaction mixture contains DNA (2 ng/μl), 0.3 μM PmiR, and the indicated concentrations of MIC and isocitrate. Data are representative of three independent replicates. (C and D) ITC experiments of PmiR toward MIC and isocitrate. The top panel shows heat differences upon injection of MIC (C) or isocitrate (D), and the bottom panel shows integrated heats of injection with the best fit (solid line) to a single binding model using Microcal ORIGIN. (E) Expression of pqsH-lux was tested in WT PAO1, ΔpmiR, and the complemented strain cultured in M9 minimal medium (MM) with or without 2 mM MIC. (F) Expression of prpB-lux was measured in WT PAO1, ΔpmiR, and the complemented strain cultured in M9 MM with or without 2 mM isocitrate. Error bars indicate the means ± SD of three independent experiments. Statistical significance was calculated using one-way ANOVA Dunnett’s multiple comparison test, **P < 0.01; ***P < 0.001; ****P < 0.0001. EV represents the empty vector pAK1900. (G) The protein levels of PrpB-Flag were detected in the indicated strains cultured in M9 medium with or without isocitrate by Western blot analysis. The tagged proteins were detected using a Flag antibody. α-RNAP antibody was used as a loading control. Data are representative of three independent replicates.
Fig. 4.
Fig. 4.. Crystal structure of PmiR-MIC complex.
(A) The overall fold of PmiR monomer. (B) Zn2+ coordination observed in the apo-form PmiR structure. (C) Zn2+ and MIC interactions observed in the MIC-complexed structure. (D) Interactions between MIC and other residues of PmiR. In (B) to (D), the Zn2+ ion is shown as sphere; MIC, MIC-interacting, and Zn2+-coordinating residues are shown as sticks. (E) ITC analysis showing the impacts of Zn2+ binding and other key residues on MIC binding by PmiR. For each figure, the top panel shows heat differences upon injection of MIC, and the bottom panel shows integrated heats of injection with the best fit (solid line) to a single binding model using Microcal ORIGIN. (F) The production of pyocyanin was measured in WT PAO1, ΔpmiR, and the different complemented strains. Lower photos show strains cultured in LB broth for 24 hours. Data are representative of three independent replicates. Error bars indicate the means ± SD of three independent experiments. **P < 0.01; ***P < 0.001; ****P < 0.0001 compared to WT PAO1 by Student’s t test. EV represents the empty vector pAK1900.
Fig. 5.
Fig. 5.. Basis for DNA binding regulation by MIC.
(A) The cartoon presentation of the apo-form PmiR homodimer. The HTH and effector binding domains are colored differently in one monomer, whereas both are colored in light-blue in the partner molecule. (B) The surface presentations of PmiR homodimer. The positive and negative residues are colored in blue and red, respectively. (C) EMSAs showing the DNA binding abilities of WT and mutated-PmiR proteins. Each reaction mixture contains PCR products of prpB (2.0 ng/μl). The protein concentrations are indicated above the lane. Data are representative of three independent replicates. (D) The proposed DNA binding model of PmiR homodimer, which is colored as in (A). Residues important for DNA binding are highlighted as spheres. The disordered linker-1 region is indicated by black dots. (E) Comparison of the overall structures of the apo-form and MIC-complexed PmiR. (F and G) Superposition showing the conformational changes of D143 and the 139QQEGD143 fragment in the apo-form and MIC-complexed PmiR structures. In (E) to (G), the C atoms of the MIC-complexed PmiR proteins are colored in magenta. Zn2+ ion and MIC are shown as yellow sphere and sticks in atomic color (C, cyan; O, red), respectively. The apo-form PmiR structure is colored similarly as in (A). EB, Effector binding
Fig. 6.
Fig. 6.. PmiR plays an important role in P. aeruginosa pathogenesis.
(A) Deletion of pmiR increased the virulence of P. aeruginosa. C57BL/6J mice were intranasally challenged with WT PAO1, ΔpmiR, ΔpmiR/p-pmiR, or ΔpmiRΔpqsR at 2 × 107 CFU in 50 μl of phosphate-buffered saline (PBS), and moribund mice were euthanized for survival data, which are presented with Kaplan-Meier survival curves (n = 6 for each group). The mouse survival assay was measured three times, and data shown are representative of these assays. Statistical significance was calculated using log-rank test. (B and C) Mice were infected with bacteria as (A) or a PBS control. At 12 and 24 hours, the lungs (B) and BALF (C) from infected mice were collected. Bacterial loads were enumerated through serial dilution and plating. (D) Evaluation of lung injury. (E) Lung injury assessed by hematoxylin and eosin staining at 24 hours after infection with the indicated P. aeruginosa strains. Scale bars, 1000 μm (top; original magnification, ×20) and 1000 μm (bottom; original magnification, ×40). The boxes at the top were enlarged in insets below. (F) Cell viability of AM was evaluated through the CCK-8 assay. (G and H) ROS production in AMs was detected by an H2DCF assay (G) and NBT assay (H). RFU, Relative Fluorescence Unit; RLU, Relative Light Unit. (I) The measurements of MPO activity in the lung. Error bars indicate the SD from three independent replicates. Groups were compared with each other in statistics. **P < 0.01, ***P < 0.001, ****P < 0.0001 based on one-way ANOVA Dunnett’s multiple comparison test.
Fig. 7.
Fig. 7.. pmiR deficiency aggravated inflammatory response and pyroptosis through an STAT3/NF-кB signaling pathway after P. aeruginosa infection.
(A to C) Inflammatory cytokines in BALF were assessed by enzyme-linked immunosorbent assay. (D) Western blot detected the expression of inflammatory cytokines (TNF-α, IL-1β, and IL-6), pyroptosis markers (caspase-1 and GSDMD), STAT3, p-STAT3, NF-кB/p65, and p-NF-кB/p65. (E) The densitometry of the data shown in (D). Error bars indicate the SD from three independent replicates. Groups were compared with each other in statistics. *P < 0.05, ***P < 0.001, ****P < 0.0001 based on one-way ANOVA Dunnett’s multiple comparison test.
Fig. 8.
Fig. 8.. Proposed model of PmiR sensing the metabolic intermediates to regulate expression of genes involved in pqs system and virulence factors in P. aeruginosa.
In this study, we defined the pathway of 2-MCC and demonstrated that PmiR represses the expression of genes involved in 2-MCC and pqs system directly in P. aeruginosa. PmiR as a receptor could bind and sense MIC and its analogs, such as succinate and isocitrate (produced by P. aeruginosa or come from cell host), to regulate virulence factors. Arrows indicate positive regulation, and T bars present negative regulation. OM, outer membrane; IM, inner membrane.

Similar articles

Cited by

References

    1. Horswill A. R., Dudding A. R., Escalante-Semerena J. C.,Studies of propionate toxicity in Salmonella enterica identify 2-methylcitrate as a potent inhibitor of cell growth. J. Biol. Chem. 276,19094–19101 (2001). - PubMed
    1. Dolan S. K., Wijaya A., Geddis S. M., Spring D. R., Silva-Rocha R., Welch M.,Loving the poison: The methylcitrate cycle and bacterial pathogenesis. Microbiology (Reading) 164,251–259 (2018). - PubMed
    1. Eoh H., Rhee K. Y.,Methylcitrate cycle defines the bactericidal essentiality of isocitrate lyase for survival of Mycobacterium tuberculosis on fatty acids. Proc. Natl. Acad. Sci. U.S.A. 111,4976–4981 (2014). - PMC - PubMed
    1. Upton A. M., McKinney J. D.,Role of the methylcitrate cycle in propionate metabolism and detoxification in Mycobacterium smegmatis. Microbiology (Reading) 153,3973–3982 (2007). - PubMed
    1. Limenitakis J., Oppenheim R. D., Creek D. J., Foth B. J., Barrett M. P., Soldati-Favre D.,The 2-methylcitrate cycle is implicated in the detoxification of propionate in Toxoplasma gondii. Mol. Microbiol. 87,894–908 (2013). - PMC - PubMed