. 2023 Feb 14;11(1):e0213922.
doi: 10.1128/spectrum.02139-22. Epub 2022 Dec 8.

Host Genetics and Environment Shape the Composition of the Gastrointestinal Microbiome in Nonhuman Primates

Affiliations

Host Genetics and Environment Shape the Composition of the Gastrointestinal Microbiome in Nonhuman Primates

Jacob K Flynn et al. Microbiol Spectr. .

Abstract

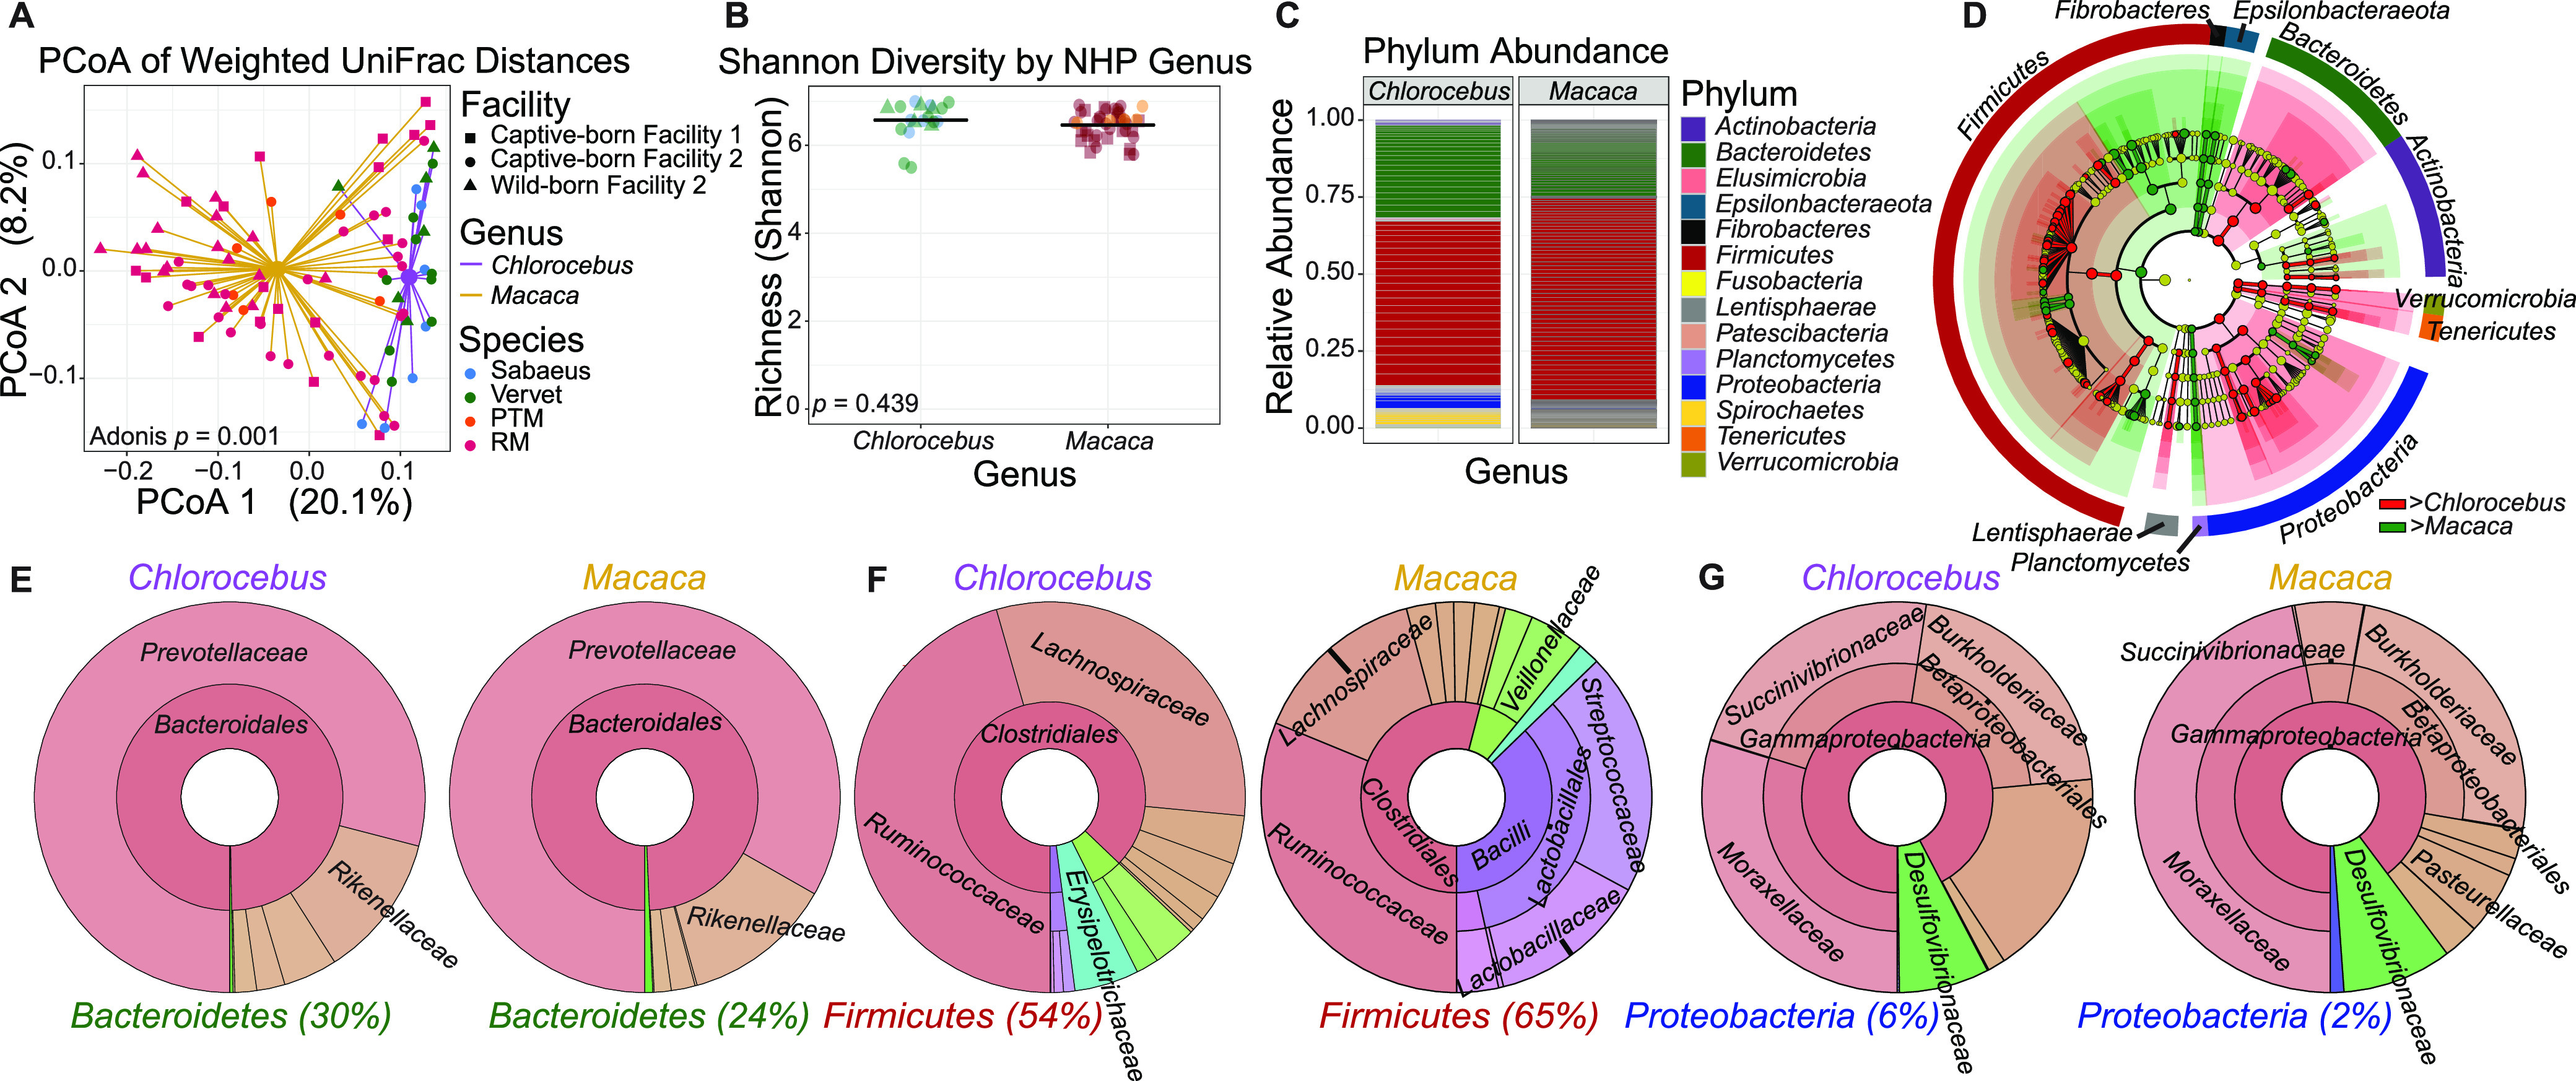
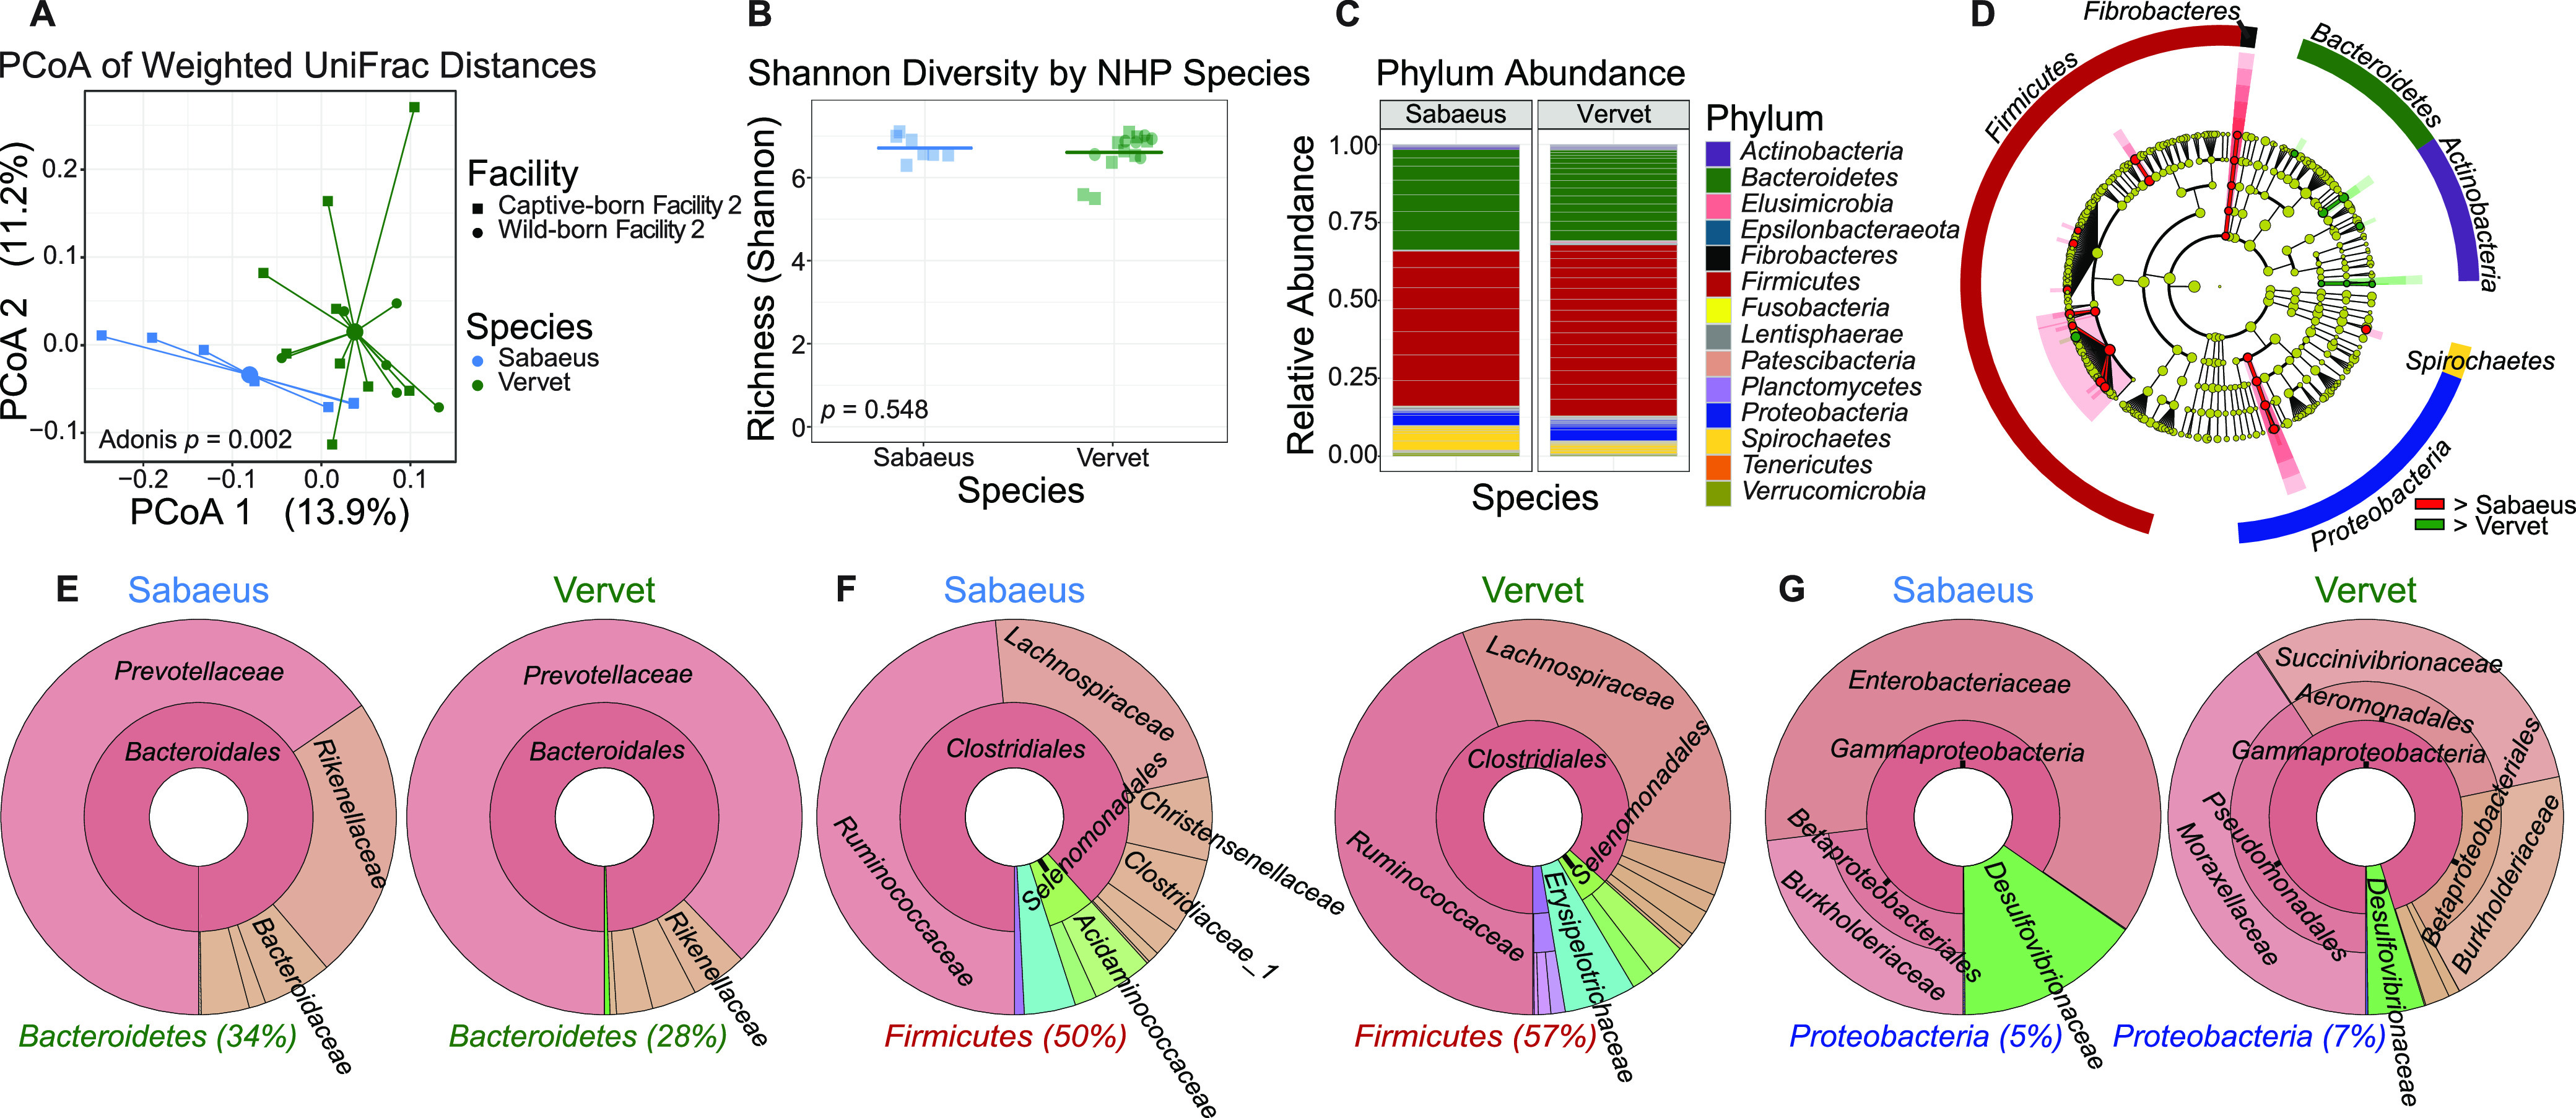
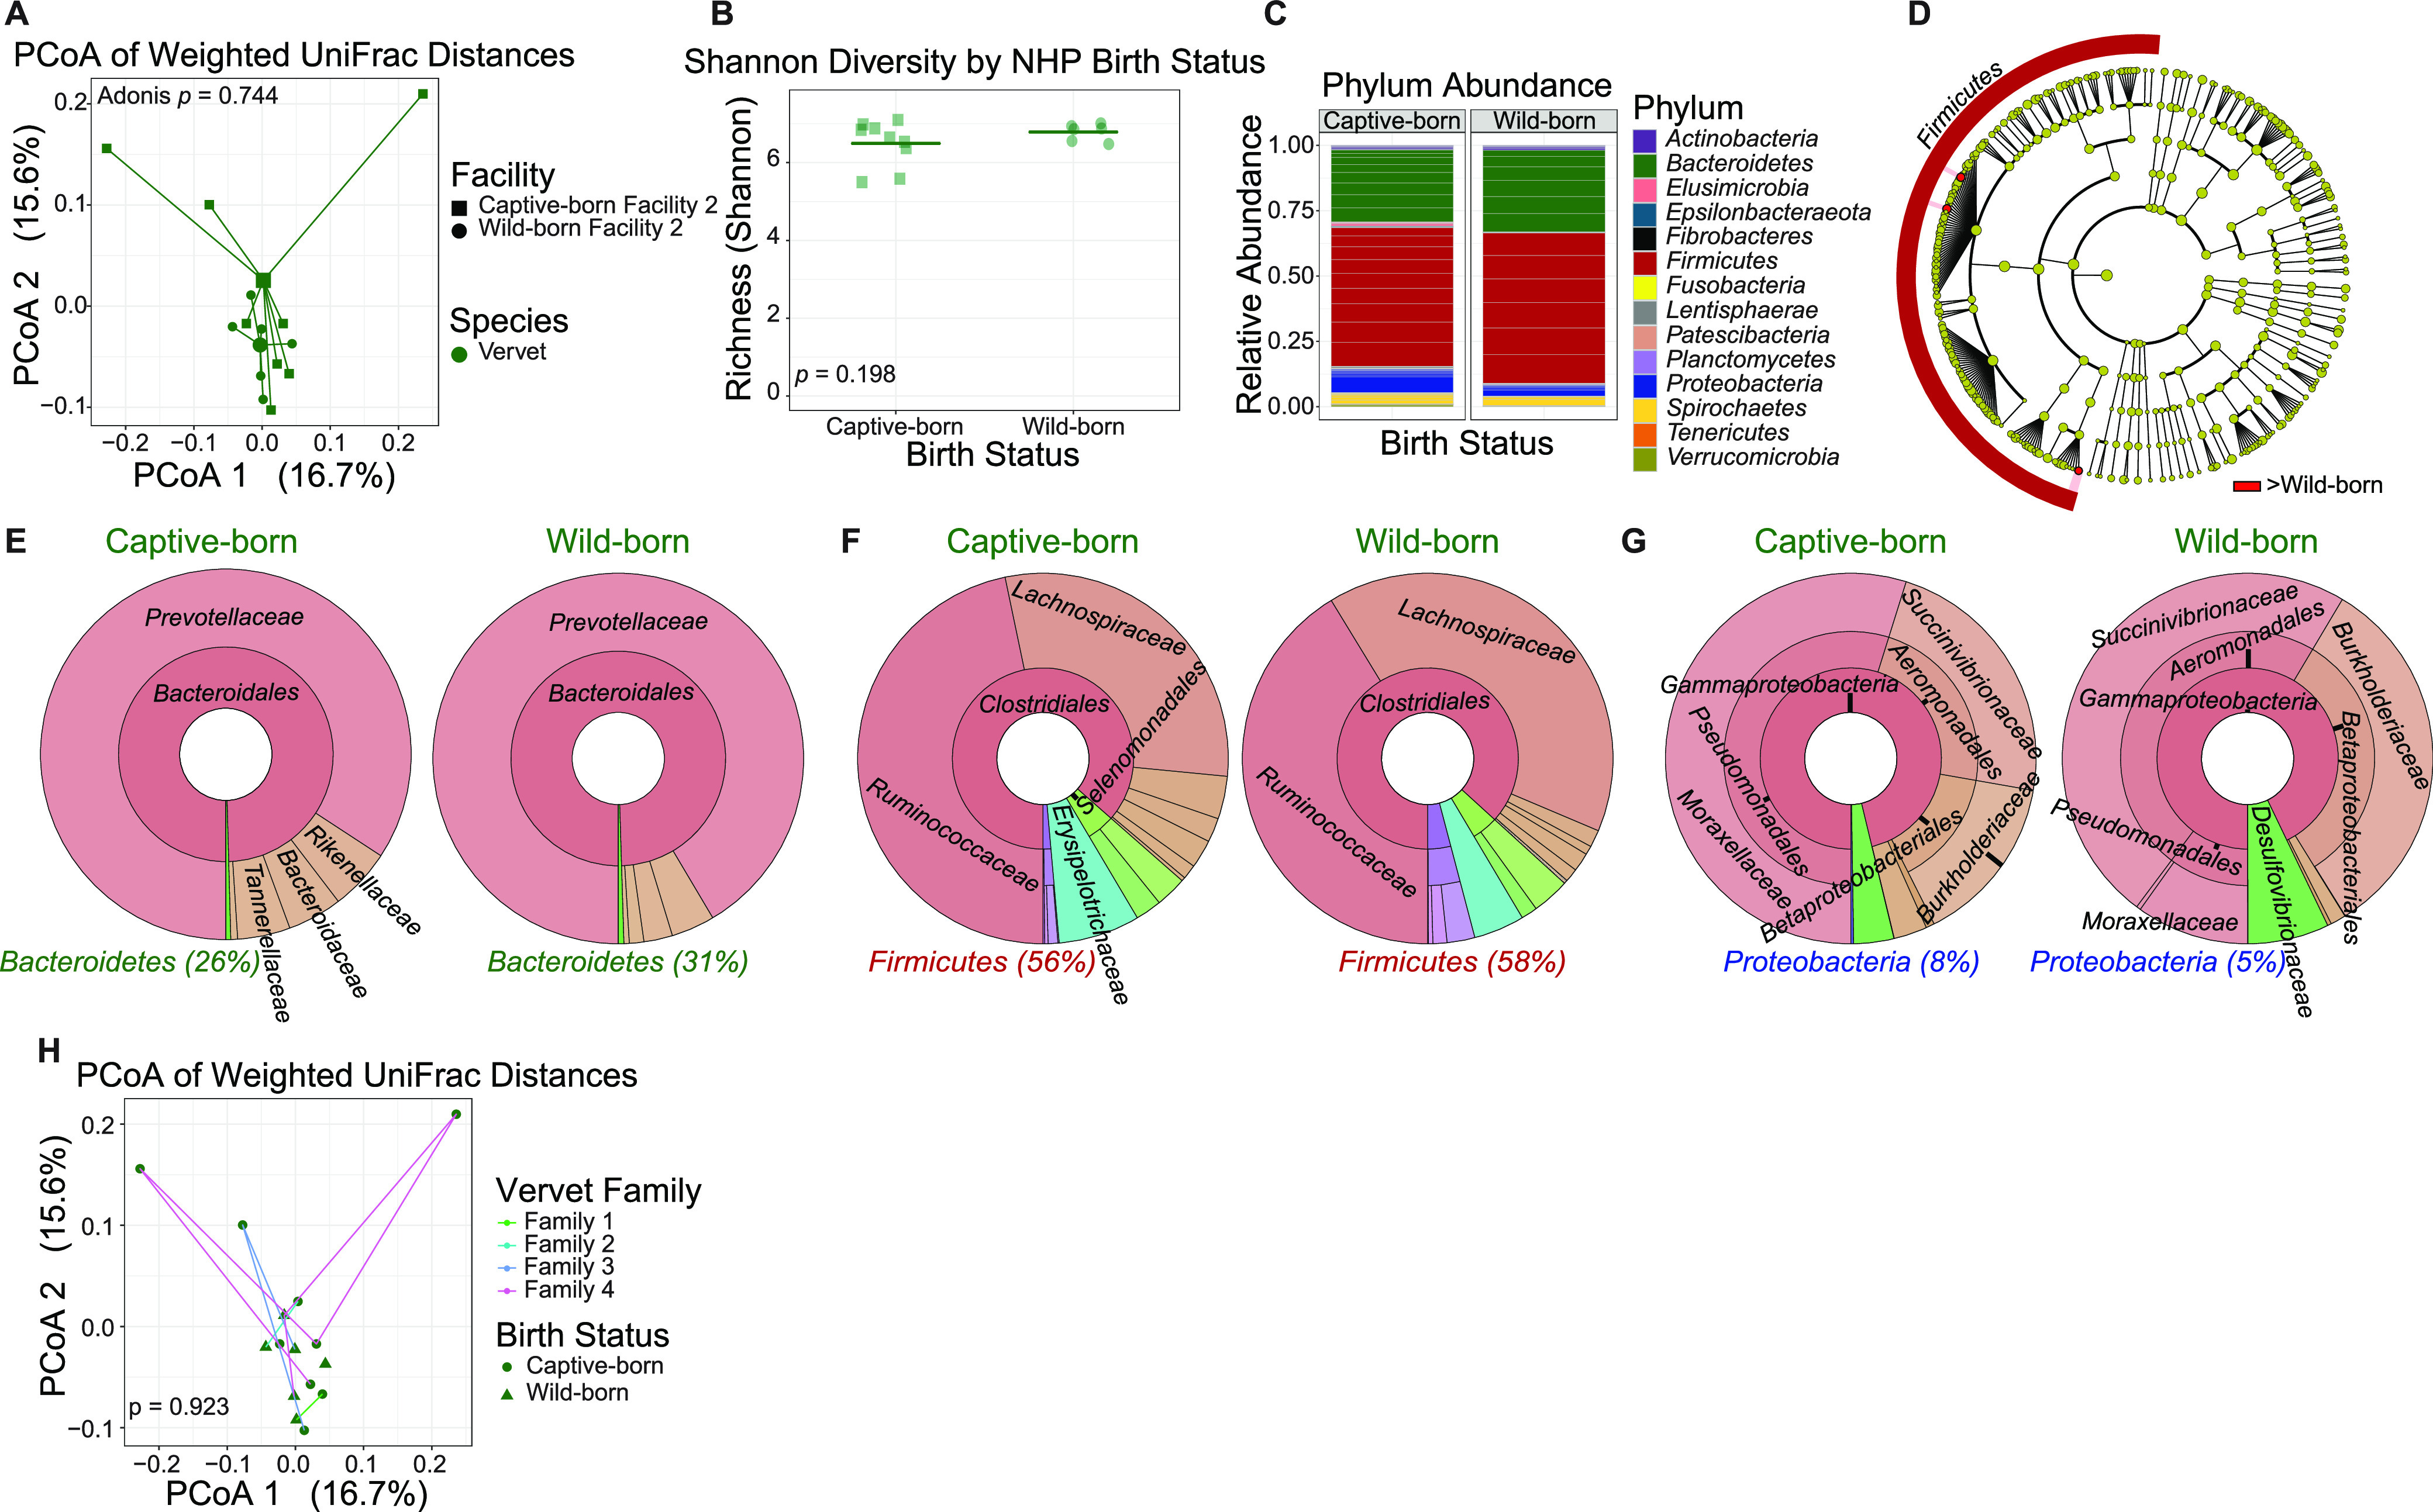
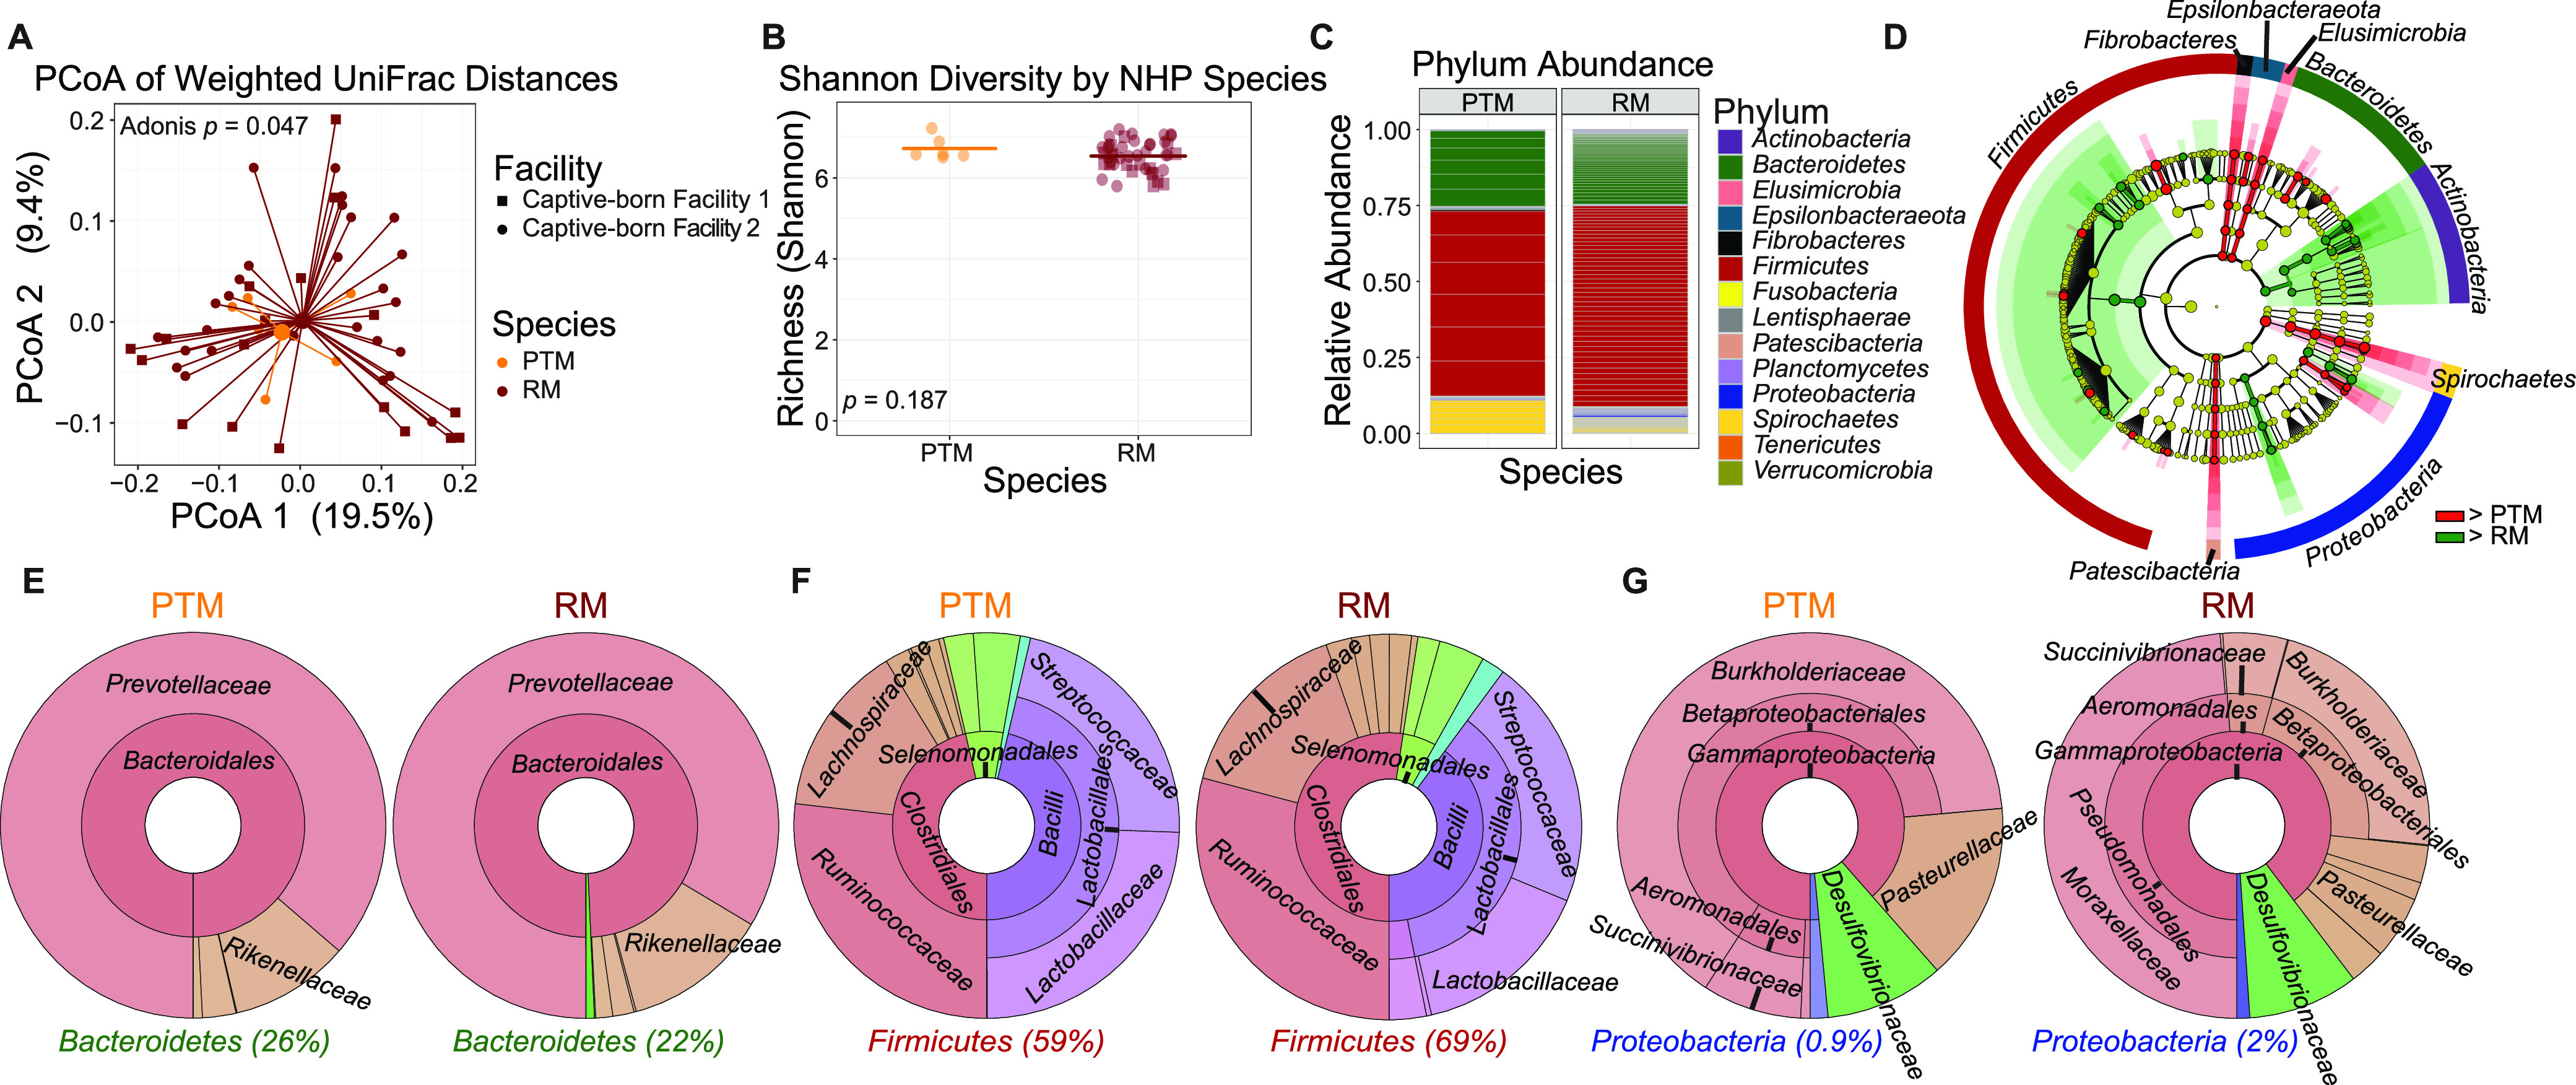
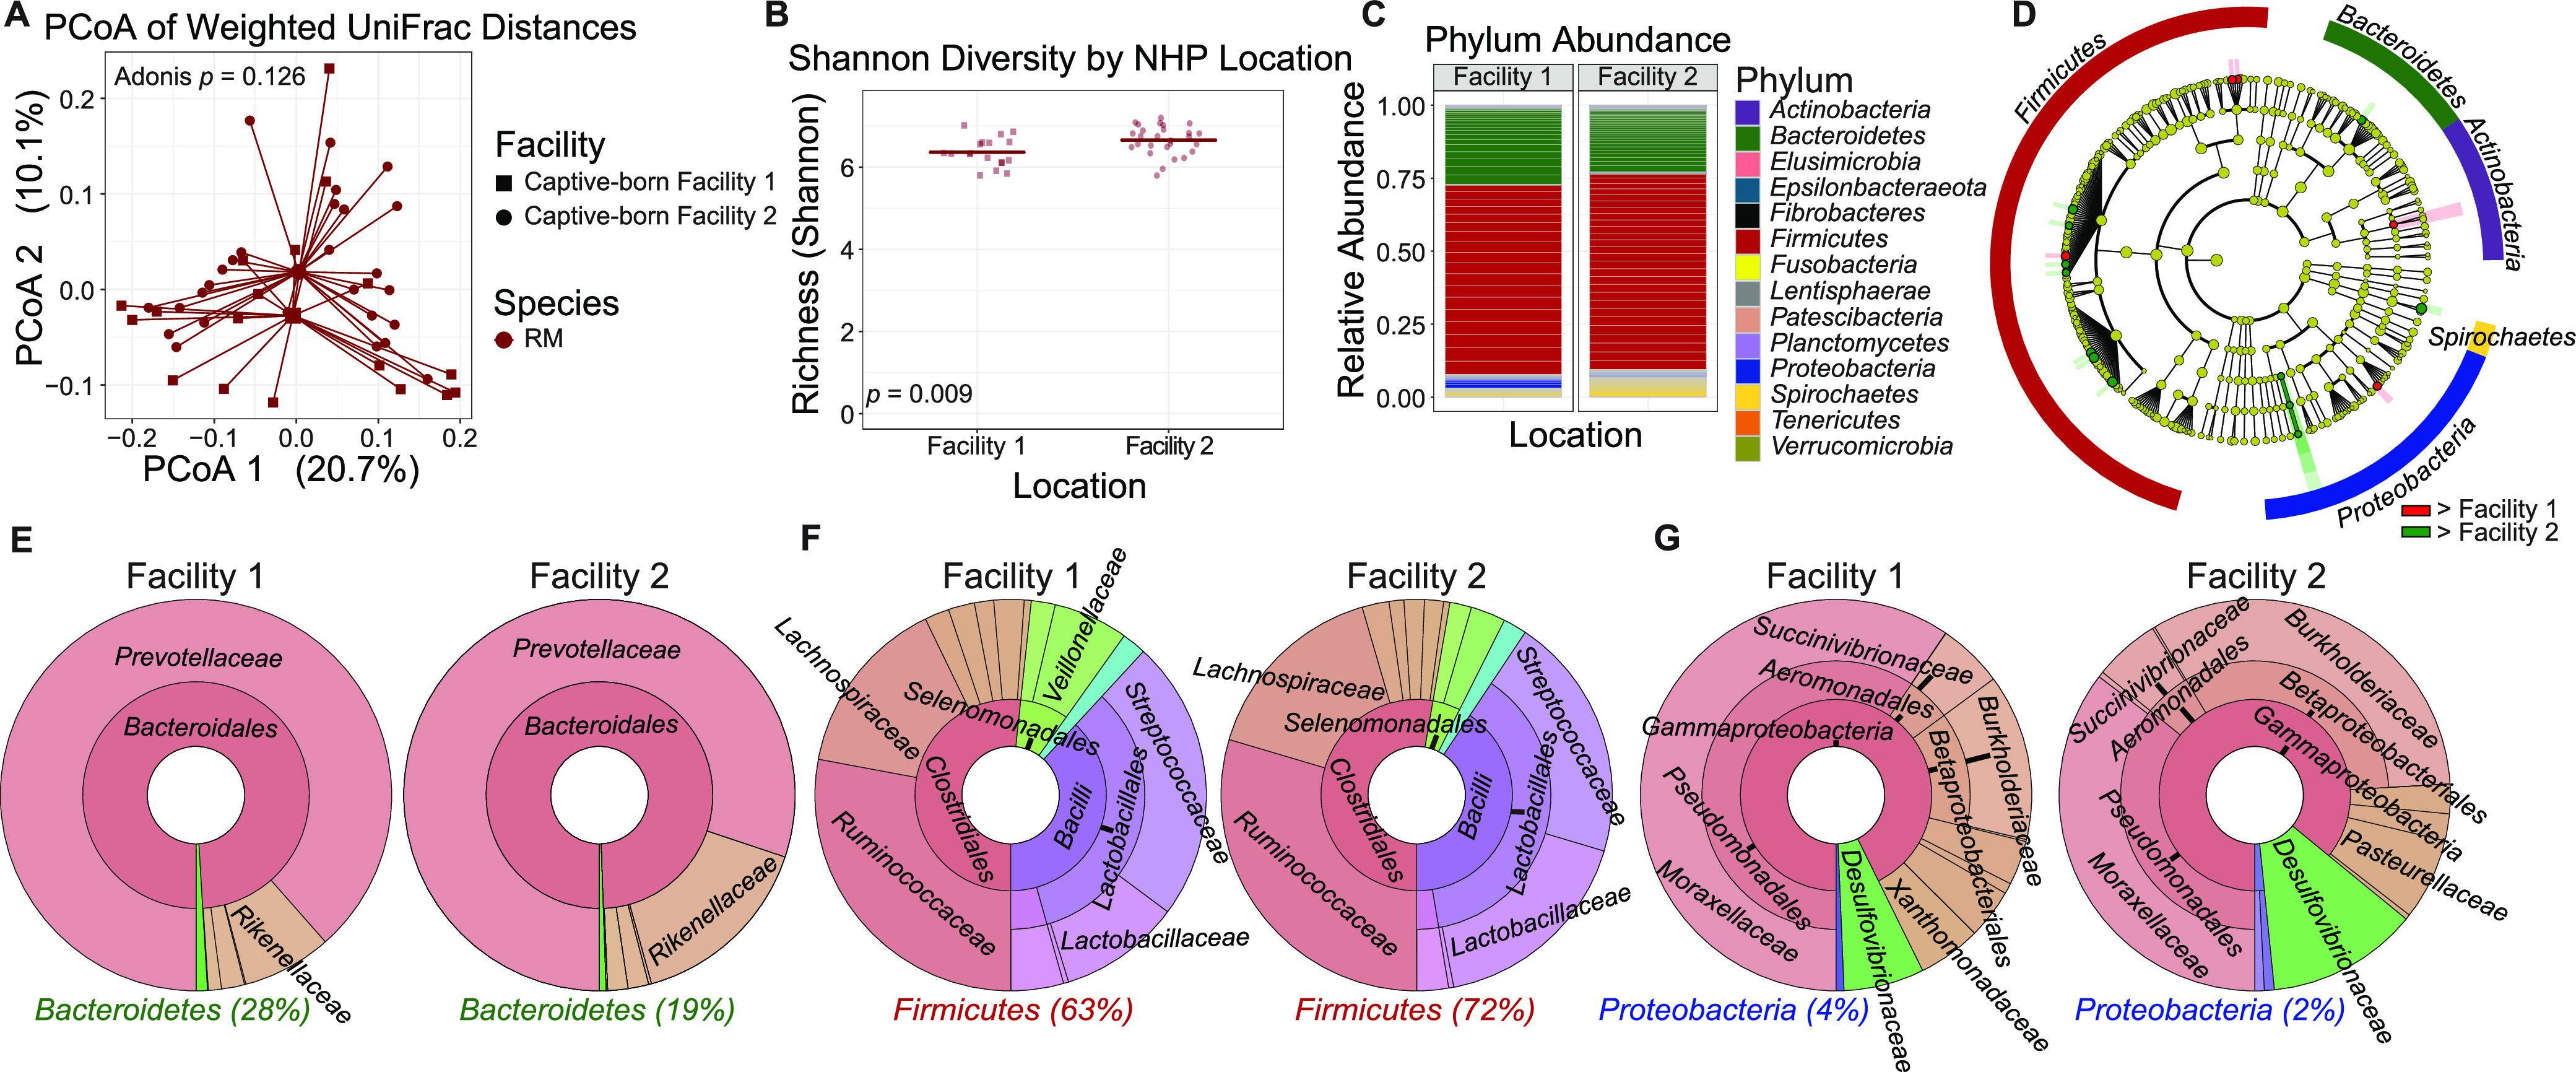
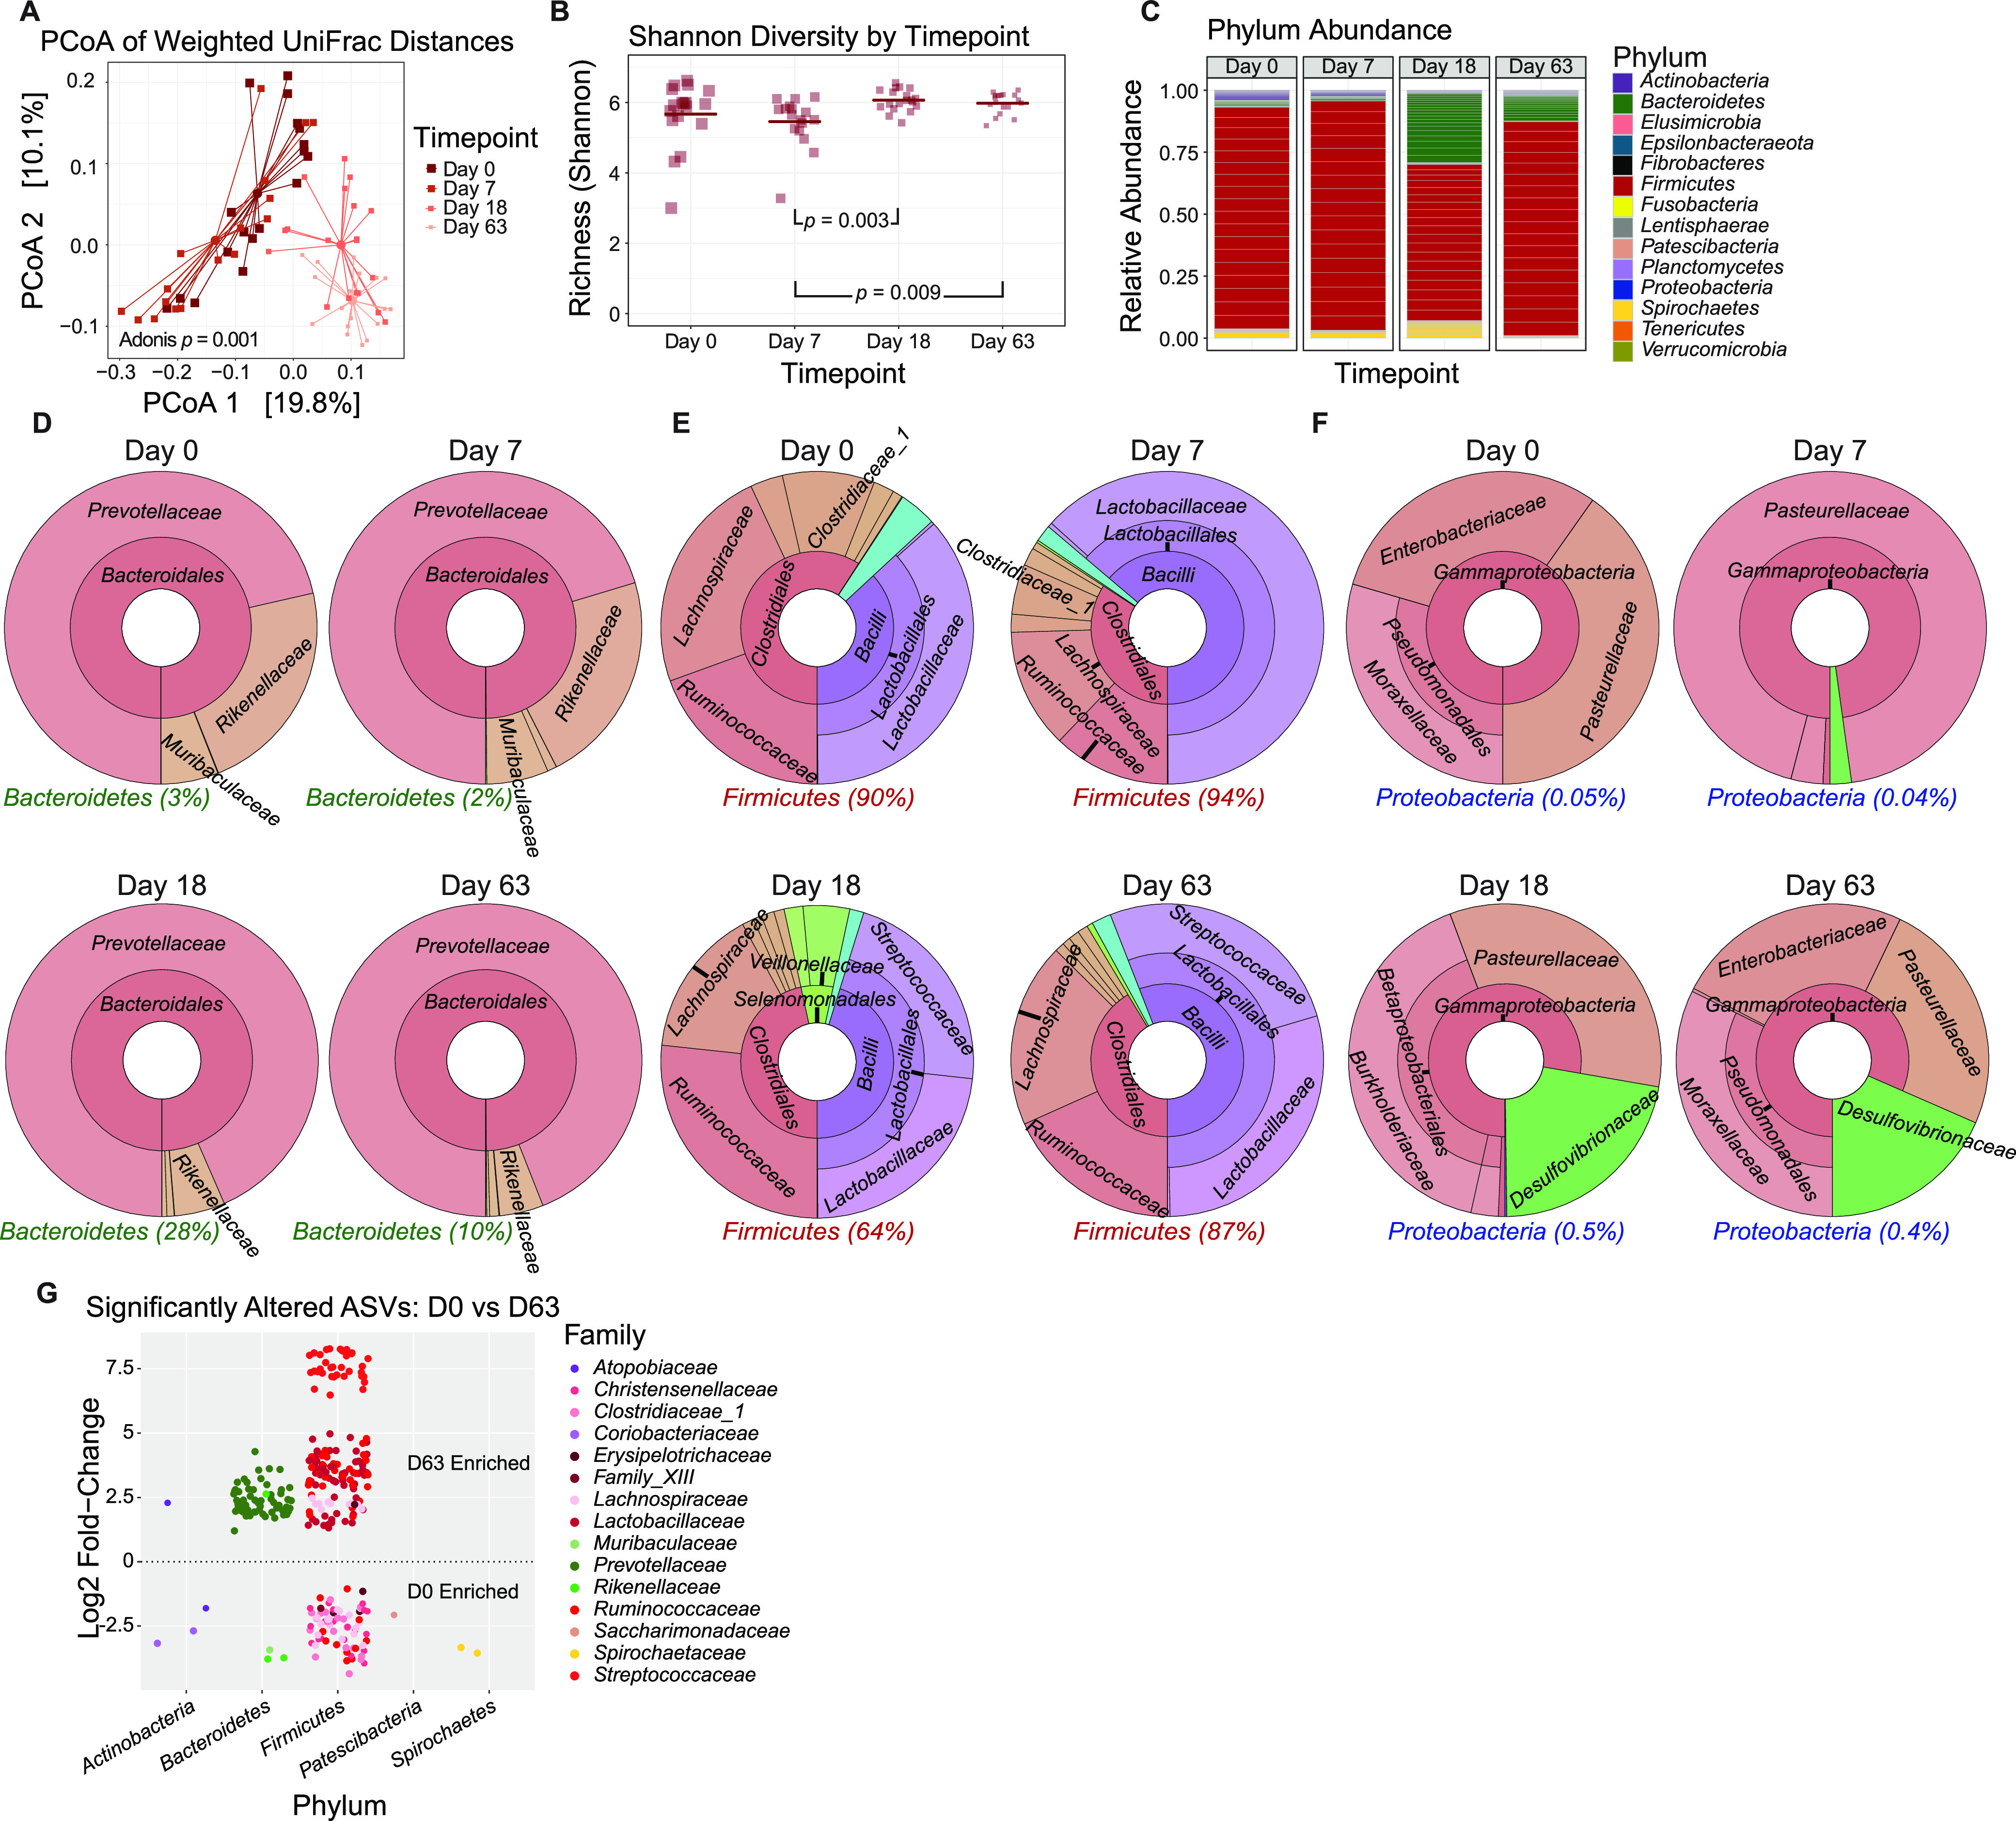
The bacterial component of the gastrointestinal tract microbiome is comprised of hundreds of species, the majority of which live in symbiosis with the host. The bacterial microbiome is influenced by host diet and disease history, and host genetics may additionally play a role. To understand the degree to which host genetics shapes the gastrointestinal tract microbiome, we studied fecal microbiomes in 4 species of nonhuman primates (NHPs) held in separate facilities but fed the same base diet. These animals include Chlorocebus pygerythrus, Chlorocebus sabaeus, Macaca mulatta, and Macaca nemestrina. We also followed gastrointestinal tract microbiome composition in 20 Macaca mulatta (rhesus macaques [RMs]) as they transitioned from an outdoor to indoor environment and compared 6 Chlorocebus pygerythrus monkeys that made the outdoor to indoor transition to their 9 captive-born offspring. We found that genetics can influence microbiome composition, with animals of different genera (Chlorocebus versus Macaca) having significantly different gastrointestinal (GI) microbiomes despite controlled diets. Animals within the same genera have more similar microbiomes, although still significantly different, and animals within the same species have even more similar compositions that are not significantly different. Significant differences were also not observed between wild-born and captive-born Chlorocebus pygerythrus, while there were significant changes in RMs as they transitioned into captivity. Together, these results suggest that the effects of captivity have a larger impact on the microbiome than other factors we examined within a single NHP species, although host genetics does significantly influence microbiome composition between NHP genera and species. IMPORTANCE Our data point to the degree to which host genetics can influence GI microbiome composition and suggest, within primate species, that individual host genetics is unlikely to significantly alter the microbiome. These data are important for the development of therapeutics aimed at altering the microbiome within populations of genetically disparate members of primate species.

Keywords: GI tract microbiome; host genetics; nonhuman primates.


Conflict of interest statement

The authors declare no conflict of interest.

Figures

FIG 1
FIG 1
Gut microbiomes by NHP genus differ significantly in β diversity. (A) Principal-coordinate analysis (PCoA) of weighted UniFrac distances (β diversity) of gut microbiota in Chlorocebus (n = 22) and Macaca (n = 61). Significance between NHP genera in fecal β diversity was assessed by Adonis. Lines represent the distance from each sample to the group’s centroid. (B) Shannon diversity (α diversity) comparison of fecal microbiome between NHP genera. Lines denote means. Significance between groups was determined by unpaired, two-way t test. (C) Relative abundance of bacterial families in NHP genera measured by 16S rRNA gene sequencing. Color is by phylum, and line divisions are by family. (D) LEfSe cladogram representing all taxa in the fecal microbiome down to the genus level, with red (greater in Chlorocebus) or green (greater in Macaca) nodes indicating significant differences. Gold nodes indicate no significant difference. Labels were restricted to phylum level for ease of visualization, full results of significant differences down to genus level are available in Fig. S1, and all OTUs examined are available in Table S1. (E to G) Krona plots representing relative frequency of fecal Bacteroidetes (E), Firmicutes (F), and Proteobacteria (G) subtaxa comprising ≥5% phylum composition to the family level. The shown taxa are collapsed to the lowest common taxon. The percentage given after phyla in panels E to G is the percentage of total bacteria that phylum made up in the group.
FIG 2
FIG 2
Gut microbiomes by Chlorocebus species differ significantly in β diversity. (A) Principal-coordinate analysis of weighted UniFrac distances (β diversity) of gut microbiota in sabaeus monkeys (n = 7) and vervets (n = 15). Significance between NHP species in fecal β diversity was assessed by Adonis. Lines represent the distance from each sample to the group’s centroid. (B) Shannon diversity (α diversity) comparison of fecal microbiomes between NHP species. Lines denote means. Significance between groups was determined by unpaired, two-way t test. (C) Relative abundance of bacterial families in NHP species measured by 16S rRNA gene sequencing. Color is by phylum, and line divisions are by family. (D) LEfSe cladogram representing all taxa in the fecal microbiome down to the genus level, with red (greater in sabaeus monkeys) or green (greater in vervets) nodes indicating significant differences. Gold nodes indicate no significant difference. Labels were restricted to the phylum level for ease of visualization. Full results of significant differences down to the genus level are available in Fig. S1, and all OTUs examined are available in Table S1. (E to G) Krona plots representing relative frequency of fecal Bacteroidetes (E), Firmicutes (F), and Proteobacteria (G) subtaxa comprising ≥5% phylum composition to the family level. Shown taxa are collapsed to the lowest common taxon. The percentage given after phyla in panels E to G is the percentage of total bacteria that phylum made up in the group.
FIG 3
FIG 3
Gut microbiomes by vervet birthplace are not significantly different. (A) Principal-coordinate analysis of weighted UniFrac distances (β diversity) of gut microbiota in vervets born in captivity (n = 9) and vervets born in the wild (n = 6). Significance between vervet groups in fecal β diversity was assessed by Adonis. Lines represent the distance from each sample to the group’s centroid. (B) Shannon diversity (α-diversity) comparison of fecal microbiome between vervet groups. Lines denote means. Significance between groups was determined by unpaired, two-way t test. (C) Relative abundance of bacterial families in vervet groups measured by 16S rRNA gene sequencing. Color is by phylum, and line divisions are by family. (D) LEfSe cladogram representing all taxa in the fecal microbiome down to the genus level, with red nodes (greater in captive-born vervets) indicating significant differences. Gold nodes indicate no significant difference. Labels were restricted to the phylum level for ease of visualization; full results of significant differences down to the genus level are available in Fig. S1, and all OTUs examined are available in Table S1. (E to G) Krona plots representing relative frequency of fecal Bacteroidetes (E), Firmicutes (F), and Proteobacteria (G) subtaxa comprising ≥5% phylum composition to the family level. Shown taxa are collapsed to the lowest common taxon. The percentage given after phyla in panels E to G is the percentage of total bacteria that phylum made up in the group. (H) Principal-coordinate analysis of weighted UniFrac distances of gut microbiota in vervets grouped by those related to one another (family 1, n = 2; family 2, n = 2; family 3, n = 3; family 4, n = 6; 2 vervets were not related to any others in the cohort). Significance between these groups was assessed by Adonis. Lines connect related vervets.
FIG 4
FIG 4
Gut microbiomes by Macaca species differ significantly in β diversity. (A) Principal-coordinate analysis of weighted UniFrac distances (β diversity) of gut microbiota in PTMs (n = 6) and RMs (n = 49). Significance between NHP species in fecal β diversity was assessed by Adonis. Lines represent the distance from each sample to the group’s centroid. (B) Shannon diversity (α diversity) comparison of fecal microbiomes between NHP species. Lines denote means. Significance between groups was determined by unpaired, two-way t test. (C) Relative abundance of bacterial families in NHP species measured by 16S rRNA gene sequencing. Color is by phylum, and line divisions are by family. (D) LEfSe cladogram representing all taxa in the fecal microbiome down to the genus level, with red (greater in PTM) or green (greater in RM) nodes indicating significant differences. Gold nodes indicate no significant difference. Labels were restricted to the phylum level for ease of visualization; full results of significant differences down to the genus level are available in Fig. S1, and all OTUs examined are available in Table S1. (E to G) Krona plots representing relative frequency of fecal Bacteroidetes (E), Firmicutes (F), and Proteobacteria (G) subtaxa comprising ≥5% phylum composition to the family level. Shown taxa are collapsed to the lowest common taxon. The percentage given after phyla in panels E to G is the percentage of total bacteria that phylum made up in the group.
FIG 5
FIG 5
Gut microbiomes by RM housing location are not significantly different. (A) Principal-coordinate analysis of weighted UniFrac distances (β diversity) of gut microbiota in RMs housed in facility 1 (n = 27) and RMs housed in facility 2 (n = 28). Significance between RM groups in fecal β diversity was assessed by Adonis. Lines represent the distance from each sample to the group’s centroid. (B) Shannon diversity (α diversity) comparison of fecal microbiomes between RM groups. Lines denote means. Significance between groups was determined by unpaired, two-way t test. (C) Relative abundance of bacterial families in RM groups measured by 16S rRNA gene sequencing. Color is by phylum, and line divisions are by family. (D) LEfSe cladogram representing all taxa in the fecal microbiome down to the genus level, with red (greater in facility 1 RMs) or green (greater in facility 2 RMs) nodes indicating significant differences. Gold nodes indicate no significant difference. Labels were restricted to the phylum level for ease of visualization; full results of significant differences down to the genus level are available in Fig. S1, and all OTUs examined are available in Table S1. (E to G) Krona plots representing relative frequency of fecal Bacteroidetes (E), Firmicutes (F), and Proteobacteria (G) subtaxa comprising ≥5% phylum composition to the family level. Shown taxa are collapsed to the lowest common taxon. The percentage given after phyla in panels E to G is the percentage of total bacteria that phylum made up in the group.
FIG 6
FIG 6
Gut microbiomes of RMs transitioning from a provisioned outdoor environment to research facilities change significantly. (A) Principal-coordinate analysis of weighted UniFrac distances (β diversity) of gut microbiota in RMs (n = 20) as they move from a provisioned outdoor environment (D0) to facility 2 (D63). Significance between RM time points in fecal β diversity was assessed by Adonis. Lines represent the distance from each sample to the group’s centroid. (B) Shannon diversity (α diversity) comparison of fecal microbiomes between RM time points. Lines denote means. Significance between time points was determined by unpaired, two-way t test performed between each time point. (C) Relative abundance of bacterial families in RM time points measured by 16S rRNA gene sequencing. Color is by phylum, and line divisions are by family. (D to F) Krona plots representing relative frequency of fecal Bacteroidetes (D), Firmicutes (E), and Proteobacteria (F) subtaxa comprising ≥5% phylum composition to the family level. Shown taxa are collapsed to the lowest common taxon. The percentage given after phyla in panels D to F is the percentage of total bacteria that phylum made up in the group. (G) limma analysis showing significantly altered ASVs between D0 and D63. The dashed line delineates increased from decreased abundance between time points.

References

    1. Ruan W, Engevik MA, Spinler JK, Versalovic J. 2020. Healthy human gastrointestinal microbiome: composition and function after a decade of exploration. Dig Dis Sci 65:695–705. doi: 10.1007/s10620-020-06118-4. - DOI - PubMed
    1. Adak A, Khan MR. 2019. An insight into gut microbiota and its functionalities. Cell Mol Life Sci 76:473–493. doi: 10.1007/s00018-018-2943-4. - DOI - PMC - PubMed
    1. Magnúsdóttir S, Ravcheev D, de Crécy-Lagard V, Thiele I. 2015. Systematic genome assessment of B-vitamin biosynthesis suggests co-operation among gut microbes. Front Genet 6:148. doi: 10.3389/fgene.2015.00148. - DOI - PMC - PubMed
    1. Dong TS, Gupta A. 2019. Influence of early life, diet, and the environment on the microbiome. Clin Gastroenterol Hepatol 17:231–242. doi: 10.1016/j.cgh.2018.08.067. - DOI - PMC - PubMed
    1. Goodrich JK, Waters JL, Poole AC, Sutter JL, Koren O, Blekhman R, Beaumont M, Van Treuren W, Knight R, Bell JT, Spector TD, Clark AG, Ley RE. 2014. Human genetics shape the gut microbiome. Cell 159:789–799. doi: 10.1016/j.cell.2014.09.053. - DOI - PMC - PubMed

Publication types

Substances

LinkOut - more resources