. 2023 Jan-Dec;15(1):2152526.
doi: 10.1080/19420862.2022.2152526.

Developability profiling of a panel of Fc engineered SARS-CoV-2 neutralizing antibodies

Affiliations

Developability profiling of a panel of Fc engineered SARS-CoV-2 neutralizing antibodies

Andrew Dippel et al. MAbs. 2023 Jan-Dec.

Abstract

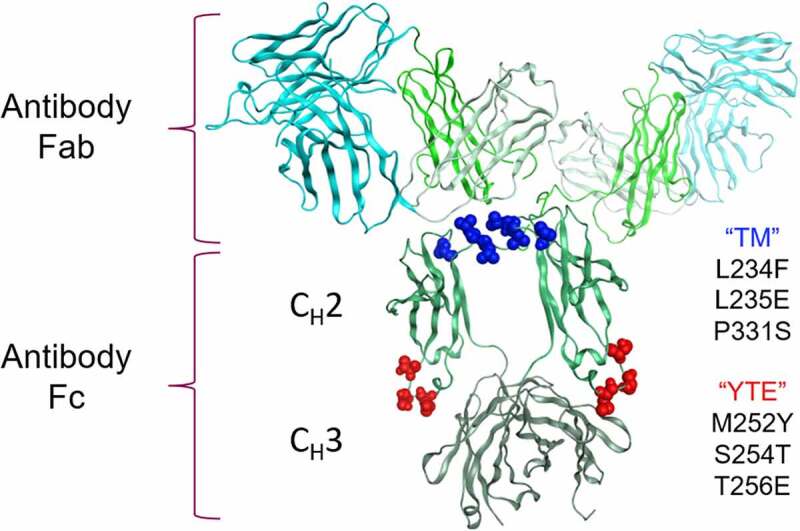
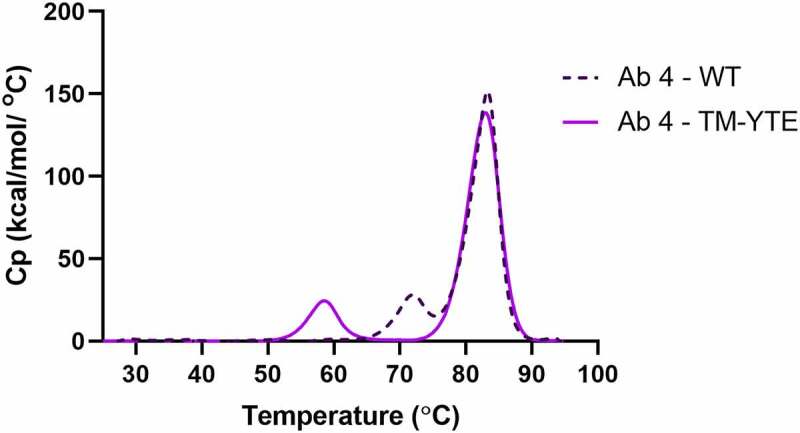
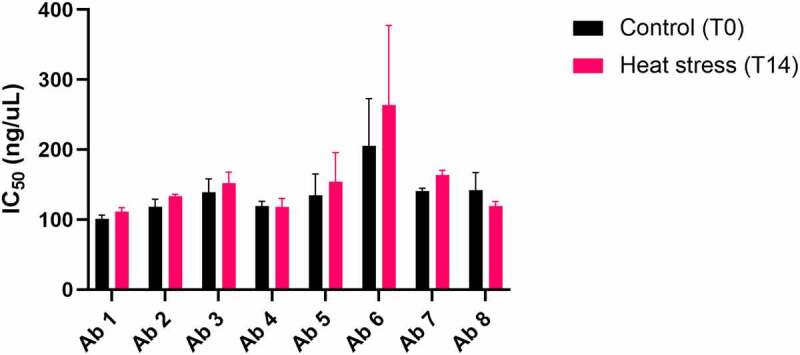
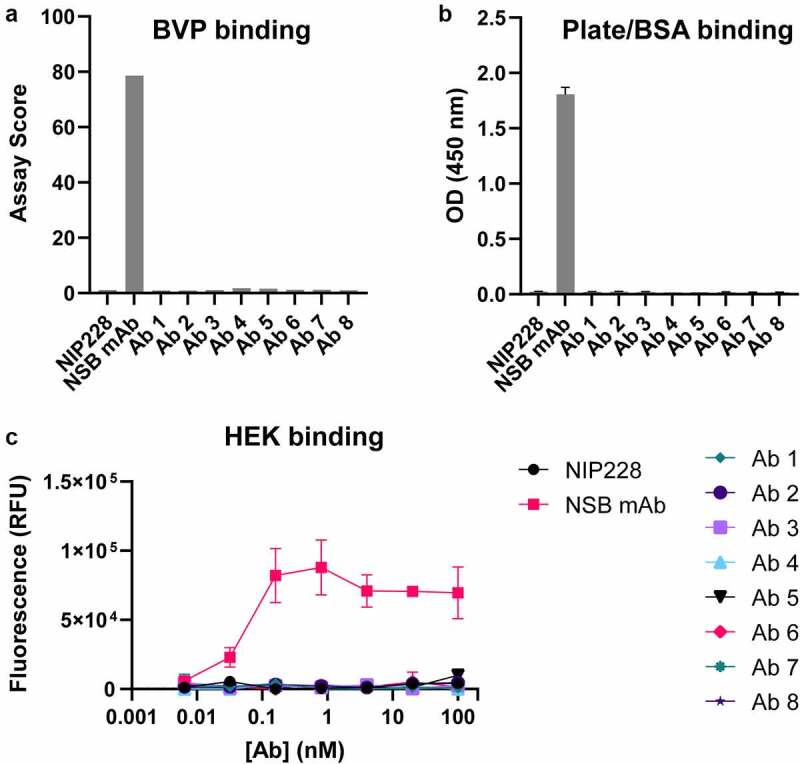
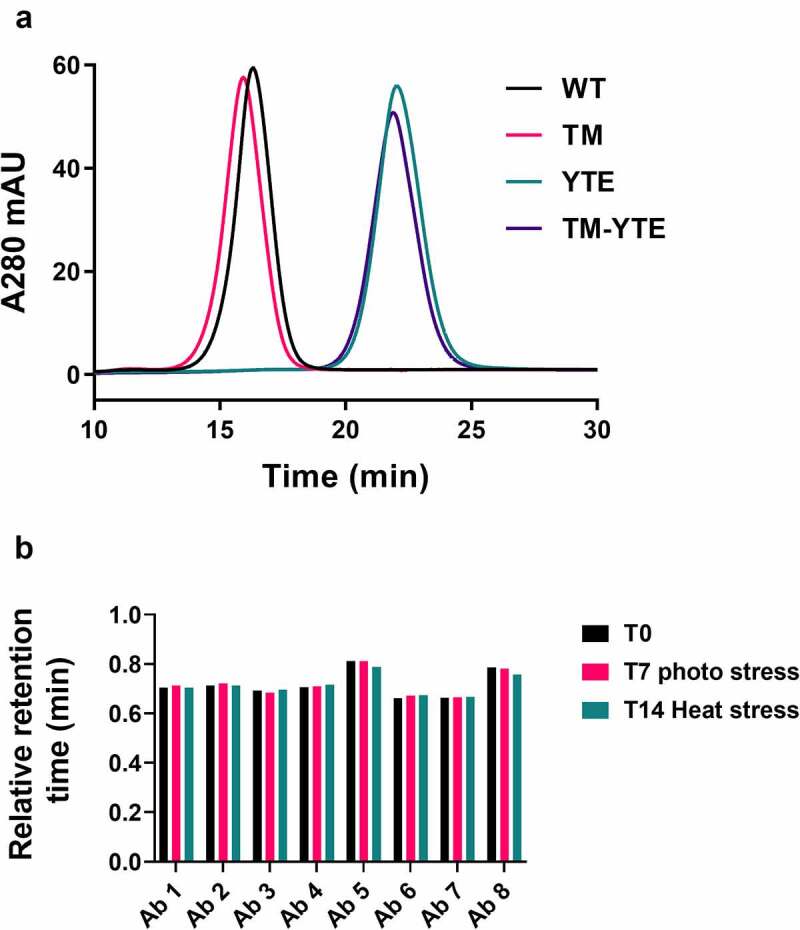
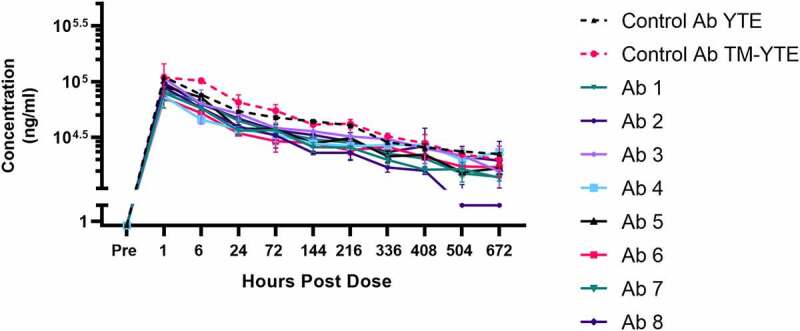
To combat the COVID-19 pandemic, potential therapies have been developed and moved into clinical trials at an unprecedented pace. Some of the most promising therapies are neutralizing antibodies against SARS-CoV-2. In order to maximize the therapeutic effectiveness of such neutralizing antibodies, Fc engineering to modulate effector functions and to extend half-life is desirable. However, it is critical that Fc engineering does not negatively impact the developability properties of the antibodies, as these properties play a key role in ensuring rapid development, successful manufacturing, and improved overall chances of clinical success. In this study, we describe the biophysical characterization of a panel of Fc engineered ("TM-YTE") SARS-CoV-2 neutralizing antibodies, the same Fc modifications as those found in AstraZeneca's Evusheld (AZD7442; tixagevimab and cilgavimab), in which the TM modification (L234F/L235E/P331S) reduce binding to FcγR and C1q and the YTE modification (M252Y/S254T/T256E) extends serum half-life. We have previously shown that combining both the TM and YTE Fc modifications can reduce the thermal stability of the CH2 domain and possibly lead to developability challenges. Here we show, using a diverse panel of TM-YTE SARS-CoV-2 neutralizing antibodies, that despite lowering the thermal stability of the Fc CH2 domain, the TM-YTE platform does not have any inherent developability liabilities and shows an in vivo pharmacokinetic profile in human FcRn transgenic mice similar to the well-characterized YTE platform. The TM-YTE is therefore a developable, effector function reduced, half-life extended antibody platform.

Keywords: COVID-19; Fc engineering; SARS-CoV2; TM; YTE; developability.


Conflict of interest statement

No potential conflict of interest was reported by the author(s).

Figures

Figure 1.
Figure 1.
Clustering of the TM-YTE modifications on the IgG1 structure. The TM (L234F/L235E/P331S, shown in dark blue spheres) and YTE (M252Y/S254T/T256E, shown in red spheres) Fc modifications were mapped onto the IgG1 structure (PDB ID 1HZH). The antibody Fab and Fc regions are marked as well as the Fc CH2 and CH3 domains. The antibody Fv is shown in cyan, and the constant domains are shown in different shades of green. Note that while both the TM and YTE modifications are in CH2, the TM modification cluster at the top of the CH2 domain near the hinge region in the binding regions for FcγRs and C1q while the YTE modification cluster near the CH3 domain in the binding region for FcRn. Ribbon diagram of an IgG1 crystal structure with the location of TM and YTE modification sites highlighted as spheres. Both modifications cluster in the Fc CH2 domain.
Figure 2.
Figure 2.
DSC profile overlay of a representative antibody in WT and TM-YTE format. Thermal stability of a representative antibody in WT and TM-YTE format was assessed by DSC. Introduction of TM-YTE modifications results in decreased thermal stability of CH2, as seen by the lower temperature for the first (Tm1) melting peak. A DSC graph plotting the melting temps of Ab 4 in WT format versus TM-YTE format. The Tm1 peak is ~58°C for the TM-YTE format and ~72°C for the WT format.
Figure 3.
Figure 3.
Antibody RBD binding relative potency after 14-day accelerated stability heat stress. Antibody binding to SARS-COV-2 RBD protein before (T0) and after (T14) heat stress at 45°C was compared using a DELFIA. Binding curves were generated for each antibody and used to calculate IC50 values for T0 and T14, which are shown. The average T0 and T14 IC50 values (ng/mL) from both experiments, respectively, are as follows: antibody 1 = (101.1, 111,5); antibody 2 = (118.6, 133.5); antibody 3 = (139.3, 152.3); antibody 4 = (119.4, 118.2); antibody 5 = (134.7, 154.2); antibody 6 = (205.6,263.7); antibody 7 = (140.8, 163.8); antibody 8 = (142.4,119.5). The experiment was run twice. Bars represent standard deviations. T0 and T14 values from both experiments were averaged and compared using a Student’s t-test. None of the antibodies showed a significant difference between T0 and T14. A bar graph plotting the binding potencies of Ab 1–8 before and after heat stress for 14 days. No significant change in potency is observed after heat stress.
Figure 4.
Figure 4.
SARS-CoV-2 TM-YTE antibodies do not show Nonspecific Binding (NSB) in BVP ELISA and HEK binding assay. (a+b) The TM-YTE antibody panel was tested for NSB in a BVP ELISA: (a) BVP assay score and (b) BSA or plate binding of the TM-YTE antibody panel. (c) HEK binding assay. NIP228 is a negative control antibody that exhibits low NSB in these assays, and NSB mAb is a positive control antibody that exhibits high NSB in these assays. Assays were repeated three times, representative graphs are shown. Bars represent standard deviations. (a) A bar graph plotting the BVP binding assay score of Ab 1–8 compared to positive control (“NSB mAb”) and negative control (NIP228) antibodies. Assay score for Ab 1–8 is similar to negative control. (b) A bar graph plotting the plate/BSA binding OD (450 nm) of Ab 1–8 compared to positive (“NSB mAb”) and negative control (NIP228) antibodies. The OD of Ab 1–8 is similar to negative control. (c) A line graph plotting the HEK binding assay fluorescent signal versus antibody concentration for Ab 1–8 compared to positive (“NSB mAb”) and negative control (NIP228) antibodies. The fluorescent signal of Ab 1–8 is similar to negative control.
Figure 5.
Figure 5.
FcRn affinity chromatography of the TM-YTE antibody panel. (a) As an example of how TM-YTE modifications affect FcRn binding, the elution profile of antibody 4 in the different Fc formats from an FcRn affinity column is shown. A later elution time indicates stronger FcRn binding. (b) FcRn binding of un-stressed, photo-stressed or heat-stressed antibodies was analyzed using FcRn affinity column. The retention time on the column was normalized between runs as described in the methods section to a well behaved YTE control antibody. A relative retention time of 1 would indicate equal FcRn binding to the control YTE antibody. (a) SEC chromatogram plotting absorbance at 280 nm versus time for Ab4 in WT, TM, YTE, and TM-YTE formats. TM and WT formats elute earlier compared to YTE and TM-YTE formats. (b) A bar graph plotting the relative retention time of Ab 1–8 after no stress, 7 day photo stress, or 14 day heat stress. No significant difference is observed between different conditions.
Figure 6.
Figure 6.
Serum concentration curves of the TM-YTE antibodies in human FcRn transgenic mice. Mean concentrations of the TM-YTE antibody panel and a well characterized control antibody in human FcRn transgenic Tg32 mouse serum following a single IV injection of 5 mg/kg are shown. Bars represent standard deviations. Pharmacokinetic parameters can be found in supplementary Table 1. A line graph plotting the mean serum concentration vs hours post dose following a single IV injection of 5 mg/kg antibody into human FcRn transgenic Tg32 mice. Test Ab1-8 are compared to control mAbs in YTE and TM-YTE formats. Beginning at 504 hr post dose, Ab 2 begins to show significantly reduced serum concentration compared to the controls and other test Abs.

References

    1. Ferrara C, Grau S, Jager C, Sondermann P, Brunker P, Waldhauer I, Hennig M, Ruf A, Rufer AC, Stihle M, et al. Unique carbohydrate-carbohydrate interactions are required for high affinity binding between FcgammaRIII and antibodies lacking core fucose. Proc Natl Acad Sci U S A. 2011;108(31):12669–15. doi:10.1073/pnas.1108455108. - DOI - PMC - PubMed
    1. Lazar GA, Dang W, Karki S, Vafa O, Peng JS, Hyun L, Chan C, Chung HS, Eivazi A, Yoder SC, et al. Engineered antibody Fc variants with enhanced effector function. Proc Natl Acad Sci U S A. 2006;103(11):4005–10. doi:10.1073/pnas.0508123103. - DOI - PMC - PubMed
    1. Wilkinson I, Hale G.. Systematic analysis of the varied designs of 819 therapeutic antibodies and Fc fusion proteins assigned international nonproprietary names. MAbs. 2022;14(1):2123299. doi:10.1080/19420862.2022.2123299. - DOI - PMC - PubMed
    1. Chen X, Song X, Li K, Zhang T. FcgammaR-binding is an important functional attribute for immune checkpoint antibodies in cancer immunotherapy. Front Immunol. 2019;10:292. doi:10.3389/fimmu.2019.00292. - DOI - PMC - PubMed
    1. Eroshenko N, Gill T, Keaveney MK, Church GM, Trevejo JM, Rajaniemi H. Implications of antibody-dependent enhancement of infection for SARS-CoV-2 countermeasures. Nat Biotechnol. 2020;38(7):789–91. doi:10.1038/s41587-020-0577-1. - DOI - PubMed

Publication types

Substances