. 2022 Dec 7;22(1):385.
doi: 10.1186/s12935-022-02809-2.

METTL3 promotes glycolysis and cholangiocarcinoma progression by mediating the m6A modification of AKR1B10

Affiliations

METTL3 promotes glycolysis and cholangiocarcinoma progression by mediating the m6A modification of AKR1B10

Jingli Cai et al. Cancer Cell Int. .

Abstract

Objective: N6-methyladenosine (m6A) RNA methylation is involved in governing the mechanism of tumor progression. We aimed to excavate the biological role and mechanism of the m6A methyltransferase METTL3 in cholangiocarcinoma (CCA).

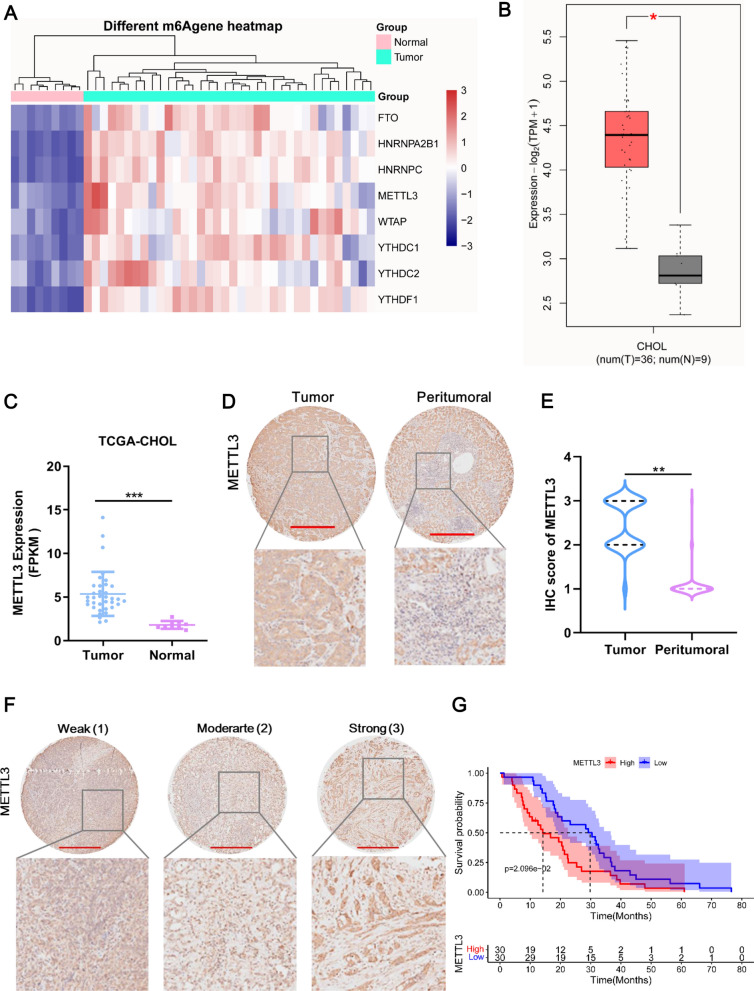
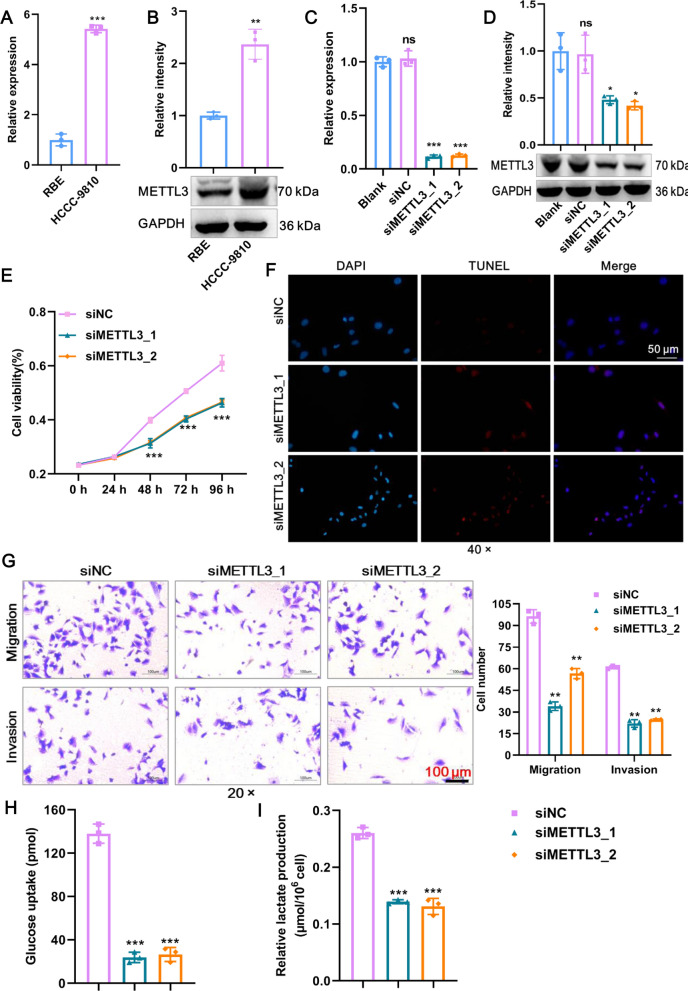
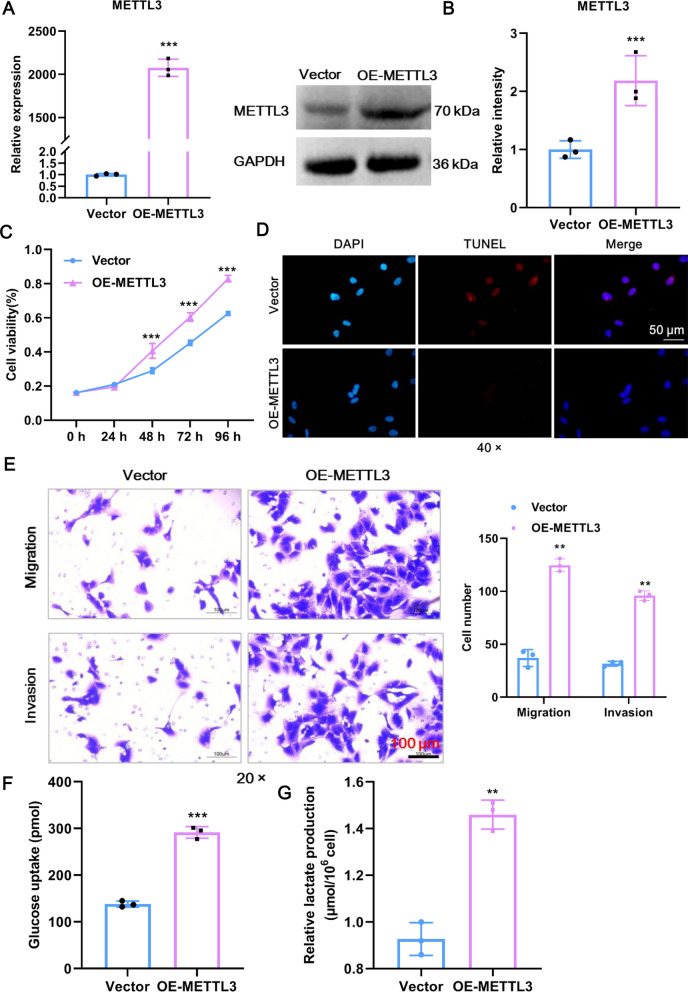
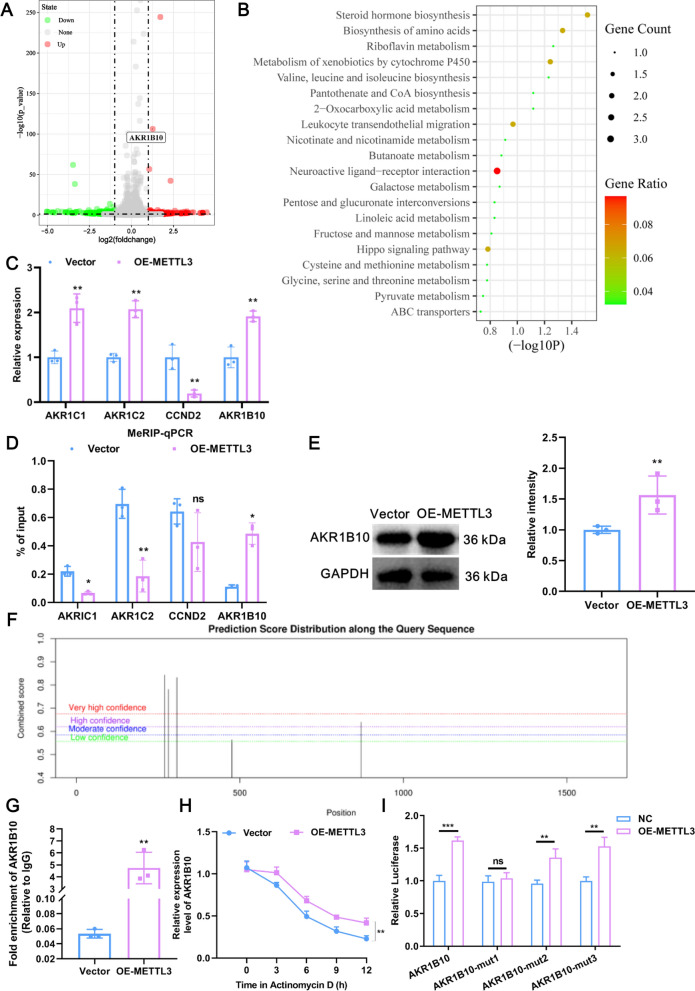
Methods: METTL3 expression was determined by database and tissue microarray analyses. The role of METTL3 in CCA was explored by loss- and gain-of-function experiments. The m6A target of METTL3 was detected by RNA sequencing. The role of AKR1B10 in CCA was explored, and the association between METTL3 and AKR1B10 was confirmed by rescue experiments.

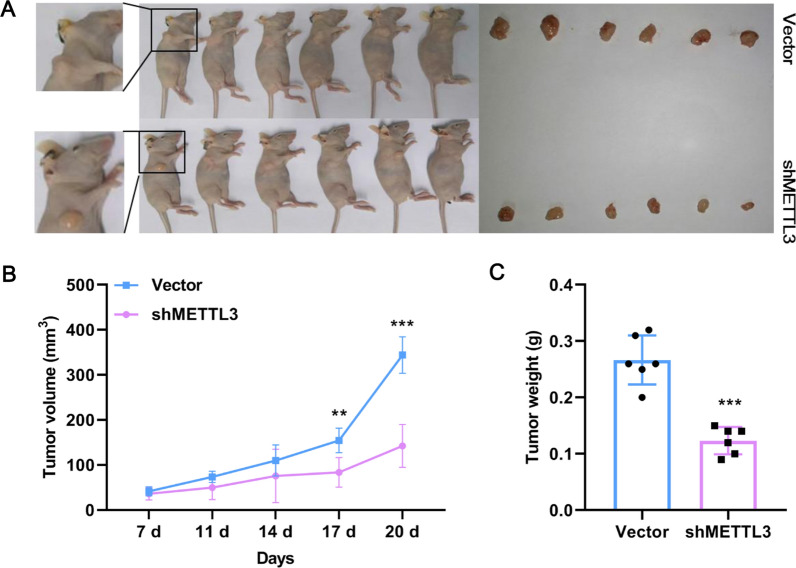
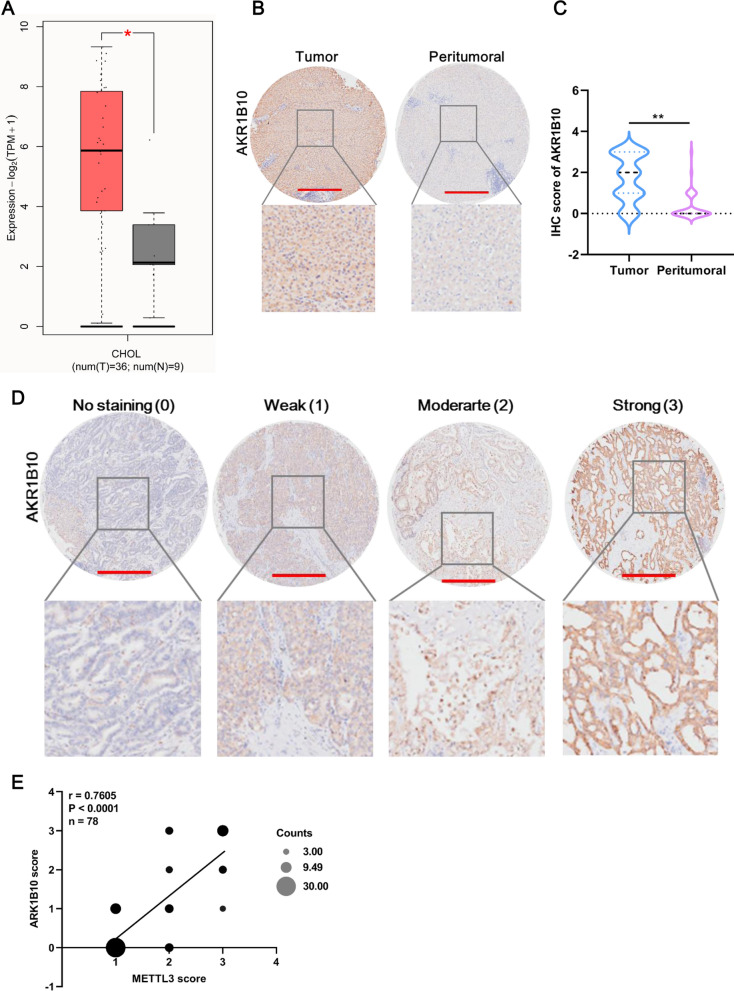
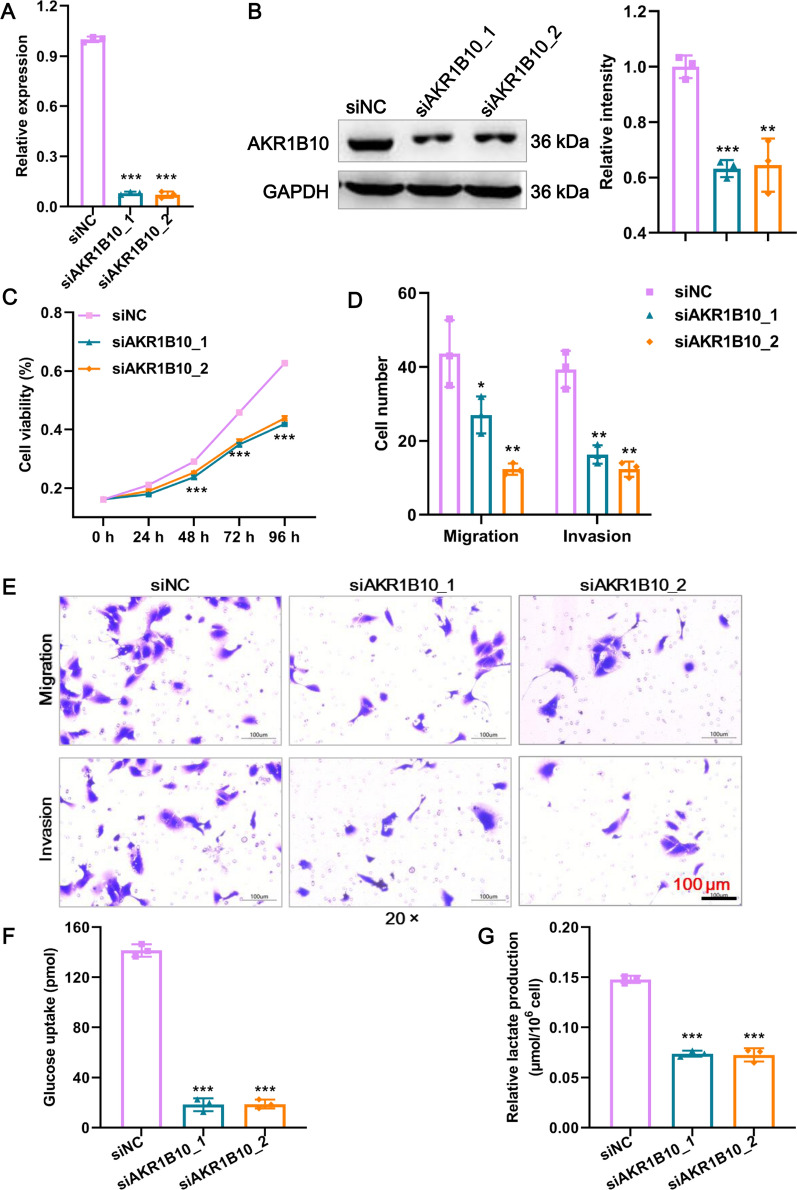
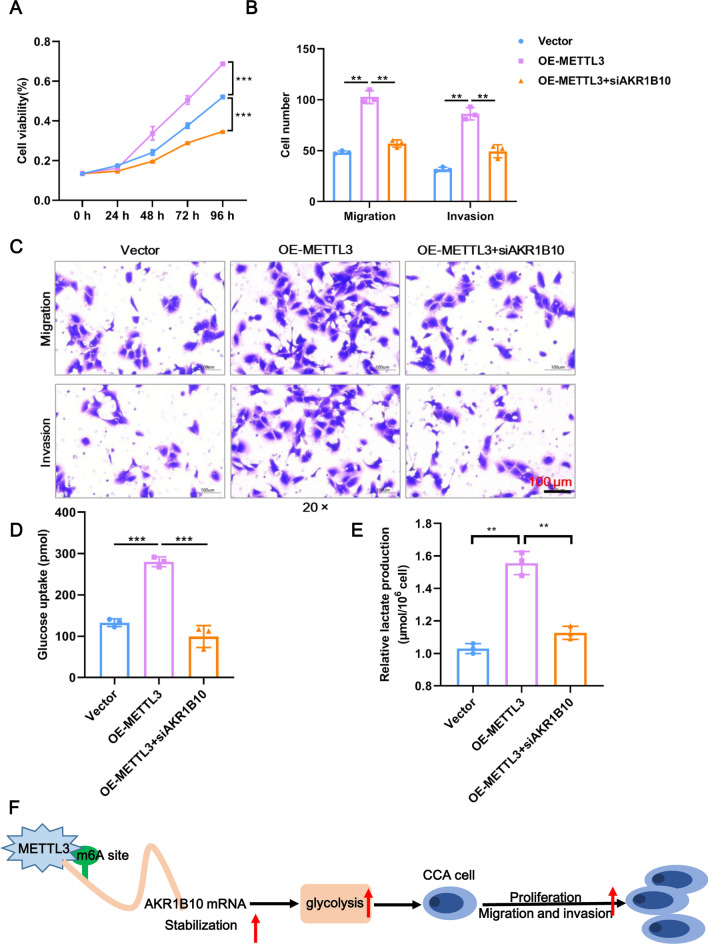
Result: METTL3 expression was upregulated in CCA tissue, and higher METTL3 expression was implicated in poor prognoses in CCA patients. Overexpression of METTL3 facilitated proliferation, migration, invasion, glucose uptake, and lactate production in CCA cells, whereas knockdown of METTL3 had the opposite effects. We further found that METTL3 deficiency inhibited CCA tumor growth in vivo. RNA sequencing and MeRIP-qPCR confirmed that METTL3 enhanced AKR1B10 expression and m6A modification levels. Furthermore, METTL3 directly binds with AKR1B10 at an m6A modification site. A CCA tissue microarray showed that AKR1B10 expression was upregulated in CCA tissue and that silencing AKR1B10 suppressed the malignant phenotype mentioned above in CCA. Notably, knockdown of AKR1B10 rescued the tumor-promoting effects induced by METTL3 overexpression.

Conclusion: Elevated METTL3 expression promotes tumor growth and glycolysis in CCA through m6A modification of AKR1B10, indicating that METTL3 is a potential target for blocking glycolysis for application in CCA therapy.

Keywords: AKR1B10; Cholangiocarcinoma; Glycolysis; METTL3.


Conflict of interest statement

The authors declare no competing interests.

Figures

Fig. 1
Fig. 1
METTL3 expression is upregulated in CCA tissues. A Heatmap of m6A methylation-related differentially expressed mRNAs between CCA tissues and normal tissues. These differentially expressed mRNAs were identified by using TCGA-CHOL data. Red and blue indicate upregulated and downregulated mRNAs in CCA tissue compared with normal tissue, respectively. B METTL3 expression in the GEPIA2 dataset. The red box indicates CCA tumor tissue, and the gray box indicates normal tissue. C METTL3 expression in the TCGA-CHOL dataset. Tumor tissue, n = 36, normal tissue, n = 9. D Representative image of METTL3 expression in tumor and peritumoral tissue in the CCA tissue microarray. Compared with peritumoral tissues, METTL3 was overexpressed in CCA tissues, as revealed by IHC staining for METTL3 in a CCA tissue microarray (n = 60). Scale bar: 500 μm. E The METTL3 score in CCA tissues was significantly higher than that in peritumoral tissues. The sample sizes were 60 for the CCA tumor and peritumoral tissues. F Representative image of METTL3 expression at three levels in the CCA tissue microarray. METTL3 expression was scored at three levels (weak, moderate, and strong) on the basis of IHC staining intensity. Scale bar: 500 μm. G The overall survival analysis showed that high expression of METTL3 (red line) indicated a poor prognosis in patients with CCA. The median was used to define the cutoff, which was less than 3 for the low group. *Means P < 0.05, **means P < 0.01, ***means P < 0.001
Fig. 2
Fig. 2
METTL3 promotes glycolysis and the malignant phenotype of CCA cells in vitro. A METTL3 mRNA expression in HCCC-9810 cells and RBE cells was detected by RT‒qPCR. B METTL3 protein expression in HCCC-9810 cells and RBE cells was detected by western blot. C The knockdown efficacy of two siRNAs against METTL3 mRNA expression in HCCC-9810 cells was confirmed by RT‒qPCR. D The knockdown efficacy of two siRNAs against METTL3 protein expression in HCCC-9810 cells was confirmed by western blot. E The proliferation of HCCC-9810 cells after knockdown of METTL3 was detected by CCK8. F TUNEL staining was used to detect HCCC-9810 cell apoptosis after METTL3 knockdown. Scale bar: 50 μm. G The migration and invasion of HCCC-9810 cells after METTL3 knockdown were detected by Transwell assays. The numbers of migrating and invading cells were counted for comparison. Scale bar: 100 μm. H Glucose uptake of HCCC-9810 cells after knockdown of METTL3 was detected using a commercial kit. I Lactate production in HCCC-9810 cells after knockdown of METTL3. **Means P < 0.01, ***means P < 0.001
Fig. 3
Fig. 3
AKR1B10 promotes glycolysis and the malignant phenotype of CCA cells in vitro. A The overexpression efficacy of METTL3 mRNA expression in RBE cells was confirmed by RT‒qPCR. B The overexpression efficacy of METTL3 protein expression in RBE cells was confirmed by western blot. C The proliferation of RBE cells after overexpression of METTL3 was detected by CCK8. D TUNEL staining was used to detect RBE cell apoptosis after overexpression of METTL3. Scale bar: 50 μm. E The migration and invasion of RBE cells after overexpression of METTL3 were detected by Transwell assays. The numbers of migrating and invading cells were counted for comparison. Scale bar: 100 μm. F Glucose uptake of RBE cells after overexpression of METTL3 was detected using a commercial kit. (G) Lactate production in RBE cells after overexpression of METTL3. **Means P < 0.01, ***means P < 0.001
Fig. 4
Fig. 4
METTL3 promotes CCA tumor growth. A Representative image of mice. Knockdown of METTL3 effectively suppressed HCCC-9810 CCA cell subcutaneous tumor growth in nude mice (6 mice per group). B The relative tumor volume of mice (6 mice per group) was calculated every 3 days. C The tumor weight of mice (6 mice per group) was calculated. **Means P < 0.01, ***means P < 0.001
Fig. 5
Fig. 5
Whole-transcriptome sequencing reveals that AKR1B10 is a target of METTL3. A Volcano plots showing DEGs between METTL3-overexpressed and Vector groups by transcriptome sequencing in RBE cells (n = 3). Red dots means gene upregulated in METTL3-overexpressed group compared with the Vector group, such as AKR1B10; green dots means downregulated in METTL3-overexpressed group compared with the Vector group. B Bubble plot of KEGG enrichment of the upregulated DEGs between the METTL3-overexpressed and Vector groups in RBE cells. C RT‒qPCR verification of transcriptome sequencing results. Four upregulated DEGs between the METTL3-overexpressed and Vector groups were selected. D The results of MeRIP-qPCR in the OE-METTL3 and Vector groups for four candidate DEGs. E The protein expression of AKR1B10 in RBE cells upon METTL3 overexpression was detected by western blotting. F Five potential m6A modification sites on AKR1B10 mRNA predicted by the SRAMP database. G The binding relationship between METTL3 and AKR1B10 was detected by RIP assays. H The effect of METTL3 overexpression on the stability of AKR1B10 mRNA was measured by actinomycin D. I The m6A modification site of METTL3 on AKR1B10 mRNA was explored by using a luciferase reporter assay. ns means P > 0.05, *Means P < 0.05, **means P < 0.01, ***means P < 0.001
Fig. 6
Fig. 6
AKR1B10 is highly expressed in CCA tissues. A AKR1B10 expression in the GEPIA2 dataset. The red box indicates tumor tissue, and the gray box indicates normal tissue. B Representative image of AKR1B10 expression in tumor and peritumoral tissue in the CCA tissue microarray. Compared with that in peritumoral tissues, AKR1B10 was overexpressed in CCA tissues, as revealed by IHC staining for AKR1B10 in a CCA tissue microarray (n = 60). Scale bar: 500 μm. C The AKR1B10 score in CCA tissues was significantly higher than that in peritumoral tissues. The sample sizes were 60 in CCA tumor and peritumoral tissues. D Representative image of AKR1B10 expression at four levels in the CCA tissue microarray. AKR1B10 expression was scored at four levels (no staining, weak, moderate, strong) on the basis of IHC staining intensity. Scale bar: 500 μm. E Pearson correlation analysis of the IHC scores between METTL3 and AKR1B10. *Means P < 0.05, **means P < 0.01
Fig. 7
Fig. 7
AKR1B10 promotes glycolysis and the malignant phenotype of CCA cells in vitro. A The knockdown efficacy of two siRNAs against AKR1B10 mRNA expression in RBE cells was confirmed by RT‒qPCR. B The knockdown efficacy of two siRNAs against AKR1B10 protein expression in RBE cells was confirmed by western blot. C The proliferation of RBE cells after AKR1B10 knockdown was detected by CCK8 assay. D Statistical results of Transwell assays. The numbers of migrating and invading cells were counted for comparison. E The migration and invasion of RBE cells after AKR1B10 knockdown were detected by Transwell assays. Scale bar: 100 μm. F Glucose uptake of RBE cells after AKR1B10 knockdown was detected using a commercial kit. G Lactate production in RBE cells after AKR1B10 knockdown. *Means P < 0.05, **means P < 0.01, ***means P < 0.001
Fig. 8
Fig. 8
METTL3 exerts an oncogenic role in CCA through AKR1B10. A The proliferation of RBE cells after knockdown of AKR1B10 upon METTL3 overexpression was detected by CCK8 assay. B Statistical results of Transwell assays. The numbers of migrating and invading cells were counted for comparison. C The migration and invasion of RBE cells after knockdown of AKR1B10 upon METTL3 overexpression were detected by Transwell assays. Scale bar: 100 μm. D Glucose uptake of RBE cells after knockdown of AKR1B10 upon METTL3 overexpression was detected using a commercial kit. E Lactate production in RBE cells after knockdown of AKR1B10 upon METTL3 overexpression. *Means P < 0.05, **means P < 0.01, ***means P < 0.001

References

    1. Krasinskas AM. Cholangiocarcinoma. Surg Pathol Clin. 2018;11:403–429. doi: 10.1016/j.path.2018.02.005. - DOI - PubMed
    1. de Jong MC, Marques H, Clary BM, Bauer TW, Marsh JW, Ribero D, Majno P, Hatzaras I, Walters DM, Barbas AS, et al. The impact of portal vein resection on outcomes for hilar cholangiocarcinoma: a multi-institutional analysis of 305 cases. Cancer. 2012;118:4737–4747. doi: 10.1002/cncr.27492. - DOI - PubMed
    1. Khan AS, Dageforde LA. Cholangiocarcinoma. Surg Clin North Am. 2019;99:315–335. doi: 10.1016/j.suc.2018.12.004. - DOI - PubMed
    1. Yang PC, Chen YJ, Li XY, Hsiao CY, Cheng BB, Gao Y, Zhou BZ, Chen SY, Hu SQ, Zeng Q, et al. Irreversible electroporation treatment with intraoperative biliary stenting for unresectable perihilar cholangiocarcinoma: a pilot study. Front Oncol. 2021;11:710536. doi: 10.3389/fonc.2021.710536. - DOI - PMC - PubMed
    1. Wang X, Lu Z, Gomez A, Hon GC, Yue Y, Han D, Fu Y, Parisien M, Dai Q, Jia G, et al. N6-methyladenosine-dependent regulation of messenger rna stability. Nature. 2014;505:117–120. doi: 10.1038/nature12730. - DOI - PMC - PubMed

LinkOut - more resources