. 2022 Dec 7;12(1):21179.
doi: 10.1038/s41598-022-22056-9.

A vector-agent approach to (spatiotemporal) movement modelling and reasoning

Affiliations

A vector-agent approach to (spatiotemporal) movement modelling and reasoning

Saeed Rahimi et al. Sci Rep. .

Abstract

Modelling a complex system of autonomous individuals moving through space and time essentially entails understanding the (heterogeneous) spatiotemporal context, interactions with other individuals, their internal states and making any underlying causal interrelationships explicit, a task for which agents (including vector-agents) are specifically well-suited. Building on a conceptual model of agent space-time and reasoning behaviour, a design guideline for an implemented vector-agent model is presented. The movement of football players was chosen as it is appropriately constrained in space, time and individual actions. Sensitivity-variability analysis was applied to measure the performance of different configurations of system components on the emergent movement patterns. The model output varied more when the condition of the contextual actors (players' role-areas) was manipulated. The current study shows how agent-based modelling can contribute to our understanding of movement and how causally relevant evidence can be produced, illustrated through a spatiotemporally constrained football case-study.


Conflict of interest statement

The authors declare no competing interests.

Figures
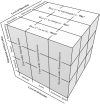
Figure 1
Figure 1
The conceptual representation of intelligent agent queries, given its: state of attributes, interactions with the environmental actors, and relations with other autonomous agents over space and time, and to differing levels of causal analysis, from.
Figure 2
Figure 2
The structure of the model. Adapted with permission from S.C. Ahearn, J.L.D. Smith, A.R. Joshi and J. Ding, Ecological Modelling; Elsevier, 2001.
Figure 3
Figure 3
Six examples of the assumed spatial restrictions (role-boxes) for agents. The measurements are relative to a Cartesian coordinate system with the origin point at the middle of the pitch (from). Team A and Team B are represented in blue and red, respectively.
Figure 4
Figure 4
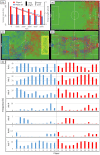
The frequency of executed actions, aggregated from all players in each time steps. The Y axis shows the percentage of each action executed by all players at each time step (X axis). The mean standard deviation of all actions from tick 1–5000, and from 5001 to 10000 are represented in the figure. Actions are abbreviated as follows: move randomly (Act-1), mark the nearest opponent (Act-2), get possession of the ball (Act-3), carry the ball (Act-4), pass the ball (Act-5), shoot the ball (Act-6), open-up the space (Act-7).
Figure 5
Figure 5
The results of three sets of tests verifying that the players comply with the model specification: (A) energy level and step-length (the travelled distance in each time step); (B) trajectories of two players, constrained with the zero-order causes; (C) trajectories of 4 players, constrained with first-order causes; (D) trajectories of 22 players, constrained with all three causal-factors; (E) players’ decisions on the executed actions. Note that the Y axis in E is represented in different scales due to the various frequency of the executed actions (e.g., the number of times that players possess the ball, so need to execute Act-4 to 6, is much smaller than other actions). Actions are abbreviated as follows: move randomly (Act-1), mark the nearest opponent (Act-2), get possession of the ball (Act-3), carry the ball (Act-4), pass the ball (Act-5), shoot the ball (Act-6), open-up the space (Act-7).
Figure 6
Figure 6
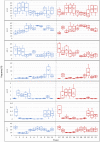
The variation of executed actions over all configurations, at individual-level. Note that the Y axis is represented with different scales due to the various frequency of the executed actions. Act-4 to 6, for example, do not get executed often because they require players to possess the ball. The middle horizontal line and the cross sign, respectively, represent the median and mean of each action across all configurations. Actions are abbreviated as follows: move randomly (Act-1), mark the nearest opponent (Act-2), get possession of the ball (Act-3), carry the ball (Act-4), pass the ball (Act-5), shoot the ball (Act-6), open-up the space (Act-7).
Figure 7
Figure 7
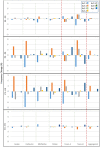
The variation of executed actions over different parameter settings in comparison to the default configuration (C1), at role-, team-, and aggregated-level. Actions are abbreviated as follows: move randomly (Act-1), mark the nearest opponent (Act-2), get possession of the ball (Act-3), carry the ball (Act-4), pass the ball (Act-5), shoot the ball (Act-6), open-up the space (Act-7). The configurations are as follows: default (C1), zero energy consumption (C2), changed formation for Team B (C3), changed formation for Team A (C4), and alternative marking strategies (C5).
Figure 8
Figure 8
Player 10’s relative distance and orientation towards the ball and Player 17. The relative orientation is represented in 36 classes, 10 degrees in each class. For example, from -5 to -15 is considered in one class (-10), which means Player 10 needs to on average turn 10 degrees in order to directly look at the target. The minus and plus sign, respectively, indicates the left or right turning direction. To be able to effectively show variation amongst the smaller values, the larger values for the northern orientation in some configurations are represented in their correspondent colour next to the northern arm. In the bottom figure, for example, the printed value 12 represents the relative orientation of Player 10 towards Player 17 for class 0 (the northern orientation) in configuration C3, as that value is beyond the radial extent of the diagram. The configurations are as follows: default (C1), zero energy consumption (C2), changed formation for Team B (C3), changed formation for Team A (C4), and alternative marking strategies (C5).
Figure 9
Figure 9
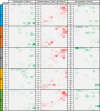
Changing the ball possession among players and between teams. The green colour indicates successful passes among teammates. These values should be read from Player on the row to Player in the column. The red cells show the accumulated number of successful attempts to get the ball (interceptions, retrieves, tackles, etc.) that has caused changing the ball possession between teams, without specifying from and to which two involved players. The configurations are as follows: default (C1), zero energy consumption (C2), changed formation for Team B (C3), changed formation for Team A (C4), and alternative marking strategies (C5).

References

    1. Mark, D. M. Geographic information science: Defining the field. in Foundations of geographic information science (eds. Duckham, M., Goodchild, M. F. & Worboys, M.) 1–18 (Taylor and Francis, 2003).
    1. Haggett, P., Cliff, A. D. & Frey, A. Locational Models. (Halstead Press, 1977).
    1. Sinton, D. F. The inherent structure of information as a constraint to analysis: mapped thematic data as a case study. in First International Advanced Study Symposium on Topological Data Structures for Geographic Information Systems (ed. Dutton, G.) 18 (Laboratory for Computer Graphics and Spatial Analysis, Graduate School of Design, Harvard University, 1977).
    1. Chrisman N. Concepts of space as a guide to cartographic data structures. Harv. Pap. Geogr. Inf. Syst. 1978;8:1–17.
    1. Peuquet, D. J. Representations of Space and Time (Guilford Press, 2002).

Publication types