. 2022 Dec 7;13(1):7533.
doi: 10.1038/s41467-022-35291-5.

Multiregional single-cell dissection of tumor and immune cells reveals stable lock-and-key features in liver cancer

Affiliations

Multiregional single-cell dissection of tumor and immune cells reveals stable lock-and-key features in liver cancer

Lichun Ma et al. Nat Commun. .

Abstract

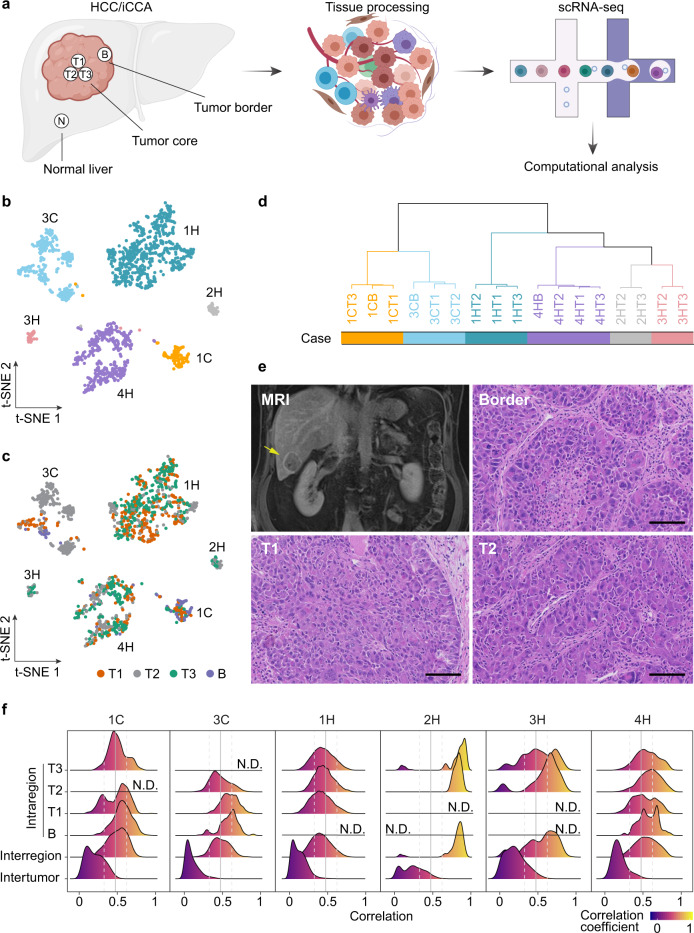
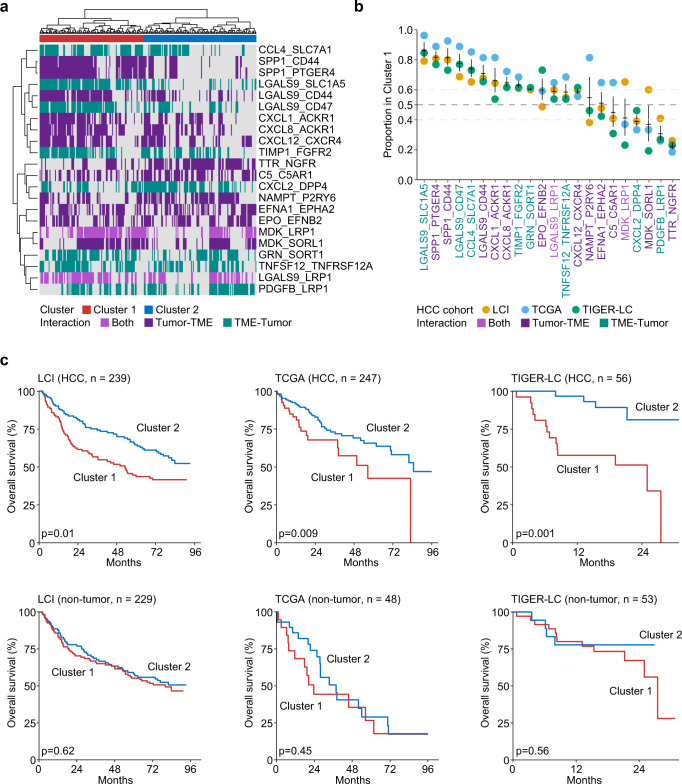
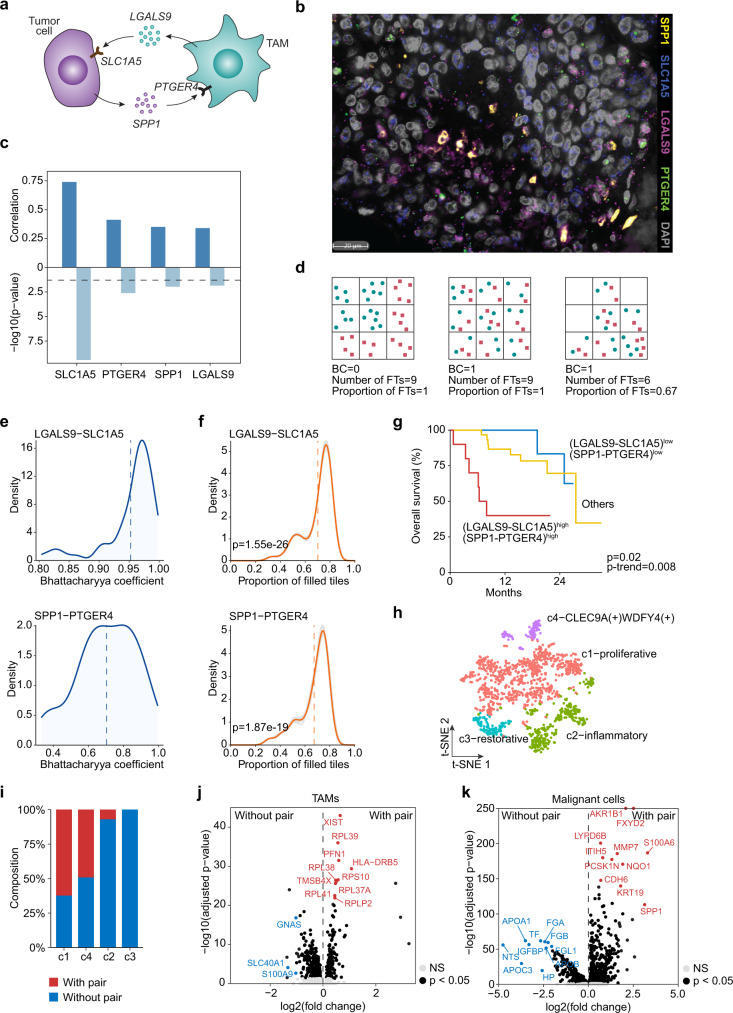
Intratumor heterogeneity may result from the evolution of tumor cells and their continuous interactions with the tumor microenvironment which collectively drives tumorigenesis. However, an appearance of cellular and molecular heterogeneity creates a challenge to define molecular features linked to tumor malignancy. Here we perform multiregional single-cell RNA sequencing (scRNA-seq) analysis of seven liver cancer patients (four hepatocellular carcinoma, HCC and three intrahepatic cholangiocarcinoma, iCCA). We identify cellular dynamics of malignant cells and their communication networks with tumor-associated immune cells, which are validated using additional scRNA-seq data of 25 HCC and 12 iCCA patients as a stable fingerprint embedded in a malignant ecosystem representing features of tumor aggressiveness. We further validate the top ligand-receptor interaction pairs (i.e., LGALS9-SLC1A5 and SPP1-PTGER4 between tumor cells and macrophages) associated with unique transcriptome in additional 542 HCC patients. Our study unveils stable molecular networks of malignant ecosystems, which may open a path for therapeutic exploration.


Conflict of interest statement

The authors declare no competing interests.

Figures

Fig. 1
Fig. 1. Multiregional single-cell transcriptome profiling of liver cancer.
a Workflow of multiregional tissue collection, processing, scRNA-seq, and data analysis. B, tumor border; T1, T2, and T3, three tumor cores; N, adjacent normal tissue. scRNA-seq, single-cell RNA sequencing. The figure was generated using BioRender. b, c t-SNE plot of malignant cells colored by cases (b) or tumor regions (c). Case ID was named according to the histological subtypes of HCC and iCCA. H, HCC; C, iCCA. B, tumor border; T1, T2, T3, three tumor cores. d Hierarchical clustering of malignant cells from each tumor region across all cases. Samples were named according to the histological subtypes and tumor regions. e Representative magnetic resonance imaging (MRI) of case 4H and histopathology of tumors from border, T1 and T2 of this case. Scale bars, 50 μm. Multiregional imaging pictures from all 7 cases are included as supplementary Figure 3. f The distribution of pair-wise correlations of malignant cells within each tumor region (intraregion), across regions within each individual case (interregion) and across cases (intertumor). Pearson’s correlation coefficient was applied. N.D., not detectable. Solid and dashed gray lines indicate the mean and standard deviation of all intraregional correlation values. Source data are provided as a Source data file.
Fig. 2
Fig. 2. Multiregional tumor cell trajectory of case 1C.
a RNA velocity of malignant cells from all tumor regions with viable malignant cells. b Expression of EPCAM, KRT19, ICAM1, and SPP1 in malignant cells along cellular latent time determined by RNA velocity method in (a).
Fig. 3
Fig. 3. Landscape of multiregional non-malignant cells.
a UMAP of non-malignant cells colored by cell types. CAFs, cancer-associated fibroblasts; TAMs. tumor-associated macrophages; TECs, tumor-associated endothelial cells. b Violin plots of cell-type specific marker gene expression in non-malignant cells. c, d UMAP of non-malignant cells colored by tumor regions (c) and case IDs (d). e Correlation of T cells (n = 61,561) between different tumor regions of each individual case. In the box plots, the central rectangles span the first quartile to the third quartile, with the segments inside the rectangle corresponding to the median. Whiskers extend 1.5 times the interquartile range. Source data are provided as a Source data file.
Fig. 4
Fig. 4. Communication of malignant cells and non-malignant cells.
a Ligand–receptor interactions of malignant cells and non-malignant cells in six cases with viable malignant cells. Each column indicates a ligand–receptor pair, with the first and the second gene representing a ligand and a receptor, respectively. Each row represents a non-malignant cell type that interacts with malignant cells. The direction of an interaction is indicated by colored dot. Purple, malignant cells provide ligands and interact with receptors from non-malignant cells in the TME; green, non-malignant cells in the TME provide ligands and interact with receptors from malignant cells. The size of each dot represents the proportion of tumor regions within each case in identifying a specific interaction pair, with 1 indicating occurrence in all tumor regions and 0 indicating occurrence in none of the tumor regions. b Illustration of ligand–receptor interactions of tumor and the TME. Purple dots, ligands from tumor; green dots, ligands from TME. c Stacked bar plot of the percentage of ligand–receptor pairs in each individual case found in certain proportion of tumor regions. One means that a pair was found in all tumor regions within a case while zero means that a pair was found in none of the tumor regions. d Similarity of ligand–receptor interactions among multiple regions of different cases. Zero indicates no overlap of ligand–receptor interactions while 1 means a full overlap of ligand–receptor interactions between samples. e Illustration of switching TME and switching tumor. Switching TME indicates that tumor cells from one case are combined with TMEs from other cases to form distinct tumor ecosystems. Switching tumor indicates that TME from one case are combined with tumors from other cases to form distinct tumor ecosystems. f The proportion of matched ligand–receptor interactions from switching tumor or TME with the original search of using paired tumor and TME from the same case. Student’s t-test (two-sided) was applied with p value provided. b and e were generated using BioRender.
Fig. 5
Fig. 5. Communication of malignant cells and non-malignant cells are associated with patient outcome.
a Hierarchical clustering of the ligand–receptor interaction patterns of malignant cells and non-malignant cells. Each row indicates a ligand–receptor pair, with the first and the second gene representing a ligand and a receptor, respectively. Each column represents a tumor sample. The direction of an interaction is indicated by color. Purple, malignant cells provide ligands and interact with receptors from non-malignant cells in the TME; green, non-malignant cells in the TME provide ligands and interact with receptors from malignant cells. Distinct non-malignant cell types that interact with malignant cells are indicated by colors. Clusters were determined based on the hierarchical relationship. b, c Overall survival of all patients (b) or HCC patients (c) from Cluster 1 and Cluster 2 in (a). Log-rank test was preformed to show the statistical difference of the two groups. d The difference between the proportions of each ligand–receptor interaction in Cluster 1 and Cluster 2. Red, pairs enriched in Cluster 1; Blue, pairs enriched in Cluster 2. The direction of each interaction pair is indicated by color. Purple, malignant cells provide ligands and interact with receptors from non-malignant cells in the TME; green, non-malignant cells in the TME provide ligands and interact with receptors from malignant cells. The non-malignant cell types that interact with malignant cells are indicated in parentheses.
Fig. 6
Fig. 6. Validation of the tumor and TME interaction patterns for patient stratification using bulk transcriptomic data.
a Hierarchical clustering of ligand–receptor interaction activities in LCI cohort. Each column represents a tumor sample. Each row represents a pair. The direction of each interaction pair is indicated by color. Purple, tumor provides ligands and interacts with receptors from the TME; green, TME provides ligands and interacts with receptors from tumor; light purple, both directions (pairs were identified in both directions from single-cell analysis but can only be modeled once in bulk data). b The proportion of each pair in Cluster 1 of three HCC cohorts. Error bar, mean ± standard error of the mean. c Overall survival of patients from Cluster 1 and Cluster 2 in three HCC cohorts and the corresponding non-tumor cohorts. Cluster 1 and Cluster 2 were determined based on hierarchical clustering of ligand–receptor interaction activities in (a) and Supplementary Fig. 15a. The number of samples in each cohort was provided. Log-rank test was preformed to show the statistical difference of the two groups.
Fig. 7
Fig. 7. Validation of two interaction pairs between tumor and TAM using RNAscope assay.
a Illustration of ligand–receptor interaction pairs between tumor cell and TAM (generated using BioRender). b A representative image of RNAscope multiplex fluorescent in situ hybridization of four genes of an HCC sample from a total of 258 samples analyzed. (c) Correlation of RNAscope signal and bulk transcriptome gene expression in TIGER-LC cohort. Pearson’s correlation coefficient (two-sided) was calculated. Dashed line: p = −log10(0.05). d Evaluation of the colocalization of two spatially distributed genes. BC, Bhattacharyya coefficient: 1, a full colocalization; 0, no colocalization. FTs, filled tiles. e The distribution of BCs of LGALS9 and SLC1A5 (top) as well as SPP1 and PTGER4 (bottom) in HCC samples from the TIGER-LC cohort. Dashed line: mean value. f The distribution of the proportion of filled tiles of LGALS9 and SLC1A5 (top) as well as SPP1 and PTGER4 (bottom) in HCC samples from the TIGER-LC cohort. Ten-times of randomization was used to generate random spread of markers on tissue sections as a reference. Gray line, proportion determined based on the ratio of true signal and each random spread; gold line, mean derived from ten gray lines. Dashed line: mean value. Student’s t-test (two-sided) was applied. g Overall survival of HCC patients with low expression and high expression of LGALS9 and SLC1A5 as well as SPP1 and PTGER4 from the TIGER-LC cohort. Tumor samples with expression of the four marker genes in between were grouped into others. Log-rank test and a trend test among the groups were preformed. h t-SNE plot of TAMs from samples with or without the two pairs (i.e., LGALS9 and SLC1A5, SPP1 and PTGER4) in Fig. 5a. i The composition of each TAM cluster. j Differentially expressed genes of TAMs from the samples with or without the two pairs (i.e., LGALS9 and SLC1A5, SPP1 and PTGER4) in Fig. 5a. k Differentially expressed genes of malignant cells from the samples with or without the two pairs (i.e., LGALS9 and SLC1A5, SPP1 and PTGER4) in Fig. 5a. Wilcoxon test with multiple test adjustment was applied in (j) and (k).

Similar articles

Cited by

References

    1. Black, J. R. M. & McGranahan, N. Genetic and non-genetic clonal diversity in cancer evolution. Nat. Rev. Cancer10.1038/s41568-021-00336-2 (2021). - PubMed
    1. Andor N, et al. Pan-cancer analysis of the extent and consequences of intratumor heterogeneity. Nat. Med. 2016;22:105–113. doi: 10.1038/nm.3984. - DOI - PMC - PubMed
    1. Greaves M, Maley CC. Clonal evolution in cancer. Nature. 2012;481:306–313. doi: 10.1038/nature10762. - DOI - PMC - PubMed
    1. Maley CC, et al. Classifying the evolutionary and ecological features of neoplasms. Nat. Rev. Cancer. 2017;17:605–619. doi: 10.1038/nrc.2017.69. - DOI - PMC - PubMed
    1. Hung MH, et al. Tumor methionine metabolism drives T-cell exhaustion in hepatocellular carcinoma. Nat. Commun. 2021;12:1455. doi: 10.1038/s41467-021-21804-1. - DOI - PMC - PubMed

Publication types

MeSH terms

Substances