. 2022 Dec 7;12(1):21164.
doi: 10.1038/s41598-022-24721-5.

Prediction of oxygen requirement in patients with COVID-19 using a pre-trained chest radiograph xAI model: efficient development of auditable risk prediction models via a fine-tuning approach

Affiliations

Prediction of oxygen requirement in patients with COVID-19 using a pre-trained chest radiograph xAI model: efficient development of auditable risk prediction models via a fine-tuning approach

Joowon Chung et al. Sci Rep. .

Erratum in

Abstract

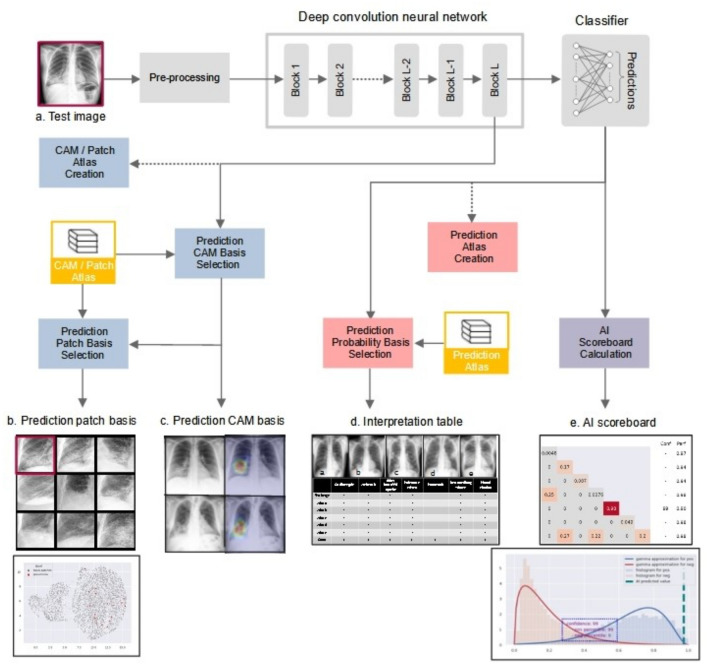
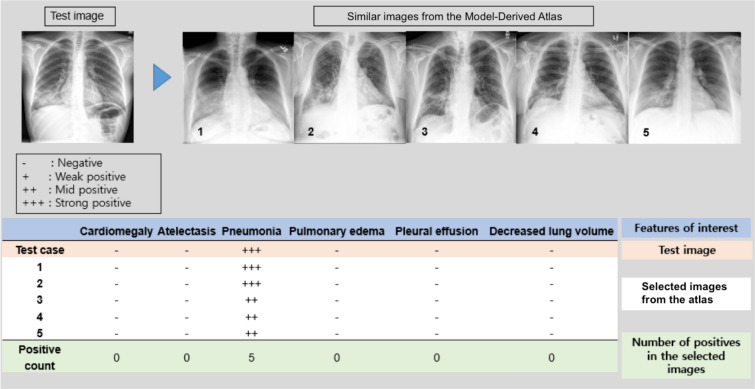
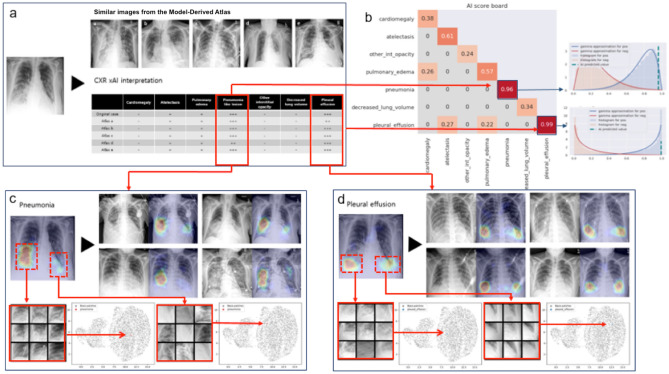
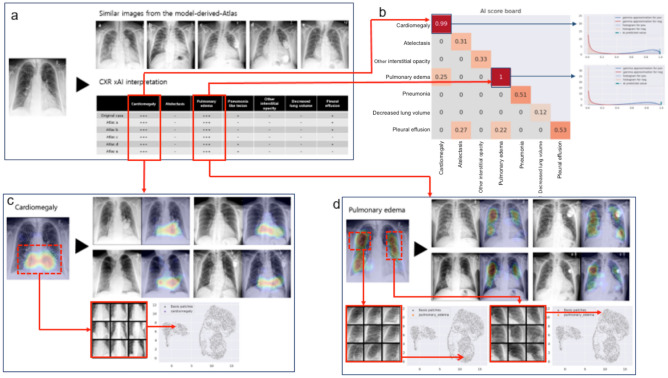
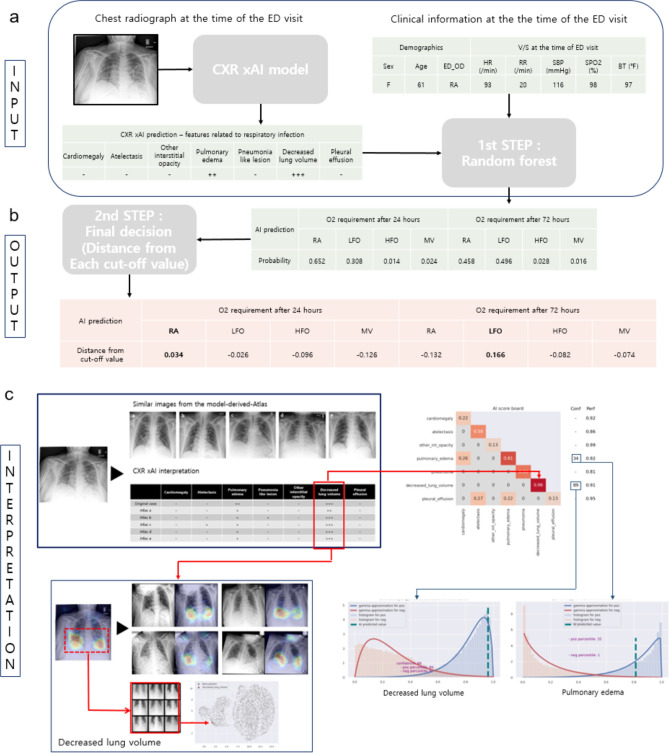
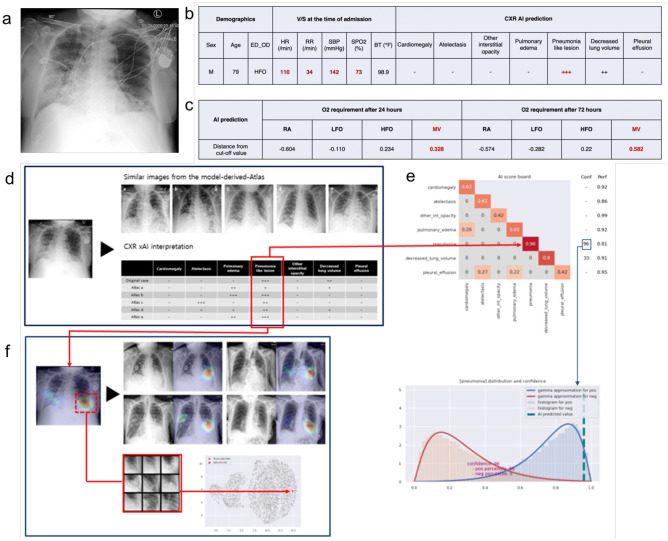
Risk prediction requires comprehensive integration of clinical information and concurrent radiological findings. We present an upgraded chest radiograph (CXR) explainable artificial intelligence (xAI) model, which was trained on 241,723 well-annotated CXRs obtained prior to the onset of the COVID-19 pandemic. Mean area under the receiver operating characteristic curve (AUROC) for detection of 20 radiographic features was 0.955 (95% CI 0.938-0.955) on PA view and 0.909 (95% CI 0.890-0.925) on AP view. Coexistent and correlated radiographic findings are displayed in an interpretation table, and calibrated classifier confidence is displayed on an AI scoreboard. Retrieval of similar feature patches and comparable CXRs from a Model-Derived Atlas provides justification for model predictions. To demonstrate the feasibility of a fine-tuning approach for efficient and scalable development of xAI risk prediction models, we applied our CXR xAI model, in combination with clinical information, to predict oxygen requirement in COVID-19 patients. Prediction accuracy for high flow oxygen (HFO) and mechanical ventilation (MV) was 0.953 and 0.934 at 24 h and 0.932 and 0.836 at 72 h from the time of emergency department (ED) admission, respectively. Our CXR xAI model is auditable and captures key pathophysiological manifestations of cardiorespiratory diseases and cardiothoracic comorbidities. This model can be efficiently and broadly applied via a fine-tuning approach to provide fully automated risk and outcome predictions in various clinical scenarios in real-world practice.


Conflict of interest statement

The authors declare no competing interests.

Figures

Figure 1
Figure 1
Representative class activation maps (CAMs) with correct lesion localization. (a,b) Cardiomegaly (PA), (c,d) Other interstitial opacity (PA), (e,f) Pleural effusion (PA), (g,h) Pneumonia (PA), (i,j) Pneumonia (AP), (k,l) Pneumothorax (PA), (m,n) Atelectasis (AP), (o,p) Fracture (AP), (q,r) Pulmonary edema (PA).
Figure 2
Figure 2
Representative class activation maps (CAMs) with incorrect lesion localization. (a,b) Cardiomegaly (PA), (c,d) Cardiomegaly (AP), (e,f) Pneumothorax (PA), (g,h) Other interstitial opacity (AP), (i,j) Other interstitial opacity (AP), (k,l) Pneumothorax (AP). (b) Attention map captures the tip and body of the implantable cardioverter defibrillator (ICD) rather than the enlarged heart, (d) Attention map captures pulmonary edema along with the enlarged outline of heart in cardiomegaly, (f) Attention map captures subcutaneous emphysema along with pneumothorax, (h,j) Attention map failed to capture the full area of diffuse interstitial opacities, (i) Attention map captures chest tube instead of pneumothorax.
Figure 3
Figure 3
Schematic overview of CXR interpretation by our xAI model using a three-dimensional approach. The architecture of our CXR xAI model includes DenseNet-121 pre-trained DCNNs, (a) pipeline of pre-processing techniques, an Atlas creation module and prediction-based retrieval modules. The xAI model produces 3 types of outputs: (1) label prediction and attention map with corresponding feature patches selected from the Model-Derived Atlas (b,c). The first one on the upper left is a feature specific patch from the test CXR and the other eight are selected from the Atlas, which were closely located to the test patch on UMAP (b). The four CXR images were retrieved from the Atlas, which have similar overall characteristics with the test CXR (c). (2) an interpretation table displaying prediction probabilities for coexisting labels and comparable CXRs selected from the Model-Derived Atlas (d), and (3) an AI scoreboard displaying prediction probabilities and calibrated classifier confidence, and histogram for AI prediction, positive and negative percentile (e).
Figure 4
Figure 4
Interpretation table with similar CXRs selected from the Model-Derived Atlas. Visual comparison of the test image to similar CXRs with ground truth labels provides justification for model predictions. The table uses ‘−,’ ‘ + ,’ ‘ ++ ,’ and ‘ +++ ’ symbols to demonstrate similar combinations of pathological findings; prediction probability is ≥ 0.90 for ‘ +++ ’, < 0.90 and ≥ 0.80 for ‘ ++ ’, < 0.80 and ≥ 0.70 for ‘ + ’, and < 0.70 for ‘−’.
Figure 5
Figure 5
CXR interpretation by our xAI model for a patient who presented with respiratory infection. (a) The interpretation table shows 5 comparable CXRs selected from the Model-Derived Atlas and prediction probabilities for labels associated with respiratory infection. (b) Prediction probability was ≥ 0.90 on the AI scoreboard for pneumonia and pleural effusion. (c,d) Pneumonia and pleural effusion were correctly localized by Grad-CAM, and similar CXRs and patches were selected from the Model-Derived Atlas. UMAPs show that the test patches were close to corresponding patches from the Model-Derived Atlas, which supports that the testing patches can be classified as “pneumonia” and “pleural effusion”, respectively.
Figure 6
Figure 6
CXR interpretation by our xAI model for a patient who presented with heart failure. (a) The interpretation table shows 5 comparable CXRs selected from the Model-Derived Atlas and prediction probabilities for labels associated with heart failure. (b) Prediction probability was ≥ 0.90 on the AI scoreboard for cardiomegaly and pulmonary edema. (c,d) Cardiomegaly and pleural effusion were correctly localized by Grad-CAM, and similar feature CXRs and patches were selected from the Model-Derived Atlas. UMAPs show that the test patches were close to corresponding patches from the Model-Derived Atlas, which supports that the testing patches can be classified as “cardiomegaly” and “pulmonary edema”, respectively.
Figure 7
Figure 7
CXR interpretation and AI prediction of most likely stage of oxygen requirement at 24 and 72 h from the time of ED admission in patients with COVID-19. (a) Input: For a test case, prediction probabilities for each stage of oxygen requirement at 24 and 72 h from the time of ED admission are derived from the random forest model. (b) Output: The stage with the largest positive difference between prediction probability and the cut-off value is selected as the predicted stage of oxygen requirement. (c) Interpretation: Prediction probabilities for 7 infection-associated radiographic labels are summarized in the interpretation table and comparable CXRs were selected from the Model-Derived Atlas. Decreased lung volume was identified as a significant feature, based on high prediction probability and calibrated classifier confidence on the AI scoreboard. Feature localization with Grad-CAM and close location on UMAP to the similar feature patches from the Model-Derived Atlas provide visual evidence of decreased lung volume to support the prediction.
Figure 8
Figure 8
AP CXR of a 79-year-old man with COVID-19 and respiratory insufficiency and AI prediction of most likely stage of oxygen requirement at 24 and 72 h from the time of ED admission. (a) AP CXR obtained on ED admission, (b) Clinical information and infection-associated radiographic labels identified by our CXR xAI model, (c) Final prediction of oxygen requirement after 24 and 72 h. Our COVID-19 xAI model predicted that the patient would require MV after 24 and 72 h, (d) Prediction probabilities for 7 infection-associated radiographic labels are summarized in the interpretation table and 4 similar CXRs with characteristic findings for pneumonia were selected from the Model-Derived Atlas, (e) Pneumonia was identified as a significant feature, based on high prediction probability and calibrated classifier confidence on the AI scoreboard, (f) Pneumonia was correctly localized by Grad-CAM, and on UMAP, the test patch was closely located to corresponding patches from the Model-Derived Atlas in the embedding space after dimensionality reduction.

References

    1. Casiraghi E, et al. Explainable machine learning for early assessment of COVID-19 risk prediction in emergency departments. IEEE Access. 2020;8:196299–196325. doi: 10.1109/access.2020.3034032. - DOI - PMC - PubMed
    1. Jiao Z, et al. Prognostication of patients with COVID-19 using artificial intelligence based on chest x-rays and clinical data: A retrospective study. Lancet Digit. Health. 2021;3:e286–e294. doi: 10.1016/s2589-7500(21)00039-x. - DOI - PMC - PubMed
    1. Quah J, et al. Chest radiograph-based artificial intelligence predictive model for mortality in community-acquired pneumonia. BMJ Open Respir. Res. 2021 doi: 10.1136/bmjresp-2021-001045. - DOI - PMC - PubMed
    1. Mushtaq J, et al. Initial chest radiographs and artificial intelligence (AI) predict clinical outcomes in COVID-19 patients: Analysis of 697 Italian patients. Eur. Radiol. 2021;31:1770–1779. doi: 10.1007/s00330-020-07269-8. - DOI - PMC - PubMed
    1. Shamout FE, et al. An artificial intelligence system for predicting the deterioration of COVID-19 patients in the emergency department. NPJ Digit. Med. 2021;4:80. doi: 10.1038/s41746-021-00453-0. - DOI - PMC - PubMed