. 2022 Dec 7;13(1):7558.
doi: 10.1038/s41467-022-35043-5.

Breast cancer prevention by short-term inhibition of TGFβ signaling

Affiliations

Breast cancer prevention by short-term inhibition of TGFβ signaling

Maša Alečković et al. Nat Commun. .

Abstract

Cancer prevention has a profound impact on cancer-associated mortality and morbidity. We previously identified TGFβ signaling as a candidate regulator of mammary epithelial cells associated with breast cancer risk. Here, we show that short-term TGFBR inhibitor (TGFBRi) treatment of peripubertal ACI inbred and Sprague Dawley outbred rats induces lasting changes and prevents estrogen- and carcinogen-induced mammary tumors, respectively. We identify TGFBRi-responsive cell populations by single cell RNA-sequencing, including a unique epithelial subpopulation designated secretory basal cells (SBCs) with progenitor features. We detect SBCs in normal human breast tissues and find them to be associated with breast cancer risk. Interactome analysis identifies SBCs as the most interactive cell population and the main source of insulin-IGF signaling. Accordingly, inhibition of TGFBR and IGF1R decrease proliferation of organoid cultures. Our results reveal a critical role for TGFβ in regulating mammary epithelial cells relevant to breast cancer and serve as a proof-of-principle cancer prevention strategy.


Conflict of interest statement

The authors declare competing financial interests: K.P. serves on the Scientific Advisory Board of Acrivon Therapeutics, Vividion Therapeutics, Novartis, and Scorpion Therapeutics, holds equity options in Scorpion Therapeutics, receives grant support from Novartis, is a consultant to Aria Pharmaceuticals, and in the past 12 months received an honorarium from Astra-Zeneca, Roche, and New Equilibrium Biosciences. F.M. is a cofounder of and has equity in Harbinger Health, has equity in Zephyr AI, and serves as a consultant for Harbinger Health, Zephyr AI, and Red Cell Partners. F.M. declares that none of these relationships are directly or indirectly related to the content of this manuscript. The remaining authors declare no competing interests.

Figures

Fig. 1
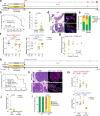
Fig. 1. The effect of peripubertal TGFBRi treatment on mammary glands of peripubertal ACI and SD rats.
a Schematic outline of experimental design for ACI rats. bd Representative mammary gland whole mounts (b, d), quantification of the epithelial area (c), and hematoxylin and eosin (H&E) staining of mammary tissue sections (b) from ACI rats at indicated experimental timepoints (n = 5 for vehicle and for TGFBRi n = 5 at day 0 and n = 6 at day 196). e, f Representative flow cytometry plots (e) and quantification (f) of luminal (CD24+CD29low) and basal (CD24+CD29high) mammary epithelial cells within the CD31CD45 cell population in ACI rats. g Schematic outline of experimental design for SD rats. h, i Two representative mammary gland whole mounts (h) and quantification (i) of the mammary gland epithelium in SD rats. j, k Representative flow cytometry plots (j) and quantification (k) of luminal (CD24+CD29low) and basal (CD24+CD29high) mammary epithelial cells within the CD31CD45 cell population in SD rats. All graphs (c, f, i, k) are presented as mean ± s.e.m. P values were calculated by unpaired two-tailed t test with Welch’s correction. Scale bars: whole mounts 5 mm, H&E 100 µm. Source data are provided as a Source Data file.
Fig. 2
Fig. 2. Peripubertal TGFBRi treatment prevents mammary tumor initiation.
a Schematic outline of experimental design of NMU-induced tumors in SD rats. Red bars indicate the detection of a new tumor. b Kaplan–Meier tumor-free survival plot for SD rats. c Tumor burden per SD rat. d, e Representative images (d) and quantification (e) of microscopic lesions in mammary glands without palpable tumors. f Quantification of basal (CD24+CD29high) and luminal (CD24+CD29low) mammary epithelial cells within the CD31CD45 cell population from flow cytometric analysis in SD rats. g Relationship between the relative fraction of basal cells and tumor burden for all animals. h Schematic outline of experimental design of E2-induced tumors in ACI rats. Red bars indicate the detection of a new tumor. i Kaplan–Meier tumor-free survival plot for ACI rats. j Tumor burden per ACI rat. k, i Representative H&E and immunofluorescence images of SMA and EPCAM staining (k) and quantification (l) of histology in mammary glands without macroscopic tumors. m Quantification of basal (CD24+CD29high) and luminal (CD24+CD29low) mammary epithelial cells within the CD31CD45 cell population by flow cytometric analysis in ACI rats. All graphs (c, f, j, m) are presented as mean ± s.e.m. P values were calculated by log-rank test (b, i); one-sided Wilcoxon rank-sum test with continuity correction (c, j); Fisher’s exact test (e, l); unpaired two-tailed t test with Welch’s correction (f, m); linear regression model with the goodness of fit (R2) and P value (g). Scale bars: 50 µm. Source data are provided as a Source Data file.
Fig. 3
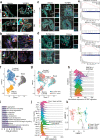
Fig. 3. Single-cell RNA-sequencing analysis of mammary epithelial cell populations.
a, b UMAP plots (a) and dot plots (b) of sorted basal (CD24+CD29high) and luminal (CD24+CD29low) mammary epithelial cell fractions from ACI and SD rats treated with vehicle and TGFBRi. Dot plots show the expression of markers representative of the four identified cell types. c Integrated UMAP plots of all cells from the vehicle and TGFBRi-treated ACI and SD rats. d, e UMAP plots of whole mammary gland scRNA-seq data from SD rats preprocessed and analyzed together (d) or separately for each major cell type (e). Cells are colored by treatment condition (a, d, e) or by cluster assignment (c).
Fig. 4
Fig. 4. Secretory basal cells in mammary gland and tumor development.
a, b Representative immunofluorescence images of EPAS1/HIF2A, ID3, and SMA in ACI and SD mammary glands (a) and of S100A4, ID3, and SMA in normal breast tissue sections from noncarrier parous (n = 2) and nulliparous (n = 3) women, as well as from BRCA1/2 mutation carriers (n = 6) (b). Scale bar 50 μm. c, d Representative immunofluorescence images of ID3, S100A4, and EPCAM in SD rat mammary glands (c) and in normal breast tissue sections from noncarrier parous (n = 2) and nulliparous (n = 2) women, as well as from BRCA1 mutation carriers (n = 2) (d). Scale bar 10 μm. e GSEA plots showing the enrichment of the SBC signature in DEGs within the indicated comparisons. P values are calculated using Kolmogorov–Smirnov test following the Benjamini–Hochberg adjustment. f, g UMAP plots of normal human breast scRNA-seq data colored by assigned cell type (f) or by BRCA1 mutational status (g). h Ridge plot showing the expression of the SBC signature in the indicated clusters of human mammary epithelial scRNA-seq data. i MetaCore enrichment on gene sets characteristic to SBCs. P values are calculated by hypergeometric test. j Ridge plot showing the expression of the SBC signature in the indicated clusters of mouse mammary epithelial scRNA-seq data. k UMAP plot depicting the SBC subclusters in SD rats colored by cluster assignment.
Fig. 5
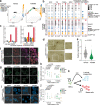
Fig. 5. Functional relevance of TGFBRi-induced changes in the mammary epithelium.
a Diffusion maps of mammary epithelial cells from control and TGFBRi-treated SD rats. b Cell type-specific inferred connectivity among selected signaling pathways from interactome analysis in SD control and TGFBRi-treated rats. Clusters refer to the integrated data in Fig. 3c, with selected clusters highlighted. The size of dots is the fractional number of either IN or OUT connections per cluster per pathway, normalized across clusters. IN—incoming (target); and OUT—outgoing (source) signals. c Relative number of inferred interactome connections per cell, aggregated by cell type. d Representative images of organoid cultures from the vehicle and TGFBRi-treated SD rats. e Plot depicting quantification of relative organoid diameter. Organoids were derived from animals treated with vehicle (n = 3) or TGFBRi (n = 6). Two wells/animal were used for quantification. f Representative immunofluorescence images of organoids for S100A4, EPCAM, and KRT17. Immunofluorescence was performed once on multiple samples from vehicle (n = 3) and TGFBRi (n = 5) treated rats. gj Representative immunofluorescence images (g, i) and quantification (h, j) of organoids for pSMAD3 and Ki67+ following treatment with the indicated inhibitors. Organoids were derived from animals treated with vehicle (n = 3) or TGFBRi (n = 6), then treated with the indicated inhibitors in vitro. Two wells/animal/treatment were used for quantification. k Schematic model of TGFBRi treatment effects on mammary epithelium relevant to cancer prevention. Scale bars: organoids 100 µm, immunofluorescence 20 µm. Graphs (e, h, j) are presented as mean ± s.e.m. P values were calculated by unpaired two-tailed t test (e) and by two-way ANOVA (h, j). ns denotes not significant. Source data are provided as a Source Data file.

References

    1. den Hollander P, Savage MI, Brown PH. Targeted therapy for breast cancer prevention. Front. Oncol. 2013;3:250. - PMC - PubMed
    1. Borgquist S, Hall P, Lipkus I, Garber JE. Towards prevention of breast cancer: what are the clinical challenges? Cancer Prev. Res. 2018;11:255–264. doi: 10.1158/1940-6207.CAPR-16-0254. - DOI - PubMed
    1. Colditz GA, Rosner BA, Chen WY, Holmes MD, Hankinson SE. Risk factors for breast cancer according to estrogen and progesterone receptor status. J. Natl Cancer Inst. 2004;96:218–228. doi: 10.1093/jnci/djh025. - DOI - PubMed
    1. Chen H, et al. Association of interactions between mammographic density phenotypes and established risk factors with breast cancer risk, by tumor subtype and menopausal status. Am. J. Epidemiol. 2021;190:44–58. doi: 10.1093/aje/kwaa131. - DOI - PMC - PubMed
    1. Day R, National Surgical Adjuvant B, Bowel Projet PS. Quality of life and tamoxifen in a breast cancer prevention trial: a summary of findings from the NSABP P-1 study. National Surgical Adjuvant Breast and Bowel Project. Ann. N. Y Acad. Sci. 2001;949:143–150. doi: 10.1111/j.1749-6632.2001.tb04012.x. - DOI - PubMed

Publication types