

Nanoparticle vaccines can be designed to induce pDC support of mDCs for increased antigen display
- PMID: 36476811
- PMCID: PMC10775882
- DOI: 10.1039/d2bm01132h
Nanoparticle vaccines can be designed to induce pDC support of mDCs for increased antigen display
Abstract
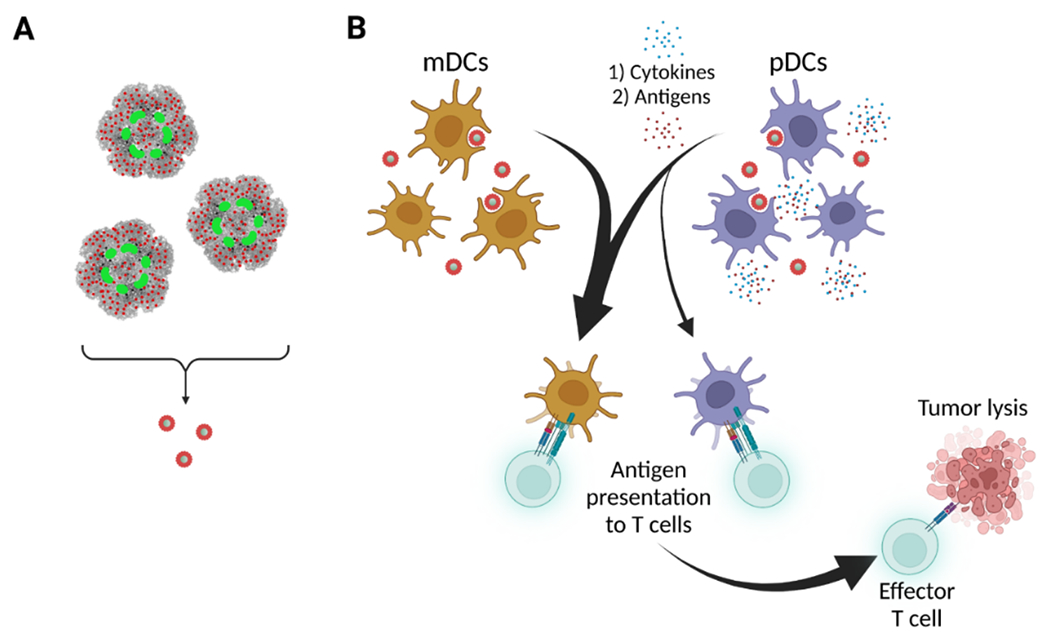
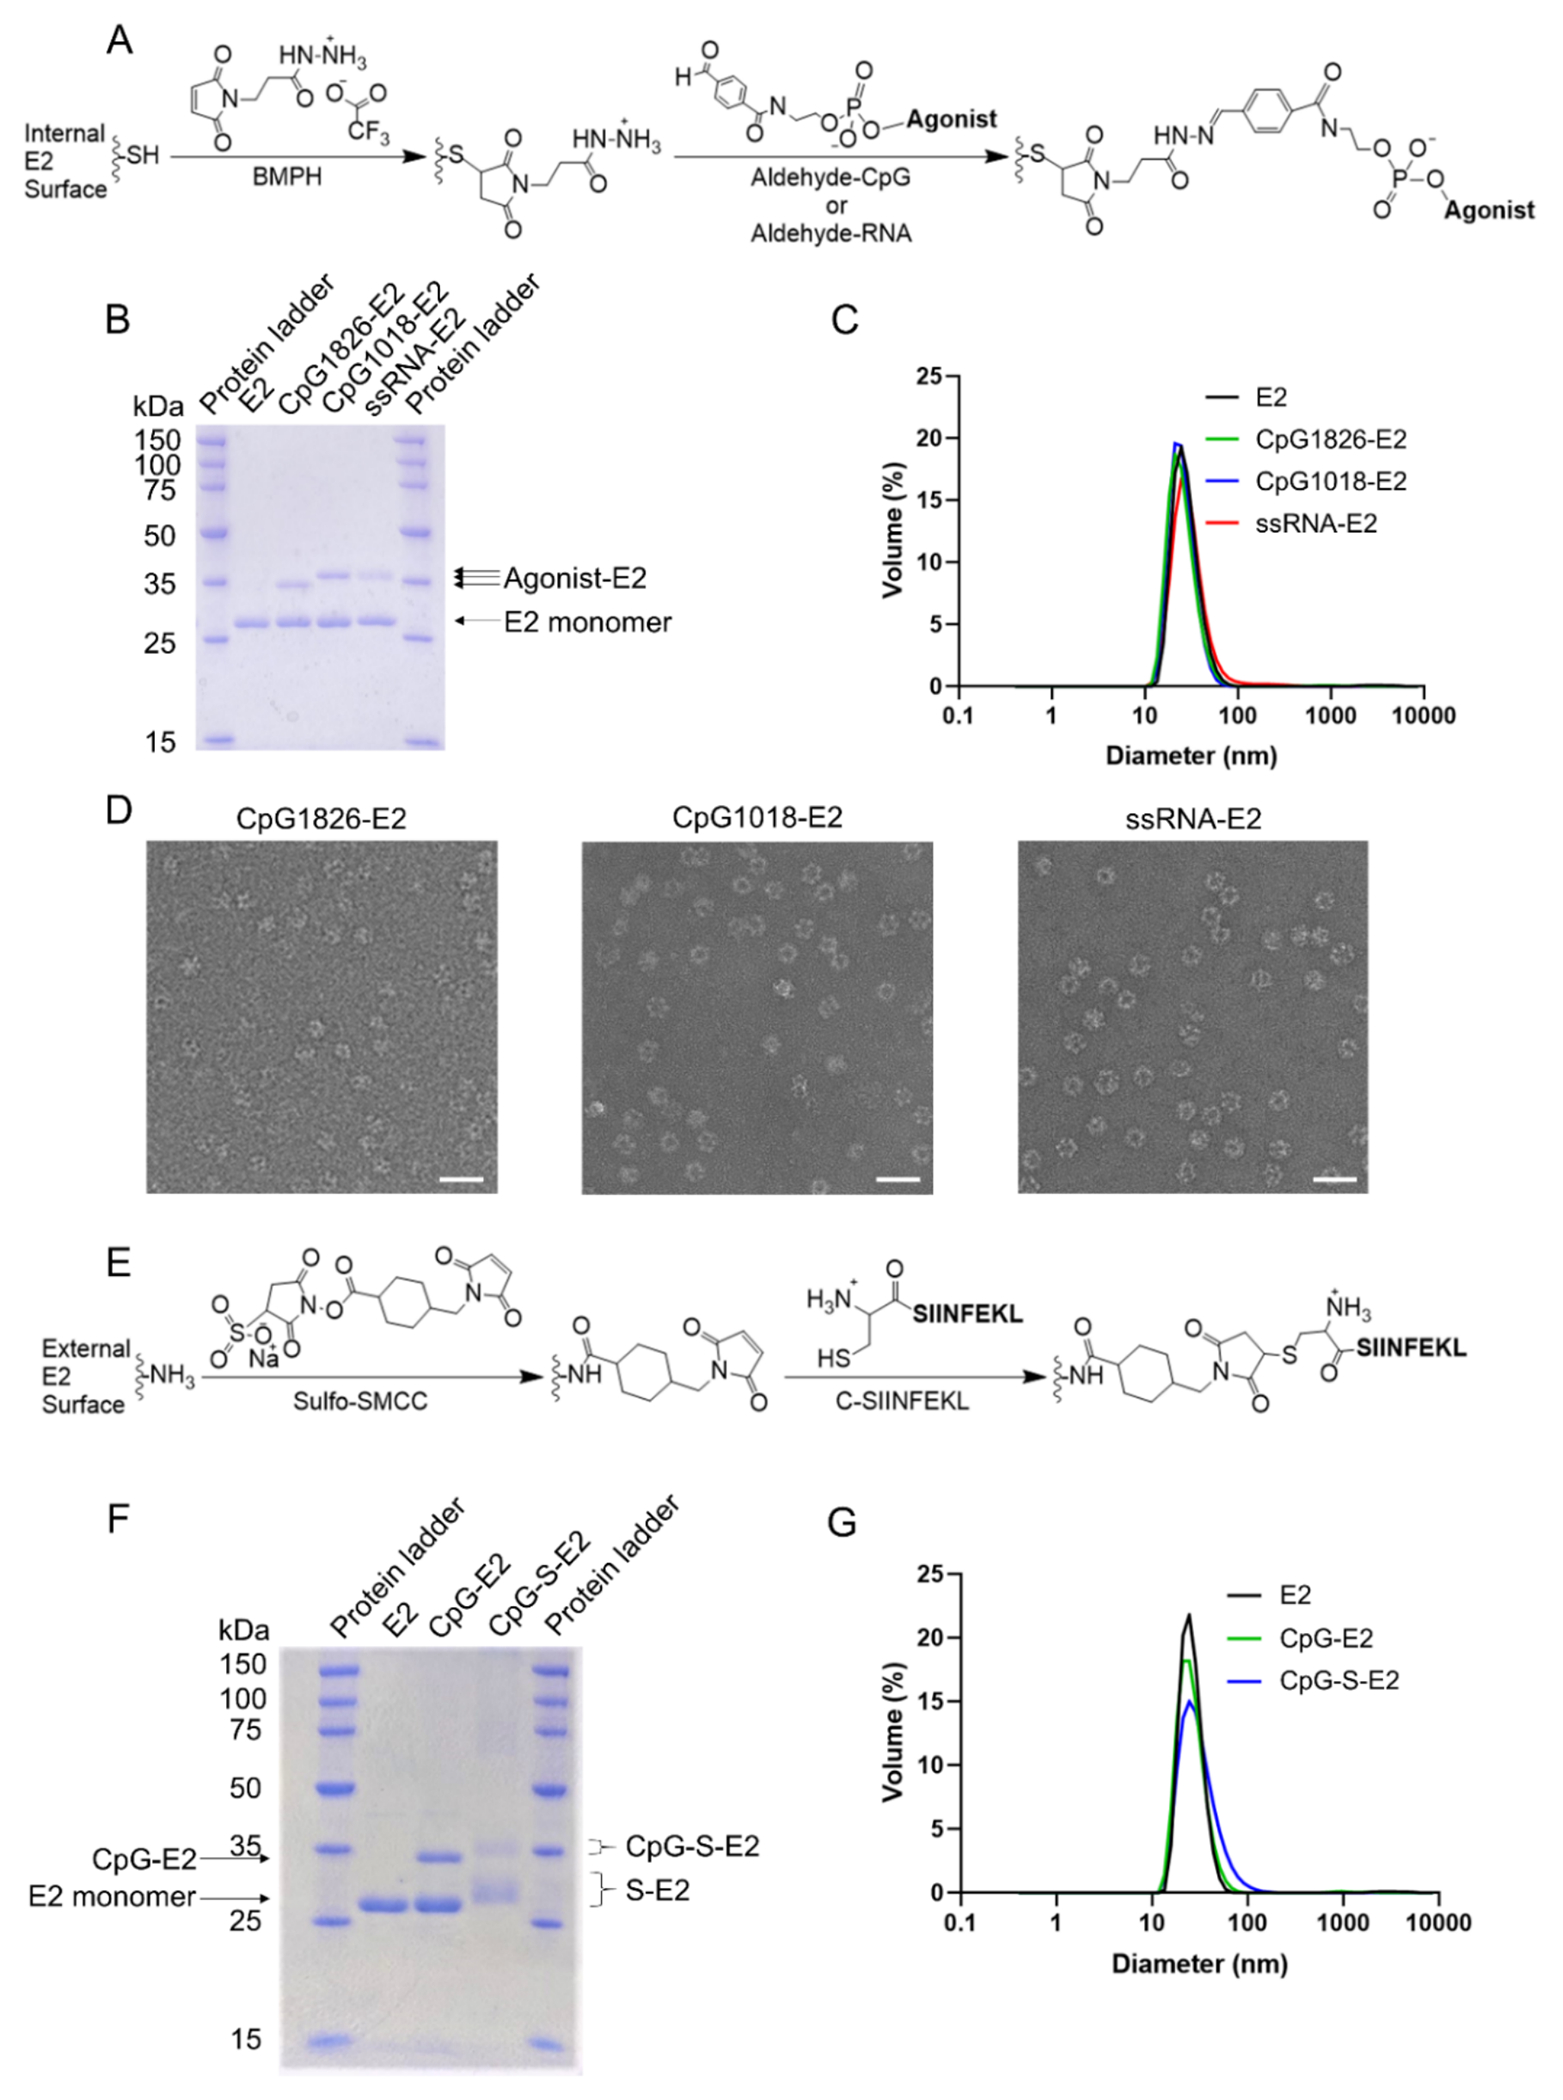
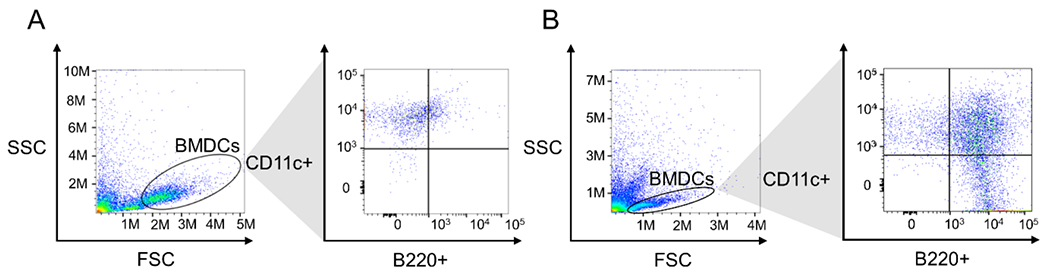
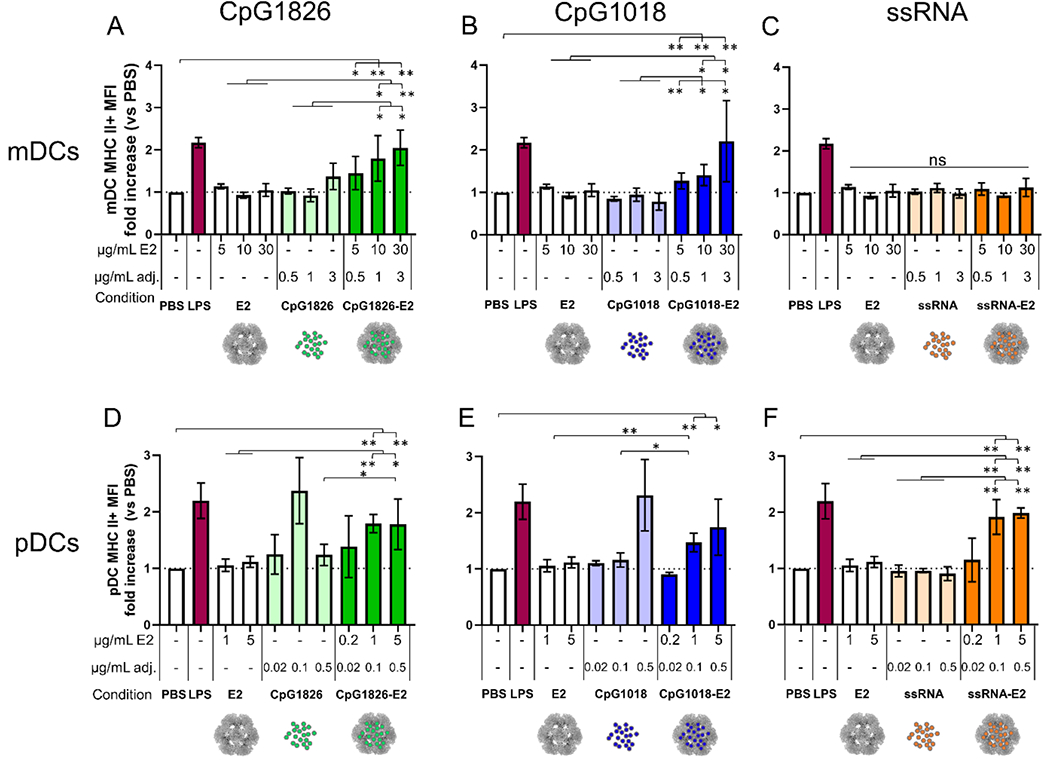
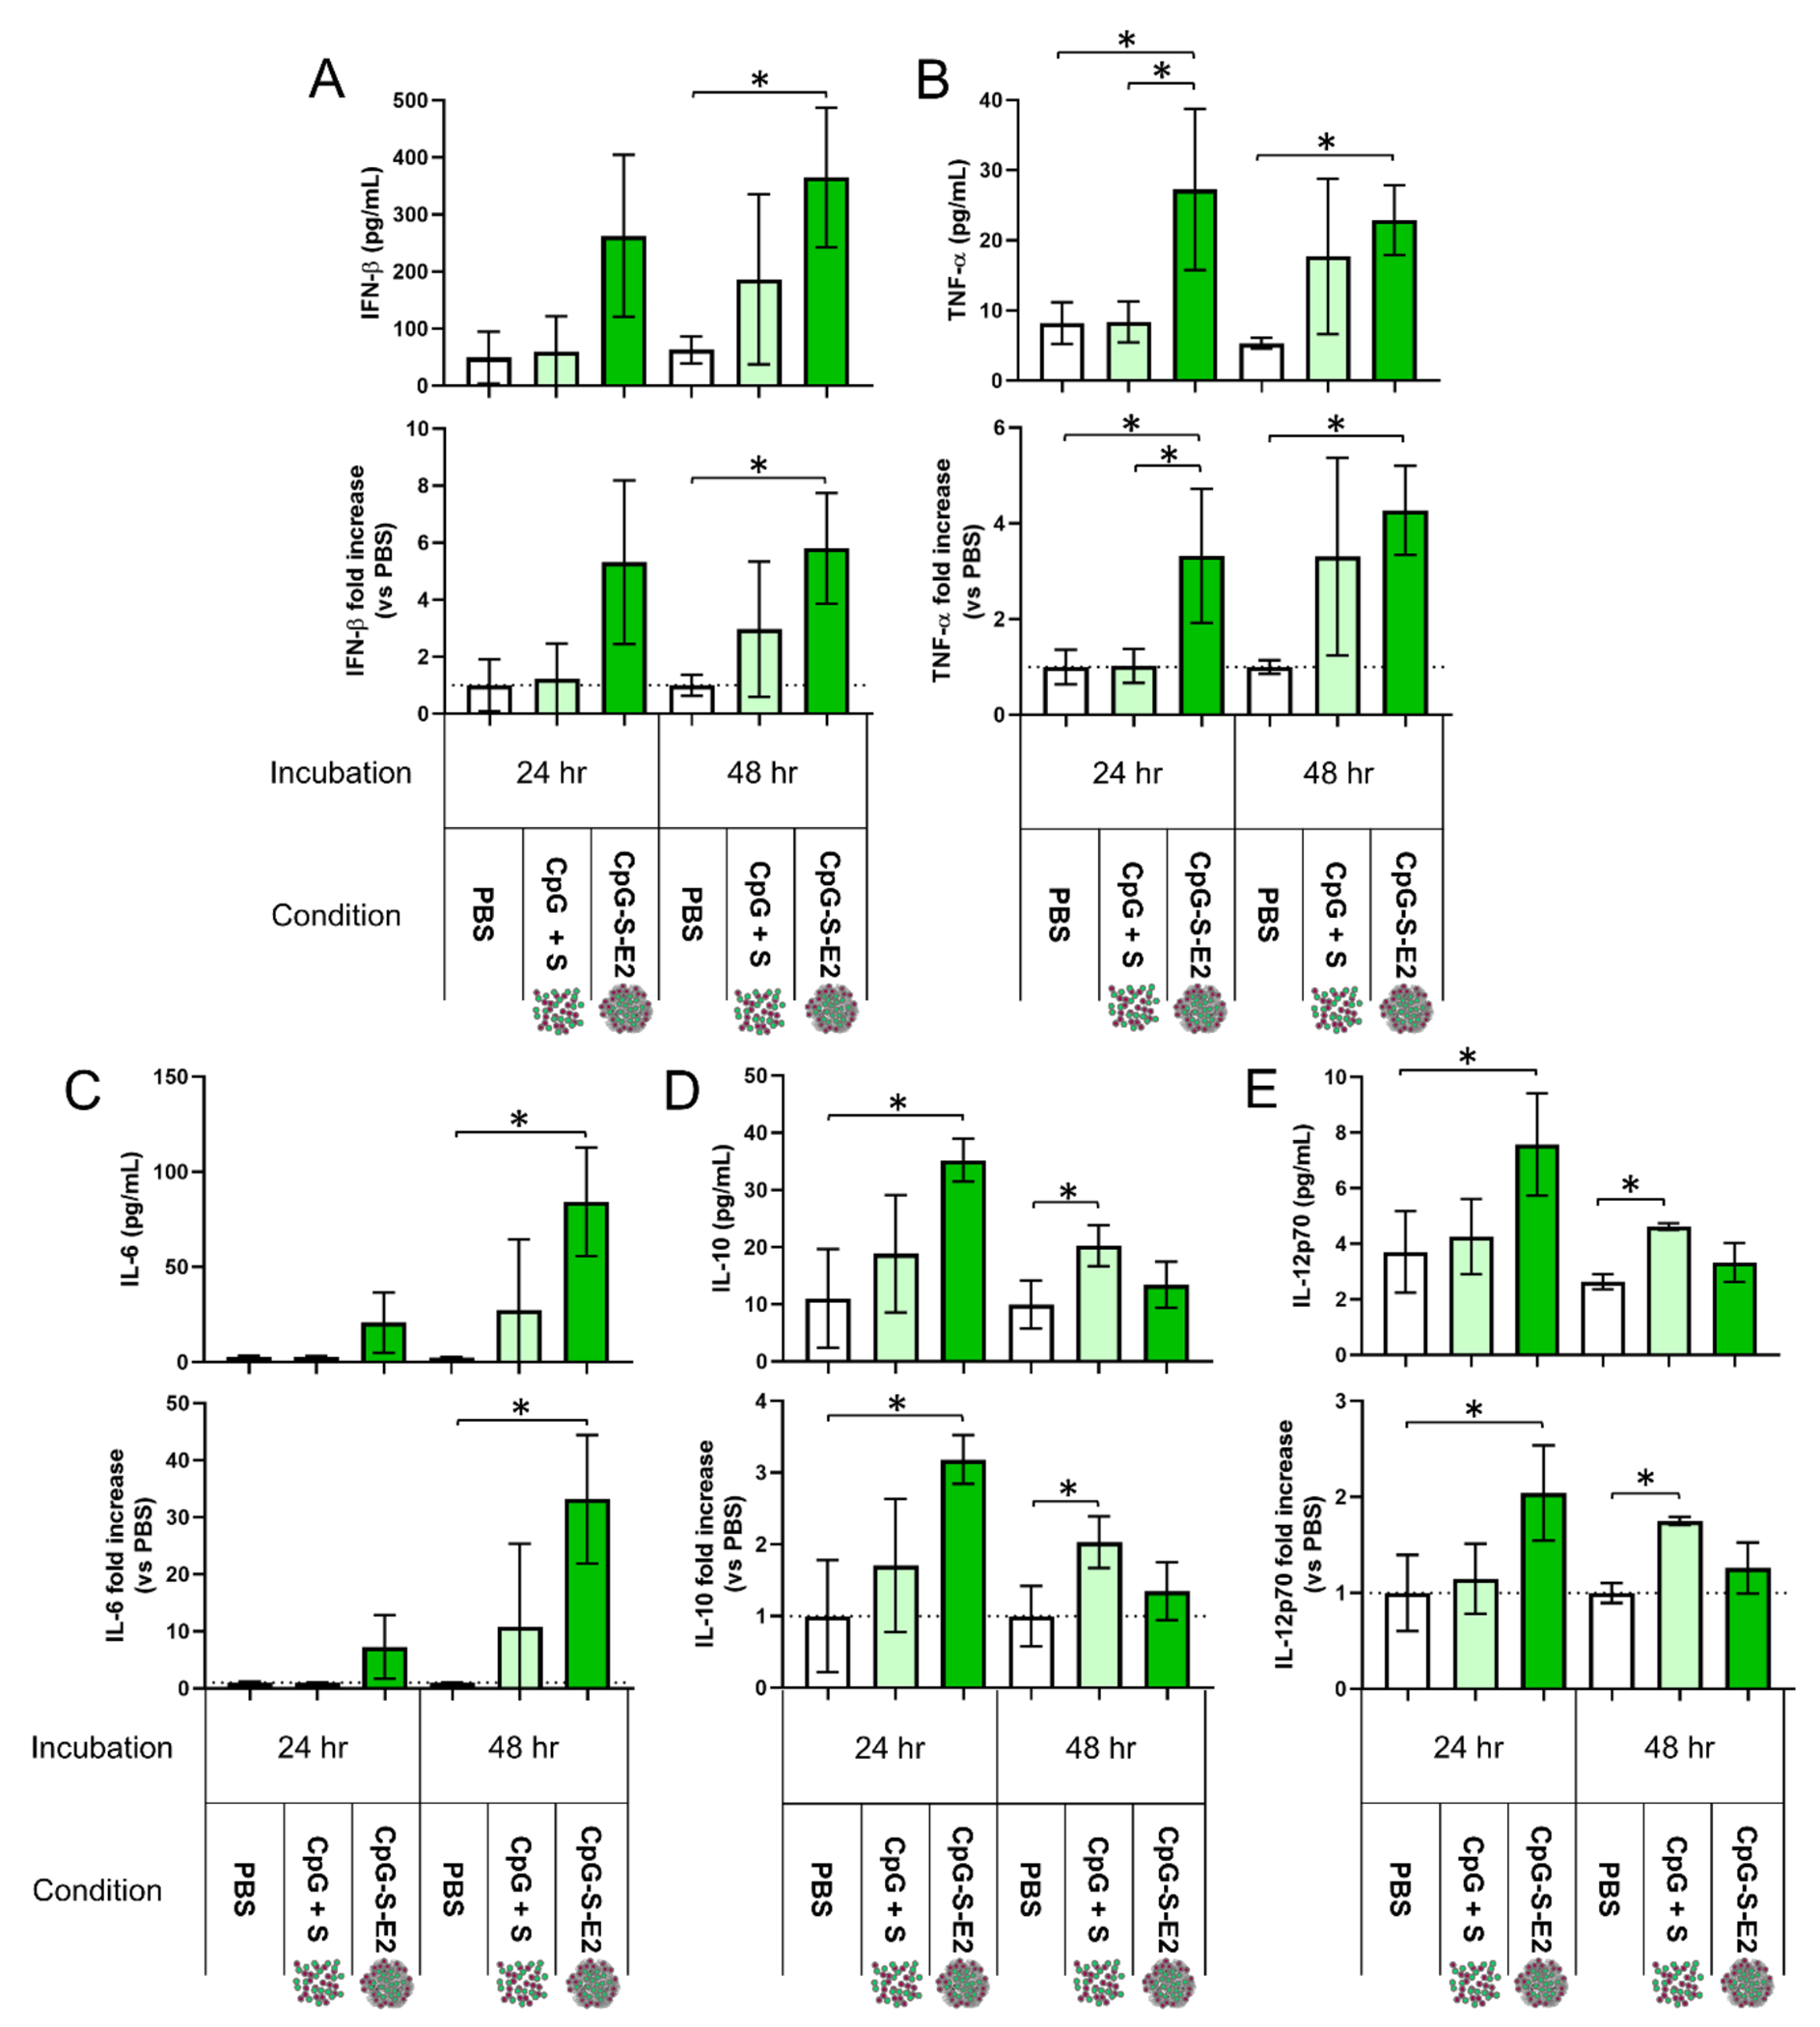
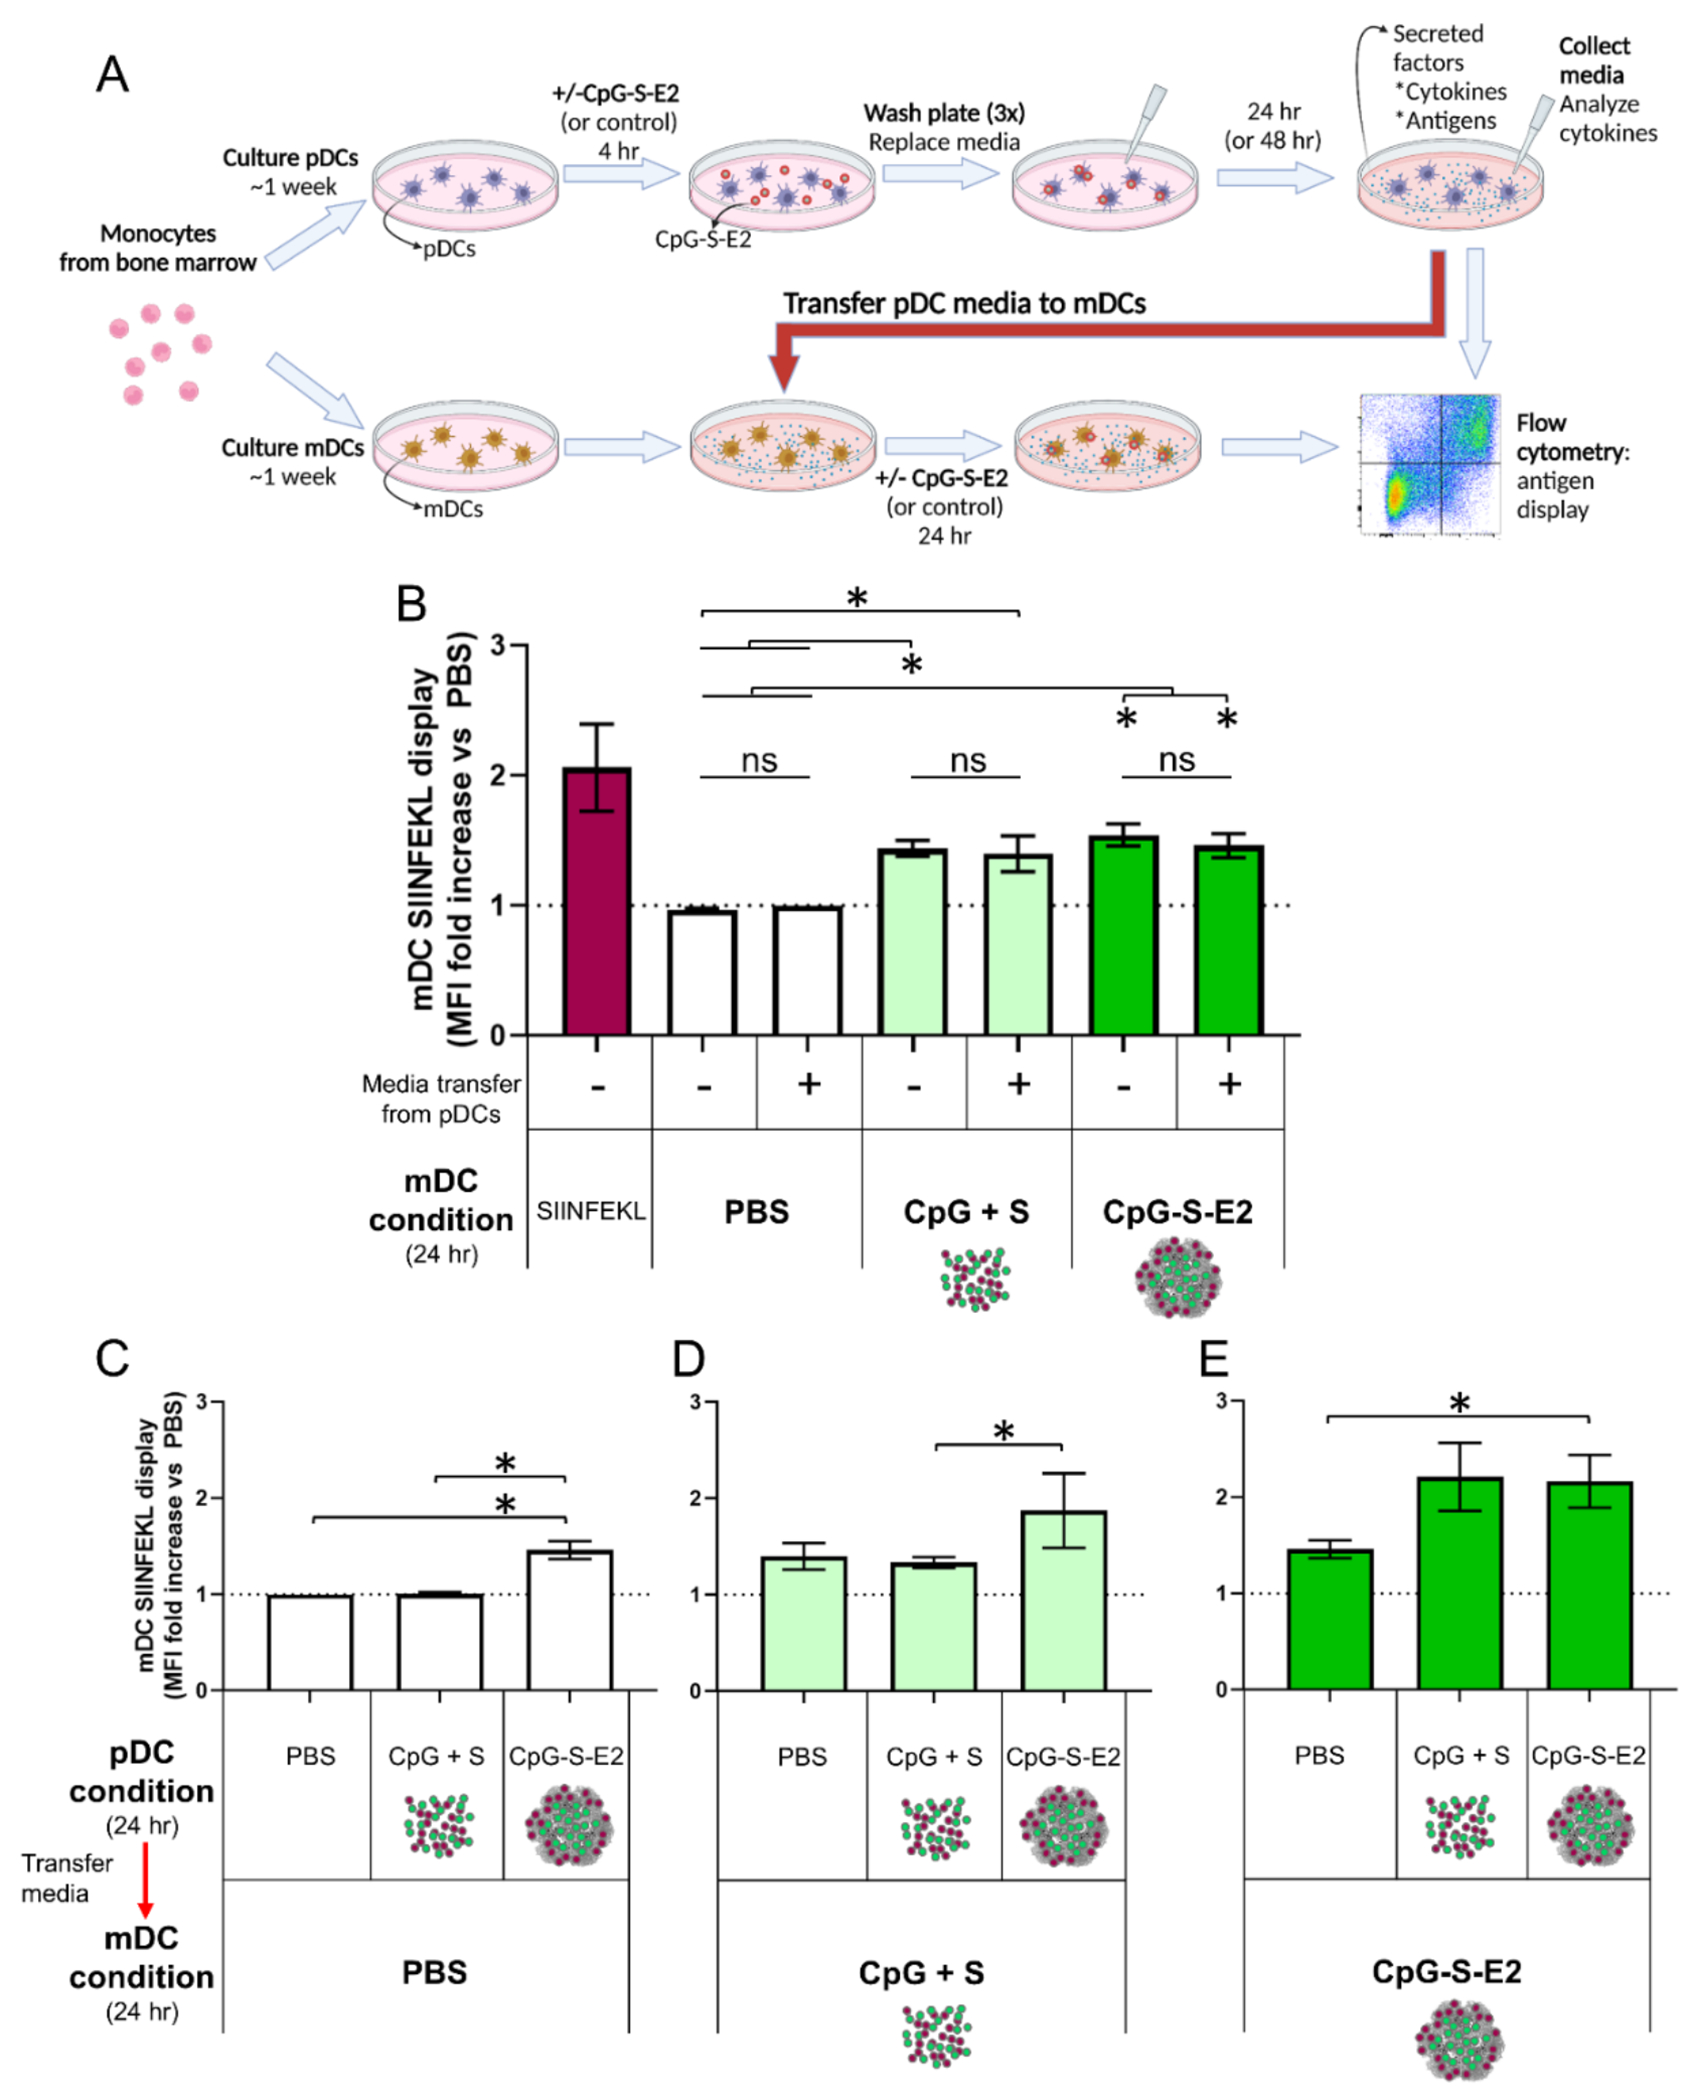
Cancer vaccine immunotherapy facilitates the immune system's recognition of tumor-associated antigens, and the biomolecular design of these vaccines using nanoparticles is one important approach towards obtaining strong anti-tumor responses. Following activation of dendritic cells (DCs), a robust CD8+ T cell-mediated adaptive immune response is critical for tumor elimination. While the role of efficient antigen-presenting myeloid DCs (mDCs) is conventionally attributed towards vaccine efficacy, participation by highly cytokine-producing plasmacytoid DCs (pDCs) is less understood and is often overlooked. We examined vaccines based on the E2 protein nanoparticle platform that delivered encapsulated TLR9 agonist bacterial-like DNA (CpG1826 or CpG1018) or TLR7 agonist viral ssRNA to determine their efficacy over free agonists in activating both mDCs and pDCs for antigen presentation. Although mDCs were only activated by nanoparticle-encapsulated TLR9 agonists, pDCs were activated by all the individually tested constructs, and CpG1826 was shown to induce pDC cytokine production. Transfer of secreted factors from pDCs that were stimulated with a vaccine formulation comprising peptide antigen and CpG1826 enhanced mDC display of the antigen, particularly when delivered in nanoparticles. Only when treated with nanoparticle-conjugated vaccine could pDCs secrete factors to induce antigen display on naïve mDCs. These results reveal that pDCs can aid mDCs, highlighting the importance of activating both pDCs and mDCs in designing effective cancer vaccines, and demonstrate the advantage of using nanoparticle-based vaccine delivery.
Conflict of interest statement
6. Conflicts of interest
There are no conflicts to declare.
Figures
Similar articles
-
Plasmacytoid DCs, exposed to TSLP in synergy with TLR ligands, acquire significant potential towards Th2 polarization.Med Sci Monit Basic Res. 2013 Dec 13;19:291-9. doi: 10.12659/msmbr.889791. Med Sci Monit Basic Res. 2013. PMID: 24335833 Free PMC article.
-
Naturally produced type I IFNs enhance human myeloid dendritic cell maturation and IL-12p70 production and mediate elevated effector functions in innate and adaptive immune cells.Cancer Immunol Immunother. 2018 Sep;67(9):1425-1436. doi: 10.1007/s00262-018-2204-2. Epub 2018 Jul 13. Cancer Immunol Immunother. 2018. PMID: 30019146 Free PMC article.
-
Dendritic Cell-Based Vaccines that Utilize Myeloid Rather than Plasmacytoid Cells Offer a Superior Survival Advantage in Malignant Glioma.J Immunol. 2015 Jul 1;195(1):367-76. doi: 10.4049/jimmunol.1401607. Epub 2015 May 29. J Immunol. 2015. PMID: 26026061 Free PMC article.
-
Plasmacytoid Dendritic Cells as Cell-Based Therapeutics: A Novel Immunotherapy to Treat Human Immunodeficiency Virus Infection?Front Cell Infect Microbiol. 2020 May 26;10:249. doi: 10.3389/fcimb.2020.00249. eCollection 2020. Front Cell Infect Microbiol. 2020. PMID: 32528903 Free PMC article. Review.
-
DC-Based Vaccines for Cancer Immunotherapy.Vaccines (Basel). 2020 Nov 26;8(4):706. doi: 10.3390/vaccines8040706. Vaccines (Basel). 2020. PMID: 33255895 Free PMC article. Review.
Cited by
-
Endogenous capsid-forming protein ARC for self-assembling nanoparticle vaccines.J Nanobiotechnology. 2024 Aug 27;22(1):513. doi: 10.1186/s12951-024-02767-z. J Nanobiotechnology. 2024. PMID: 39192264 Free PMC article.
-
Engineering Protein Nanoparticles Functionalized with an Immunodominant Coxiella burnetii Antigen to Generate a Q Fever Vaccine.Bioconjug Chem. 2023 Sep 20;34(9):1653-1666. doi: 10.1021/acs.bioconjchem.3c00317. Epub 2023 Sep 8. Bioconjug Chem. 2023. PMID: 37682243 Free PMC article.
-
Co-Delivery of Multiple Toll-Like Receptor Agonists and Avian Influenza Hemagglutinin on Protein Nanoparticles Enhances Vaccine Immunogenicity and Efficacy.Adv Healthc Mater. 2025 Apr;14(10):e2404335. doi: 10.1002/adhm.202404335. Epub 2025 Feb 9. Adv Healthc Mater. 2025. PMID: 39924738 Free PMC article.
-
Development of a single-dose Q fever vaccine with an injectable nanoparticle-loaded hydrogel: effect of sustained co-delivery of antigen and adjuvant.Drug Deliv. 2025 Dec;32(1):2476144. doi: 10.1080/10717544.2025.2476144. Epub 2025 May 2. Drug Deliv. 2025. PMID: 40314164 Free PMC article.
References
-
- Richardson L, Dowling N and Henley J, An Update on Cancer Deaths in the United States, https://www.cdc.gov/cancer/dcpc/research/update-on-cancer-deaths/index.htm, (accessed April, 2022).
MeSH terms
Substances
Grants and funding
LinkOut - more resources
Full Text Sources
Medical
Research Materials